
Abstract
Regenerative responses after hypoxia-ischemia (HI) were investigated in the immature (P9) and juvenile (P21) mouse striatum and cortex by postischemic 5-bromo-2-deoxyuridine labeling and phenotyping of labeled cells 4 weeks later. HI stimulated the formation of new cells in striatum and cortex in immature, growing brains (P9), but when brain growth was finished (P21) proliferation could be stimulated only in striatum, not in cortex. However, the relative increase was higher in P21 (460%) than P9 striatum (50%), though starting from a lower level at P21. Starting from this lower level, HI-induced proliferation in P21 striatum reached the same level as in P9 striatum, but not higher. Phenotyping revealed that low levels of neurogenesis were still present in nonischemic P9 cortex and striatum, but only in striatum at P21. Ischemia-induced neurogenesis was found only in P9 striatum. Ischemia-induced gliogenesis occurred in P9 and P21 striatum as well as P9 cortex, but not in P21 cortex. Hence, the regenerative response was stronger in striatum than cortex, and stronger in P9 than P21 cortex. The biggest ischemia-induced change was the 49-fold increase in P21 striatal microglia, and this was accompanied by increased inflammation, as judged by the size and numbers of CCL2- and interleukin-18-positive cells.
Introduction
Perinatal hypoxic-ischemic (HI) brain injury contributes to mortality and long-term neurologic impairments (e.g., cerebral palsy, mental retardation, learning disability, and epilepsy) (Johnston et al, 2002). The current treatment for infants with HI brain injury is predominantly supportive, including prompt treatment of convulsions and stabilization of physiologic parameters, and in recent years hypothermia has emerged as a promising intervention for neonates with HI encephalopathy (Shankaran et al, 2005). Studies have shown that the adult brain contains neural stem cells and progenitors in the subventricular zone (SVZ) of the lateral ventricle and in the dentate gyrus of the hippocampus (Reynolds and Weiss, 1992) and a number of studies have shown that adult neurogenesis is modulated by various physiologic stimuli and pathophysiologic factors (Kempermann et al, 1997; Plane et al, 2004; van Praag et al, 1999). Neurogenesis is enhanced by ischemic insults and under certain conditions newly produced cells can integrate in the neural network (Hou et al, 2008). Several studies have shown that neurogenesis declines with age (Kuhn et al, 1996; Leuner et al, 2007), indicating that the neonatal brain would possess a greater capacity for neuronal production than the adult brain. A recent study showed that hypoxia-induced neuronal loss in the CA1 of newborn mice was completely restored (Daval et al, 2004), indicating that the therapeutic potential of stimulating intrinsic stem/progenitor cell proliferation, or the use of stem cell transplantation, would be more effective in the neonatal than in the adult brain. It has previously been shown that reduced neurogenesis following ischemic injury correlated with reduced functional recovery (Raber et al, 2004), suggesting that neurogenesis could contribute to functional recovery following cerebral ischemia. The regulation of endogenous neurogenesis and gliogenesis after HI brain injury may provide insights enabling us to develop strategies enhancing the functional improvement after such insults.
The P9 and P21 mouse brains correspond developmentally to newborn and juvenile human brains, respectively (Clancy et al, 2007; Zhu et al, 2005). At P9 the rodent brain is immature and grows rapidly whereas at P21 brain growth is largely completed (Dobbing and Sands, 1979; Fukuda et al, 2005). Previously, we showed intrinsic differences in the way the hippocampus responds to HI at P9 and P21. To our surprise, HI did not increase neurogenesis significantly in the immature P9 dentate gyrus, but it increased several fold in the juvenile P21 brain, reaching the same level as in the normal, noninjured immature brain (Qiu et al, 2007). This indicates that the immature hippocampus is already working at the top of its proliferative capacity and that even though basal neurogenesis decreased with age, the injury-induced generation of new neurons in the juvenile hippocampus could not increase beyond the basal level of the immature brain. It was also shown that HI-induced microglia proliferation was more pronounced in the hippocampus of P21 brains and that this correlated with increased expression of proinflammatory markers. To our knowledge, there are no reports comparing progenitor proliferation, migration, differentiation, and survival at different stages of brain development in other areas of the brain after ischemic insults. The purpose of this study was to investigate the regenerative responses in the striatum and cortex after HI in both immature and juvenile brains.
Materials and methods
Induction of HI Brain Injury
Unilateral HI was induced in C57BL/6 male mice on postnatal day 9 (P9) or 21 (P21), according to the Rice—Vannucci model (Rice et al, 1981; Zhu et al, 2005). Animals were anesthetized with isoflurane (5% for induction, 1.5% to 3.0% for maintenance) in a mixture of nitrous oxide and oxygen (1:1). The duration of anesthesia was less than 5 mins. The left common carotid artery was cut between double ligatures of prolene sutures (6.0). After the surgical procedures the wounds were infiltrated with lidoocaine for analgesia. The pups were returned to their cages for 1 h and then placed in a chamber perfused with a humidified gas mixture (10% oxygen in nitrogen) for 35 (P9) or 30 mins (P21) at 36°C. The P9 brain is relatively more resistant to ischemia than the P21 brain (Towfighi et al, 1997). We have titrated the hypoxia times such that the overall injury, as judged by loss of MAP-2 staining, neuropathology score and tissue loss, is the same at the two ages (Zhu et al, 2005). Following hypoxic exposure, the pups returned to their dams or the biologic cages. Control pups were neither subjected to ligation nor hypoxia. All the animal experiments were approved by the Gothenburg Committee of the Swedish Animal Welfare Agency (94-2003).
BrdU Administration
The thymidine analog 5-bromodeoxyuridine (BrdU; Roche, Mannheim, Germany; 5 mg/ml, dissolved in 0.9% NaCl), was injected intraperitoneally at a dose of 50 mg/kg, once daily for 7 consecutive days, starting from 24 h after HI (groups P9-1 and P21-1). In separate experiments, BrdU was injected daily for 7 days, either during the second (group P9-2) or third week (group P9-3) after HI in P9 mice, to compare proliferation and survival cells after HI during the first week with the 2 consecutive weeks. All animals were killed 28 days after the last BrdU injection (Figure 1).
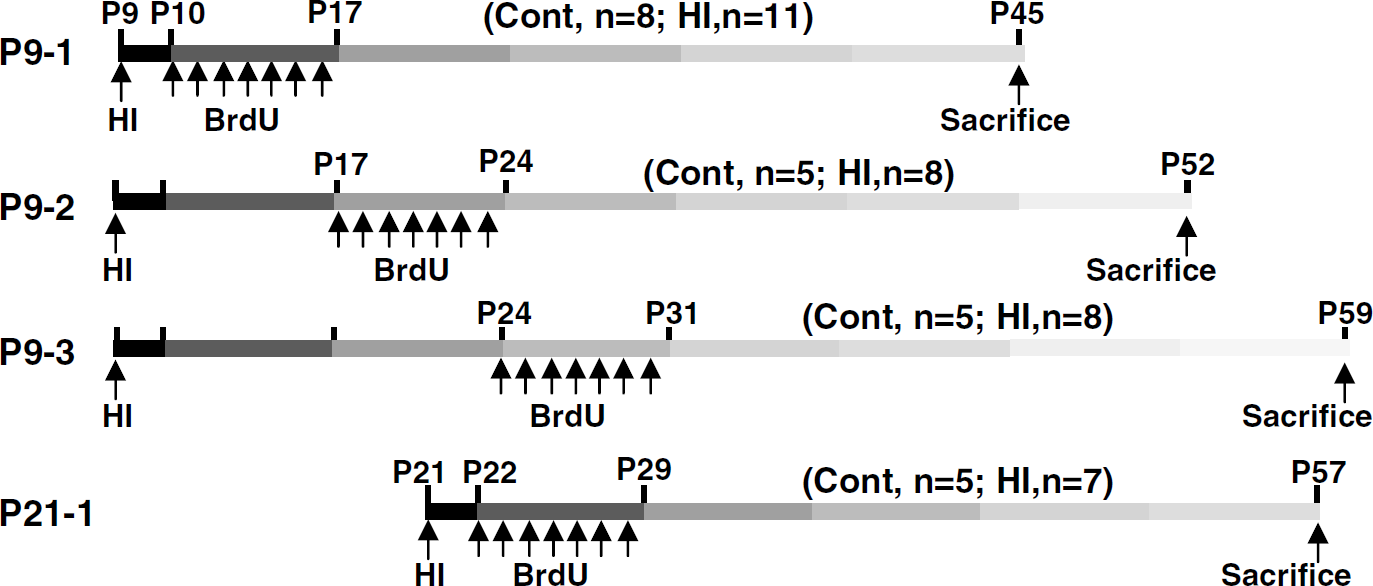
Experimental design. Mice were subjected to HI on postnatal day 9 (P9) or P21 and received BrdU once daily for 7 days, starting from one day after the insult. BrdU was injected during the first (P9-1), second (P9-2), or third (P9-3) week after HI in P9 mice or during the first week after HI in P21 mice (P21-1). Control mice received BrdU but were not subjected to HI. Animals were killed 4 weeks after last BrdU injection. The number of animals for each group is indicated.
Immunohistochemistry
The animals were deeply anesthetized with 50 mg/ml phenobarbital and perfusion fixed with 5% formaldehyde in 0.1 mol/L PBS, followed by immersion fixation in the same fixative for 24 h at 4°C. After dehydration with graded ethanol and xylene, the brains were paraffin embedded. Serial 5 µm coronal sections were cut and mounted on glass slides. Every 50th pair of sections was stained for BrdU.
Antigen retrieval was performed by boiling the sections in 10 mmol/L citrate buffer (pH 6.0) for 10 mins. Sections were incubated for 30 mins in 4% donkey or horse serum in phosphate-buffered saline to block nonspecific binding. Monoclonal rat anti-BrdU primary antibody (1:100, 5 µg/ml; clone: BU1/75; Oxford Biotechnology Ltd, Oxfordshire, UK) was applied and incubated at 22°C for 60 mins, followed by biotinylated donkey anti-rat immunoglobulin G (IgG; H+ L) secondary antibody (1:200, 5.5 µg/ml; Jackson Immuno Research Laboratories, West Grove, PA, USA) for 60 mins at 22°C. To detect inflammation, sections were incubated with antibodies against macrophage/monocyte chemoattractant protein 1 (CCL2; 4 µg/ml, sc-1785; Santa Cruz Biotechnology, Santa Cruz, CA, USA) or interleukin-18 (IL-18; 4 µg/ml, sc-6179; Santa Cruz Biotechnology) at 4°C overnight, followed by biotinylated horse anti-goat IgG (2 µg/ml) for 60 mins. Endogenous peroxidase activity was blocked with 3% H2O2 in phosphate-buffered saline for 10 mins. Visualization was performed using Vectastain ABC Elite (Vector Laboratories, Burlingame, CA, USA) with 0.5 mg/ml 3,3‘-diaminobenzidine enhanced with 15mg/ml ammonium nickel sulfate, 2 mg/ml β-D glucose, 0.4mg/ml ammonium chloride, and 0.01 mg/ml β-glucose oxidase (all from Sigma, Stockholm, Sweden).
To detect colocalization of microglia and proinflammatory markers (CCL2, IL-18), sections were incubated with rabbit anti-Iba1 (1:1000, 0.5 µg/ml; Wako, Osaka, Japan) and either goat anti-CCL2 (sc-1785, 4 µg/ml; Santa Cruz) or goat anti-IL-18 (sc-6179, 4 µg/ml; Santa Cruz) for 60 mins at 22°C. After washing, the sections were incubated with secondary antibodies, Alexa Fluor 488 donkey anti-goat IgG (H+ L) combined with Alexa Fluor 555 donkey anti-rabbit IgG (H+ L; 1:500) at 22°C for 60mins. After washing, the sections were mounted using Vectashield mounting medium.
The phenotypes of BrdU-labeled cells were determined using antibodies against NeuN, APC, S100β, or Iba1 to detect mature neurons, oligodendrocytes, astrocytes, and microglia, respectively. Antigen recovery, was performed as above, followed by incubation of rat anti-BrdU (1:100, 5 µg/ml; clone: BU1/75; Oxford Biotechnology Ltd.) together with one of the following: mouse anti-NeuN monoclonal antibody (1:200, 5 µg/ml; clone: MAB377; Chemicon, Temecula, CA, USA), mouse anti-APC monoclonal antibody (1:100, 1 µg/ml; clone: CC-1; Calbiochem, Darmstadt, Germany), rabbit anti-S-100β (1:1000; Swant, Bellinzona, Switzerland), or rabbit anti-Iba1 antibody (1:1000, 0.5 µg/ml; Wako) in phosphate-buffered saline at 22°C for 60 mins. After washing, the sections were incubated with secondary antibodies, Alexa Fluor 488 donkey anti-rat IgG (H + L), combined with either Alexa Fluor 555 donkey anti-mouse IgG (H + L) or Alexa Fluor 555 donkey anti-rabbit IgG (H + L) at 22°C for 60 mins. All secondary antibodies were from Molecular Probes and were diluted 1:500. After washing, the sections were mounted using Vectashield mounting medium.
Cell Counting and Size
In every 50th section, area contours were drawn and measured, and BrdU-positive cells were counted in the cortex and striatum using the Stereo Investigator software (MicroBrightField, Magdeburg, Germany). Positive cells were expressed as average number per mm3. For phenotypic determination, at least 50 BrdU-positive cells were counted in each brain region and the ratio of double-labeled cells was calculated for the cortex and striatum separately. The total number of BrdU-positive cells of each phenotypic lineage was calculated by applying the specific ratios to the total number of BrdU-positive cells for each brain region. The CCL2 and IL-18 positive cells were counted at ×400 magnification (one visual field = 0.196 mm2). Three visual fields were counted in the border zone of the infarct and expressed as average number per visual field. CCL2-positive cells were captured at ×400 magnification in the border zone between infarcted and intact tissue. The long and short diameters of CCL2-positive cells were measured using Micro Image (Olympus, Japan) and the average of the two was used as the diameter of the cell. Thirty cells were measured from each sample and the average diameter was calculated and used as n = 1.
Statistics
All data are expressed as mean±s.e.m. An unpaired t-test was used when comparing CCL-2 and IL-18 between P9 and P21. ANOVA with Fisher's post hoc test was used when comparing more than two groups.
Results
BrdU Labeling in the Striatum
Numerous BrdU-labeled cells, proliferating at the time of injection and surviving 5 weeks after HI (4 weeks after the last injection), were detected in the nonischemic, control striatum of P9 and P21 mice. In the group P9-1, BrdU-positive cells were scattered throughout the striatum (3484 ± 148), but were significantly fewer in the P9-2 (703 ± 46), P9-3 (471 ± 14), and P21-1 (755 ± 224) groups (Figures 2A–2D and 2Q). Following HI at P9, the density of BrdU-labeled cells was 50% higher in group P9-1 (Figures 2E and 2Q) compared with control mice. However, when HI was induced at P21, the density of BrdU-labeled cells increased 4.6-fold (group P21-1 Figures 2H and 2Q). During the second week following HI at P9 (group P9-2), the density of BrdU-labeled cells more than doubled (113%) when compared with control mice, although the basal level was much lower than during the first week after HI (Figures 2B, 2F, and 2Q). During the third week following HI at P9 (group P9-3), the density of BrdU-labeled cells was also significantly increased after HI (67%) when compared with control mice, but the density was significantly lower than during the first week (Figures 2C, 2G, and 2Q). In the contralateral, hypoxic hemispheres, there were no significant changes in the density of BrdU-labeled cells in any group when compared with their respective controls (Figure 2Q).
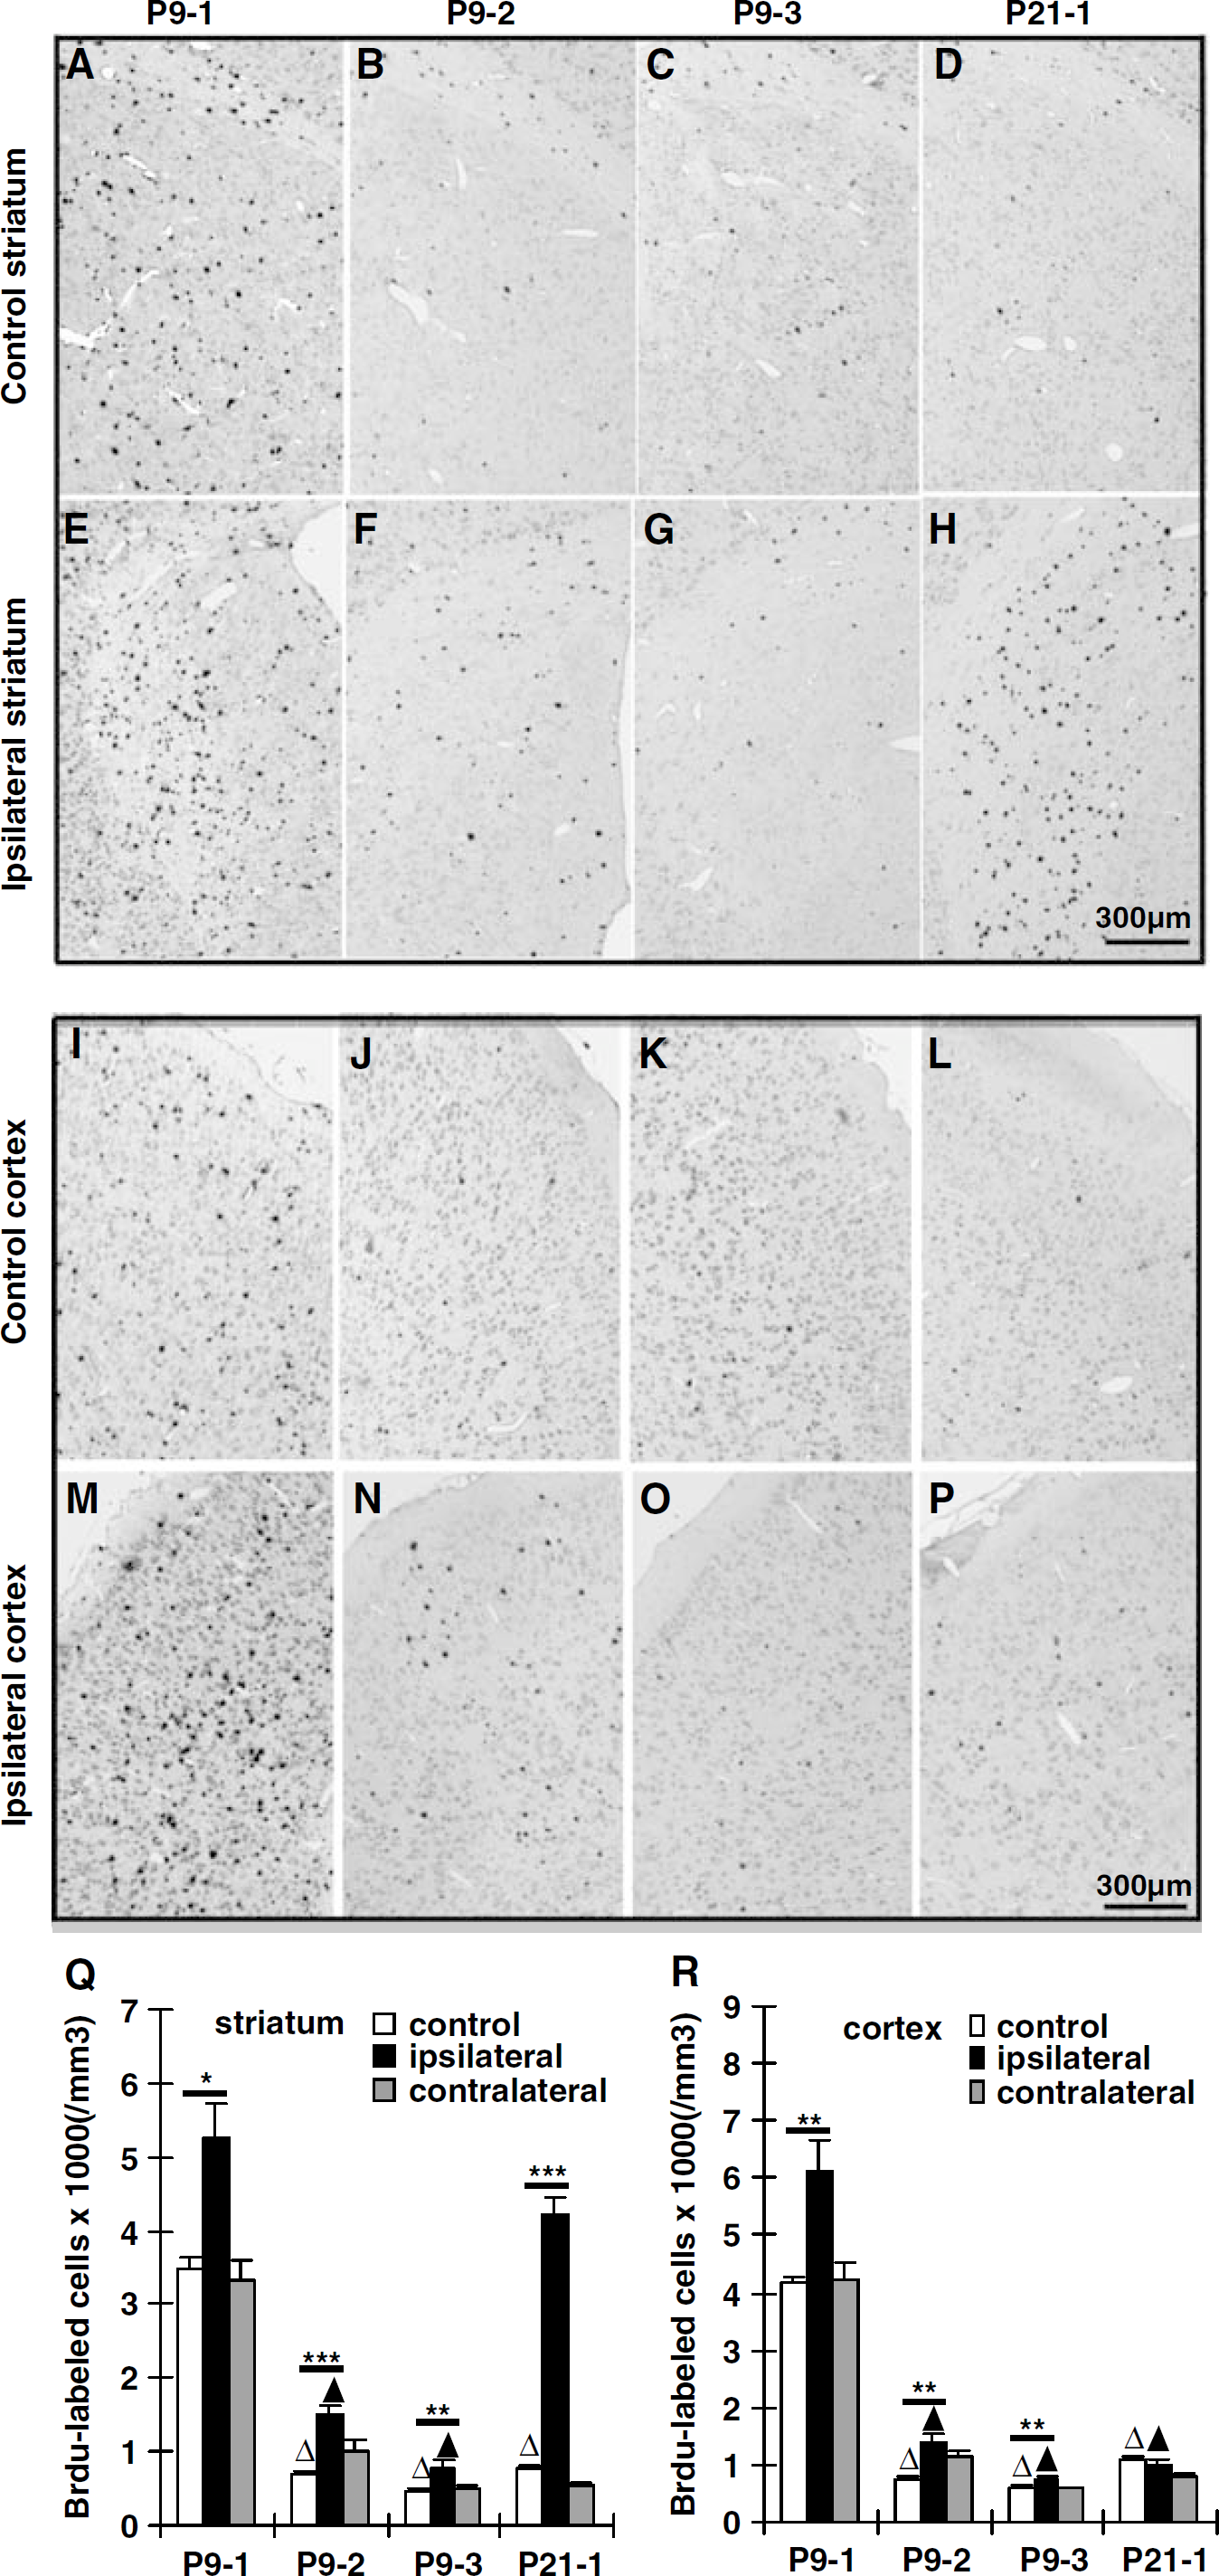
BrdU labeling in the striatum and cortex. Representative BrdU stainings of the striatum (
BrdU Labeling in the Cortex
In control mice, the density of BrdU-positive cells in the cortex was similar to that in the striatum at all ages (Figures 2I–2L and 2R). At P9 the cells labeled in the cortex during the first (group P9-1), second (group P9-2) and third (group P9-3) weeks after HI, still remaining 4 weeks later, followed a similar pattern as in the striatum (increased 47%, 92%, and 29%, respectively; Figures 2M–2O and 2R). However, when HI was induced at P21, there was no significant change in the density of labeled cells during the first week after HI (Figures 2O and 2R). These results stand in contrast to the striatum, where there was a 4.6-fold increase after HI at P21 (Figure 2Q). As in the striatum, the cortex of the contralateral hemispheres did not display any significant changes (Figure 2R).
Phenotyping
To determine the phenotype of surviving BrdU-labeled cells, they were examined for expression of NeuN (mature neurons; Figure 3), APC (oligodendrocytes), S100β (astrocytes), and Iba1 (microglia; Figure 4). The percentage of BrdU-labeled cells identified by one of the four markers used varied considerably between the groups, and the variation was most pronounced in the cortex. The ratio of phenotypically identified cells increased with age, but also after hypoxia (as in the contralateral hemisphere) and HI (as in the ipsilateral hemisphere; Table 1). Less than half of the BrdU-labeled cells in the nonischemic P9-1 cortex (46.6 ± 1.9%) were colabeled with one of the four markers and this ratio increased to 75.7 ± 1.7% in the nonischemic P21-1 group (P < 0.0001). Hypoxia and HI in the P9-1 group increased the ratio of phenotypically identified cells to 54.0 ± 1.6% (P = 0.0443) and 60.4 ± 3.2% (P = 0.0008), respectively. Hypoxia and HI in the P21-1 group increased the ratio of phenotypically identified cells to 94.0 ± 3.6% (P = 0.0117) and 89.5 ± 4.0% (P = 0.0392), respectively. The changes in the striatum were similar but less pronounced (Table 1).
Phenotypically identified cells (avg %±s.e.m.)
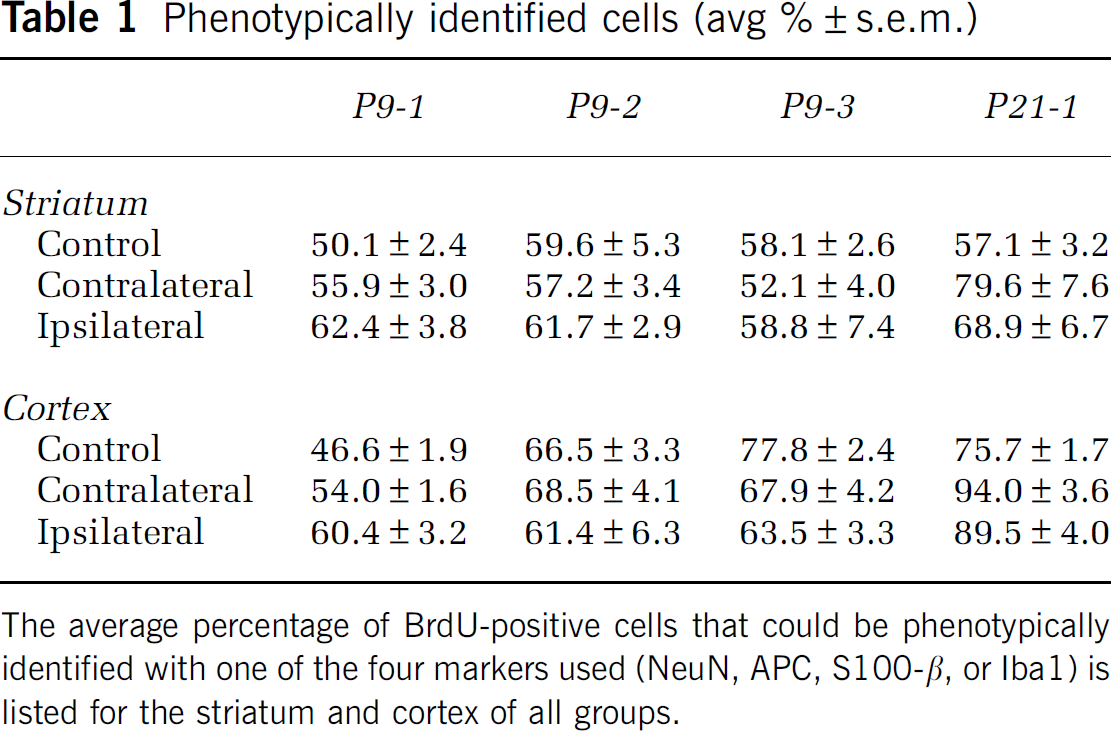
The average percentage of BrdU-positive cells that could be phenotypically identified with one of the four markers used (NeuN, APC, S100-β, or Iba1) is listed for the striatum and cortex of all groups.
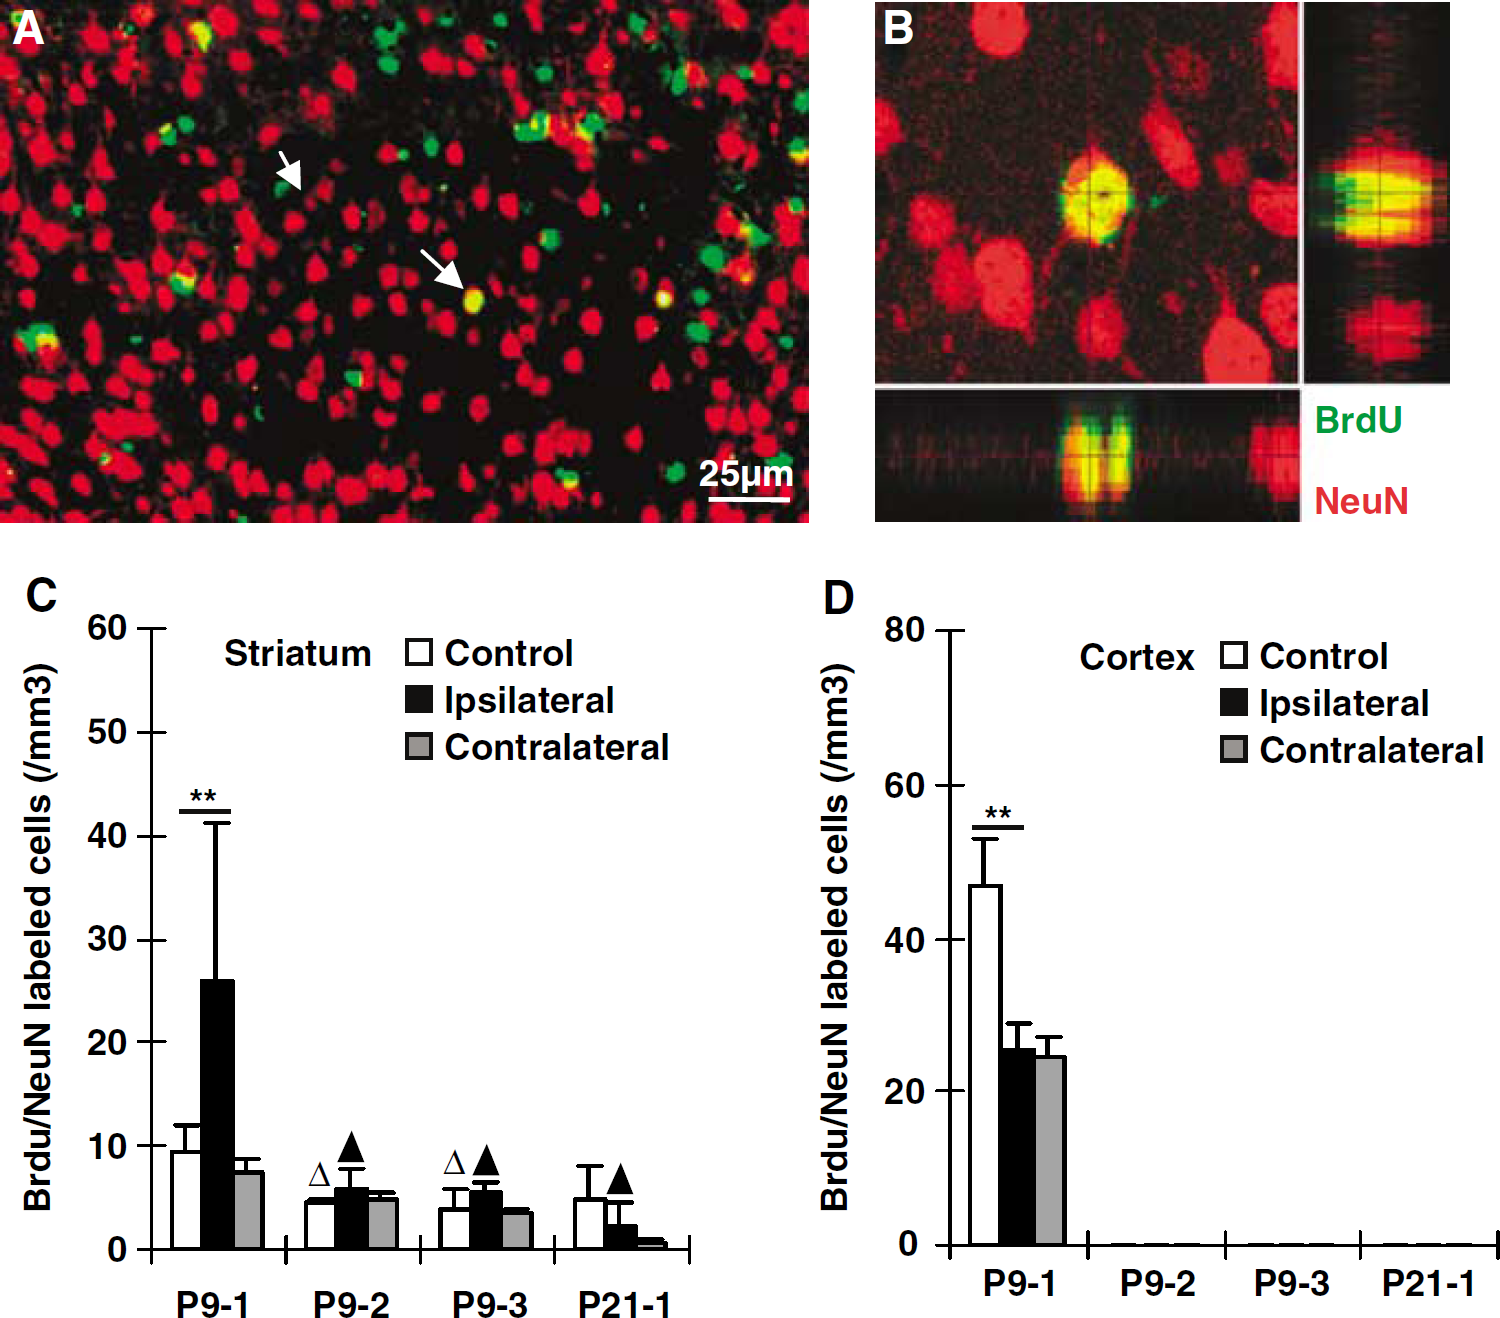
Neurogenesis after HI. Representative immunofluorescence staining of BrdU (green) and NeuN (red) in the ipsilateral cortex during early recovery (P9-1) after HI (
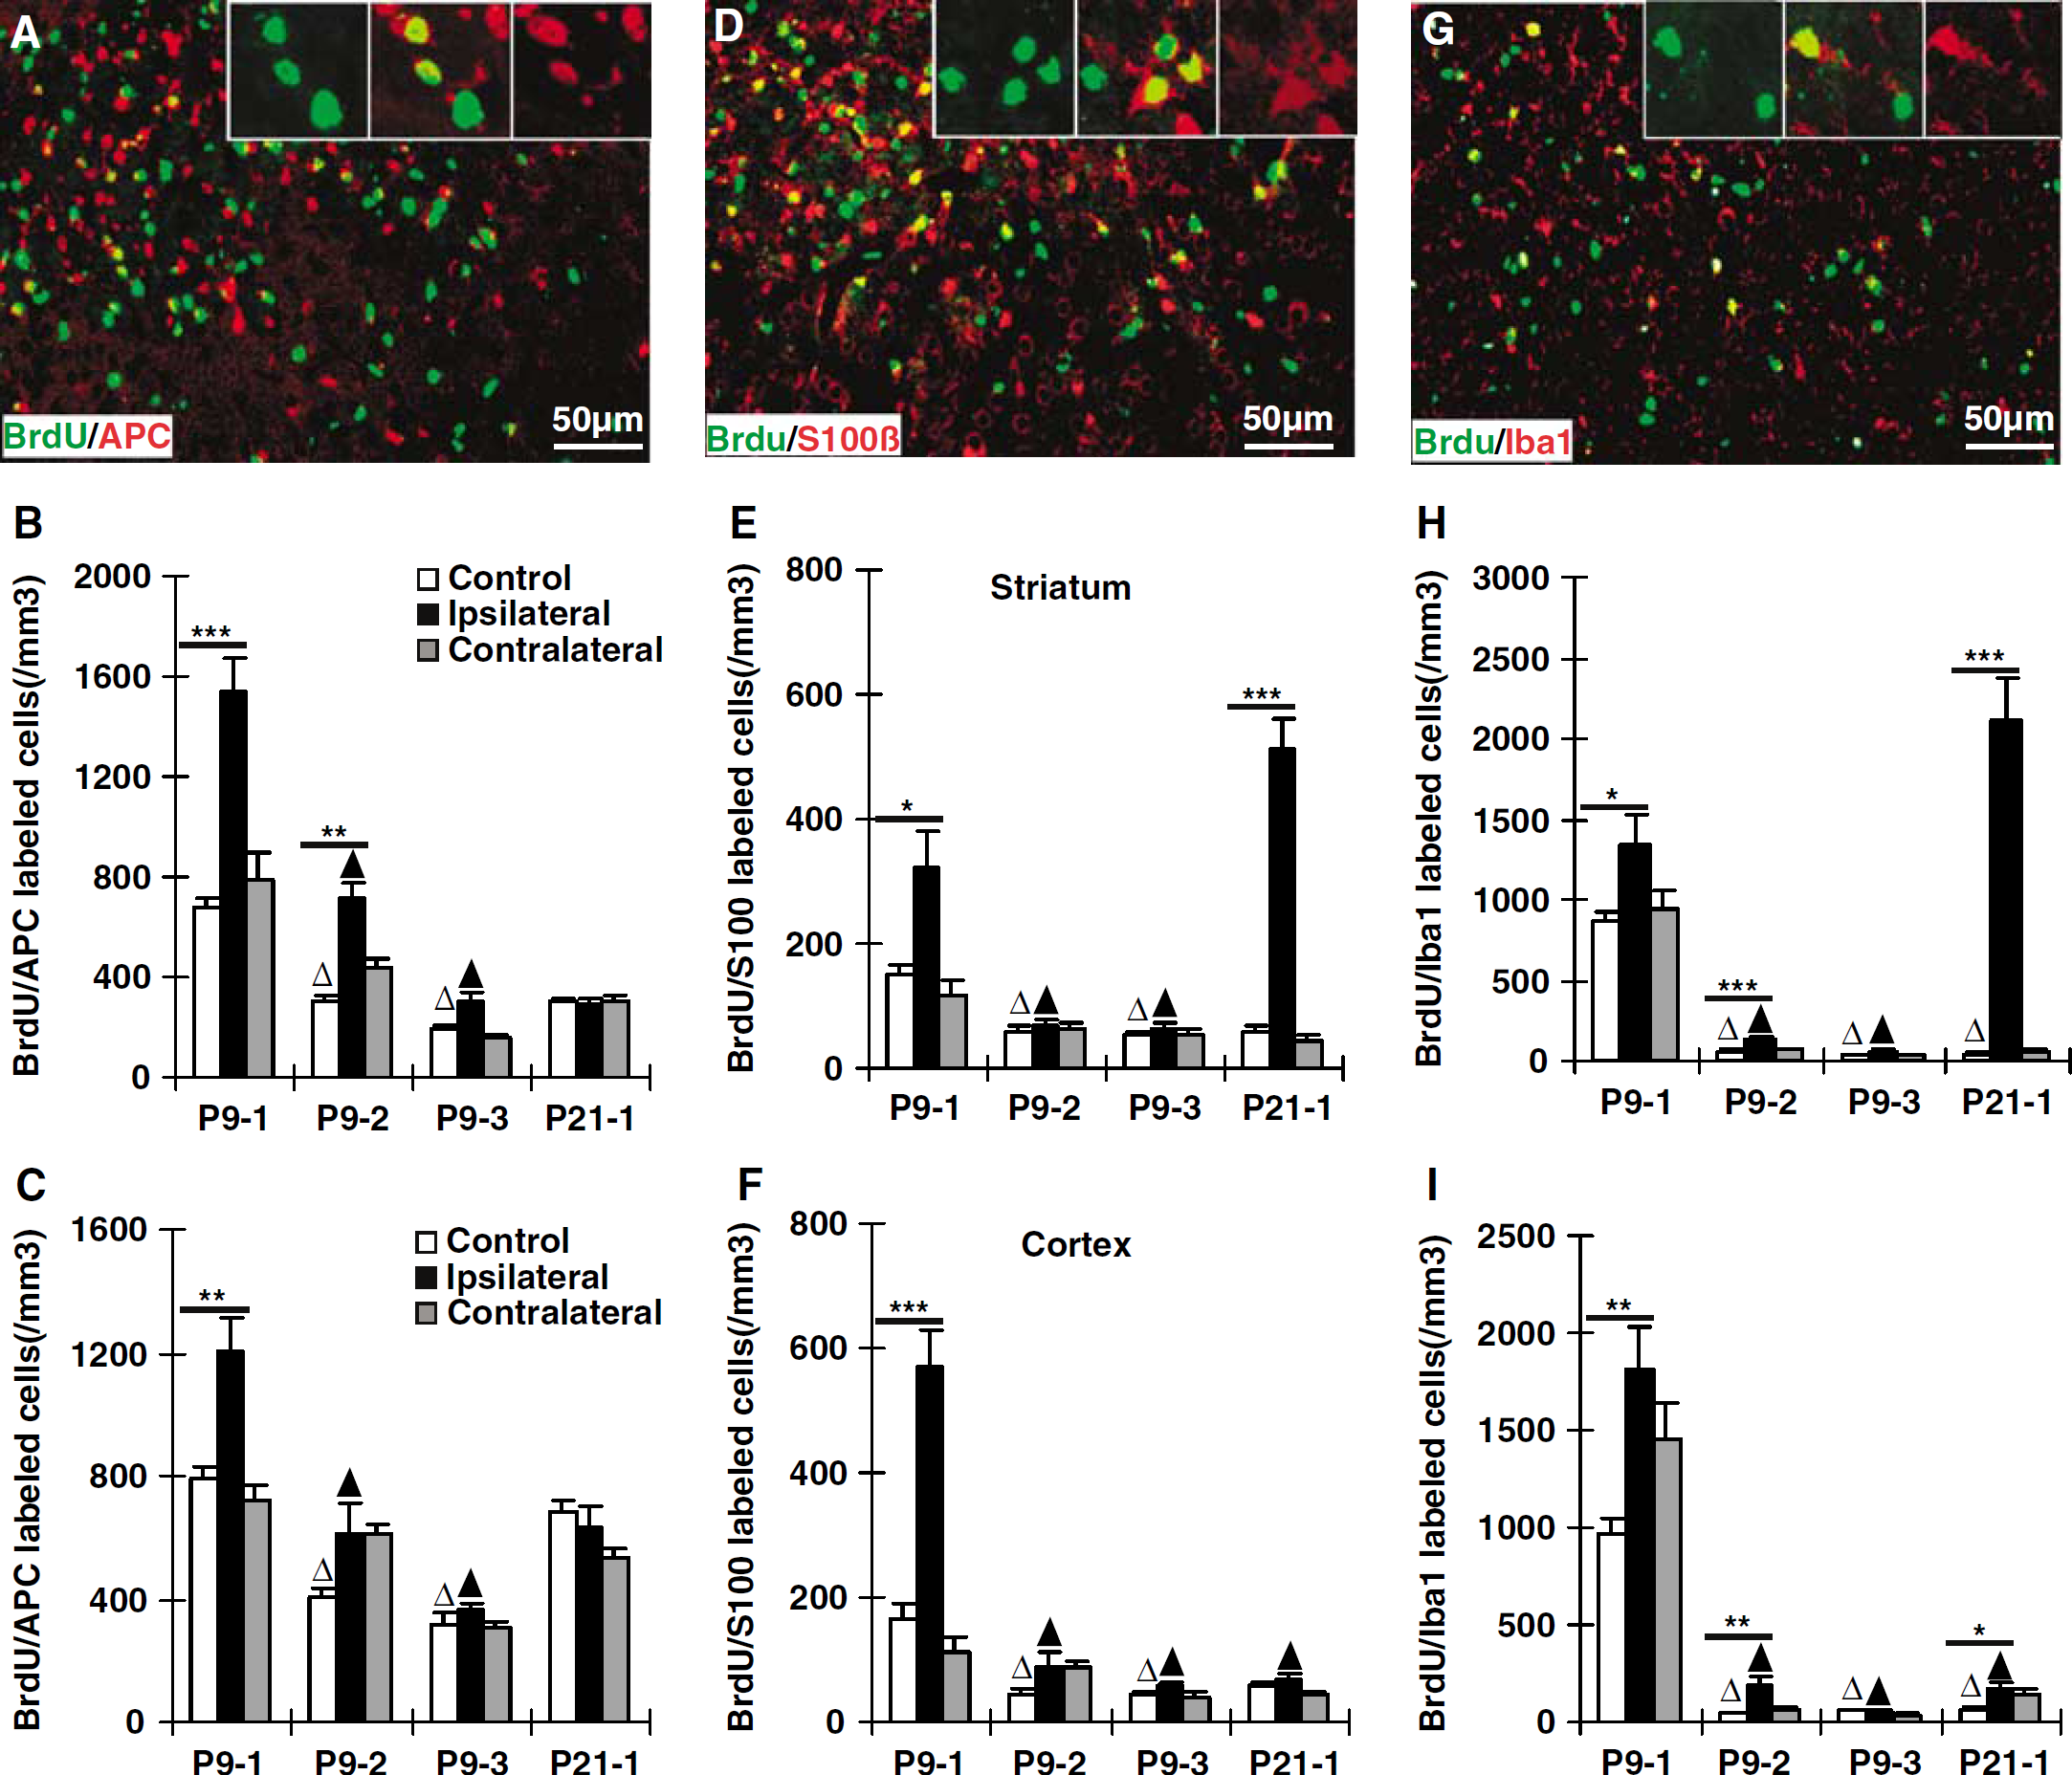
Gliogenesis after HI. Representative immunofluorescence stainings of BrdU/APC (
Neurogenesis
In the striatum, BrdU/NeuN double-positive cells could be detected in all the nonischemic control groups at a frequency lower than 1% of the total number of BrdU-positive cells (Figure 3C). Following HI at P9, BrdU/NeuN double-labeled cells increased 176% in the striatum when cells were labeled during the first week after the insult (group P9-1). However, none of the other groups displayed significant changes in BrdU/NeuN double-labeled cells after HI, neither in the ipsilateral, nor in the contralateral hemispheres (Figure 3C). In the cortex of group P9-1 nonischemic control mice, a small portion (approx. 1%) of the BrdU-labeled cells also expressed NeuN (Figures 3A and 3B). However, BrdU-labeling at later time points, from P17 onwards (groups P9-2, P9-3, and P21-1), did not display any colocalization with NeuN in the cortex (Figure 3D). In the P9-1 group, BrdU/NeuN double-positive cells in the cortex were reduced by 45% and 50% in the ipsi- and contralateral hemispheres, respectively (Figure 3D). In summary, limited neurogenesis, approximately 1% or less of all BrdU-labeled cells, appeared to occur in the striatum at all the ages studied, but in the cortex this was restricted to the youngest age (labeling at P10 to 16). After HI, neurogenesis appeared to increase transiently in the striatum but decrease in the cortex.
Gliogenesis
Cells double-positive for BrdU/APC, BrdU/S100β, or BrdU/Iba1 were observed in both the striatum and cortex in all groups (Figure 4).
Oligodendrocytes: BrdU/APC double-positive cells were frequently encountered in the striatum and cortex of control brains, comprising approximately 20% in group P9-1 and 50% or more in groups P9-3 and P21-1 of the total number of BrdU-positive cells (Figures 4A–4C). At P9, the density of BrdU/APC-labeled cells increased significantly in the striatum during the first (group P9-1), second (group P9-2), and, less pronounced, during the third weeks (group P9-3) after HI (Figure 4B). However, in the cortex a significant increase could be detected only in the P9-1 group (Figure 4C). There were no significant changes after HI in the P21-1 group (Figures 4B and 4C). Neither the striatum nor the cortex of the contralateral hemispheres displayed any significant changes in BrdU/APC density (Figures 4B and 4C). In summary, HI-induced oligodendrocyte formation (with cells surviving at least 4 weeks) occurred in P9, but not in P21, brains.
Astrocytes: BrdU/S100β density in the nonischemic striatum and cortex was higher in the P9-1 group (P10 to 16) than in the other control groups (Figures 4D–4F), indicating that astrocyte formation decreased when brain growth leveled out. Following HI at P9, astrocyte formation was increased by 113% in the striatum (Figure 4E) and 241% in the cortex (Figure 4F). When HI was performed at P21, the density of BrdU/S100β-labeled cells in the striatum was 7.7-fold greater than in control mice (Figure 4E). However, there were no HI-induced changes in astrocyte formation at this age in the cortex (Figure 4F). In summary, HI-induced astrocyte formation (with cells surviving at least 4 weeks) occurred in all groups except the cortex of P21 brains.
Microglia: Microglia formation, as judged by BrdU/Iba1 double labeling, was 10- to 20-fold greater in the nonischemic striatum and the cortex of the P9-1 group than in the other nonischemic groups (Figures 4G–4I). Following HI at P9, microglia formation increased 53% in the striatum (Figure 4H) and 89% in the cortex (Figure 4I) during the first week. Significant increases were also detected in the striatum and the cortex of the P9-2 group but not of the P9-3 group (Figures 4H–4I). When HI was performed at P21, microglia formation increased significantly during the first week after the insult in both striatum and cortex (Figures 4H and 4I), but much more pronounced in the striatum. The density of BrdU/Iba1-labeled cells was 49-fold higher than in control mice in the striatum (Figure 4H). In summary, HI-induced microglia formation (with cells surviving at least 4 weeks) was constitutively high in P10 to 16 and increased after injury. The increase after HI at P21 in the striatum was the most pronounced change noted for any cell type or group.
Expression of Proinflammatory Markers Accompanied Microglial Proliferation after HI
To investigate whether the HI-induced (not basal) increase in microglia formation in the ipsilateral hemisphere was accompanied by increased inflammation, two proinflammatory markers, the chemokine CCL2 (also called MCP-1 or Scya2) and the cytokine IL-18, were investigated in tissue sections from animals killed 72 h after HI. Animals subjected to HI at P21 displayed stronger immunoreactivity for these two markers in the injured striatum (Figure 5A) and cortex (Figure 5B). Quantification of immunopositive cells in the striatum and cortex revealed higher numbers of cells positive for both CCL2 (Figure 5C) and IL-18 (Figure 5D) in mice subjected to HI at P21 than at P9. Furthermore, the immunopositive cells, some of which were identified as microglia, were significantly larger in the P21 than in the P9 brains (Figure 5E).
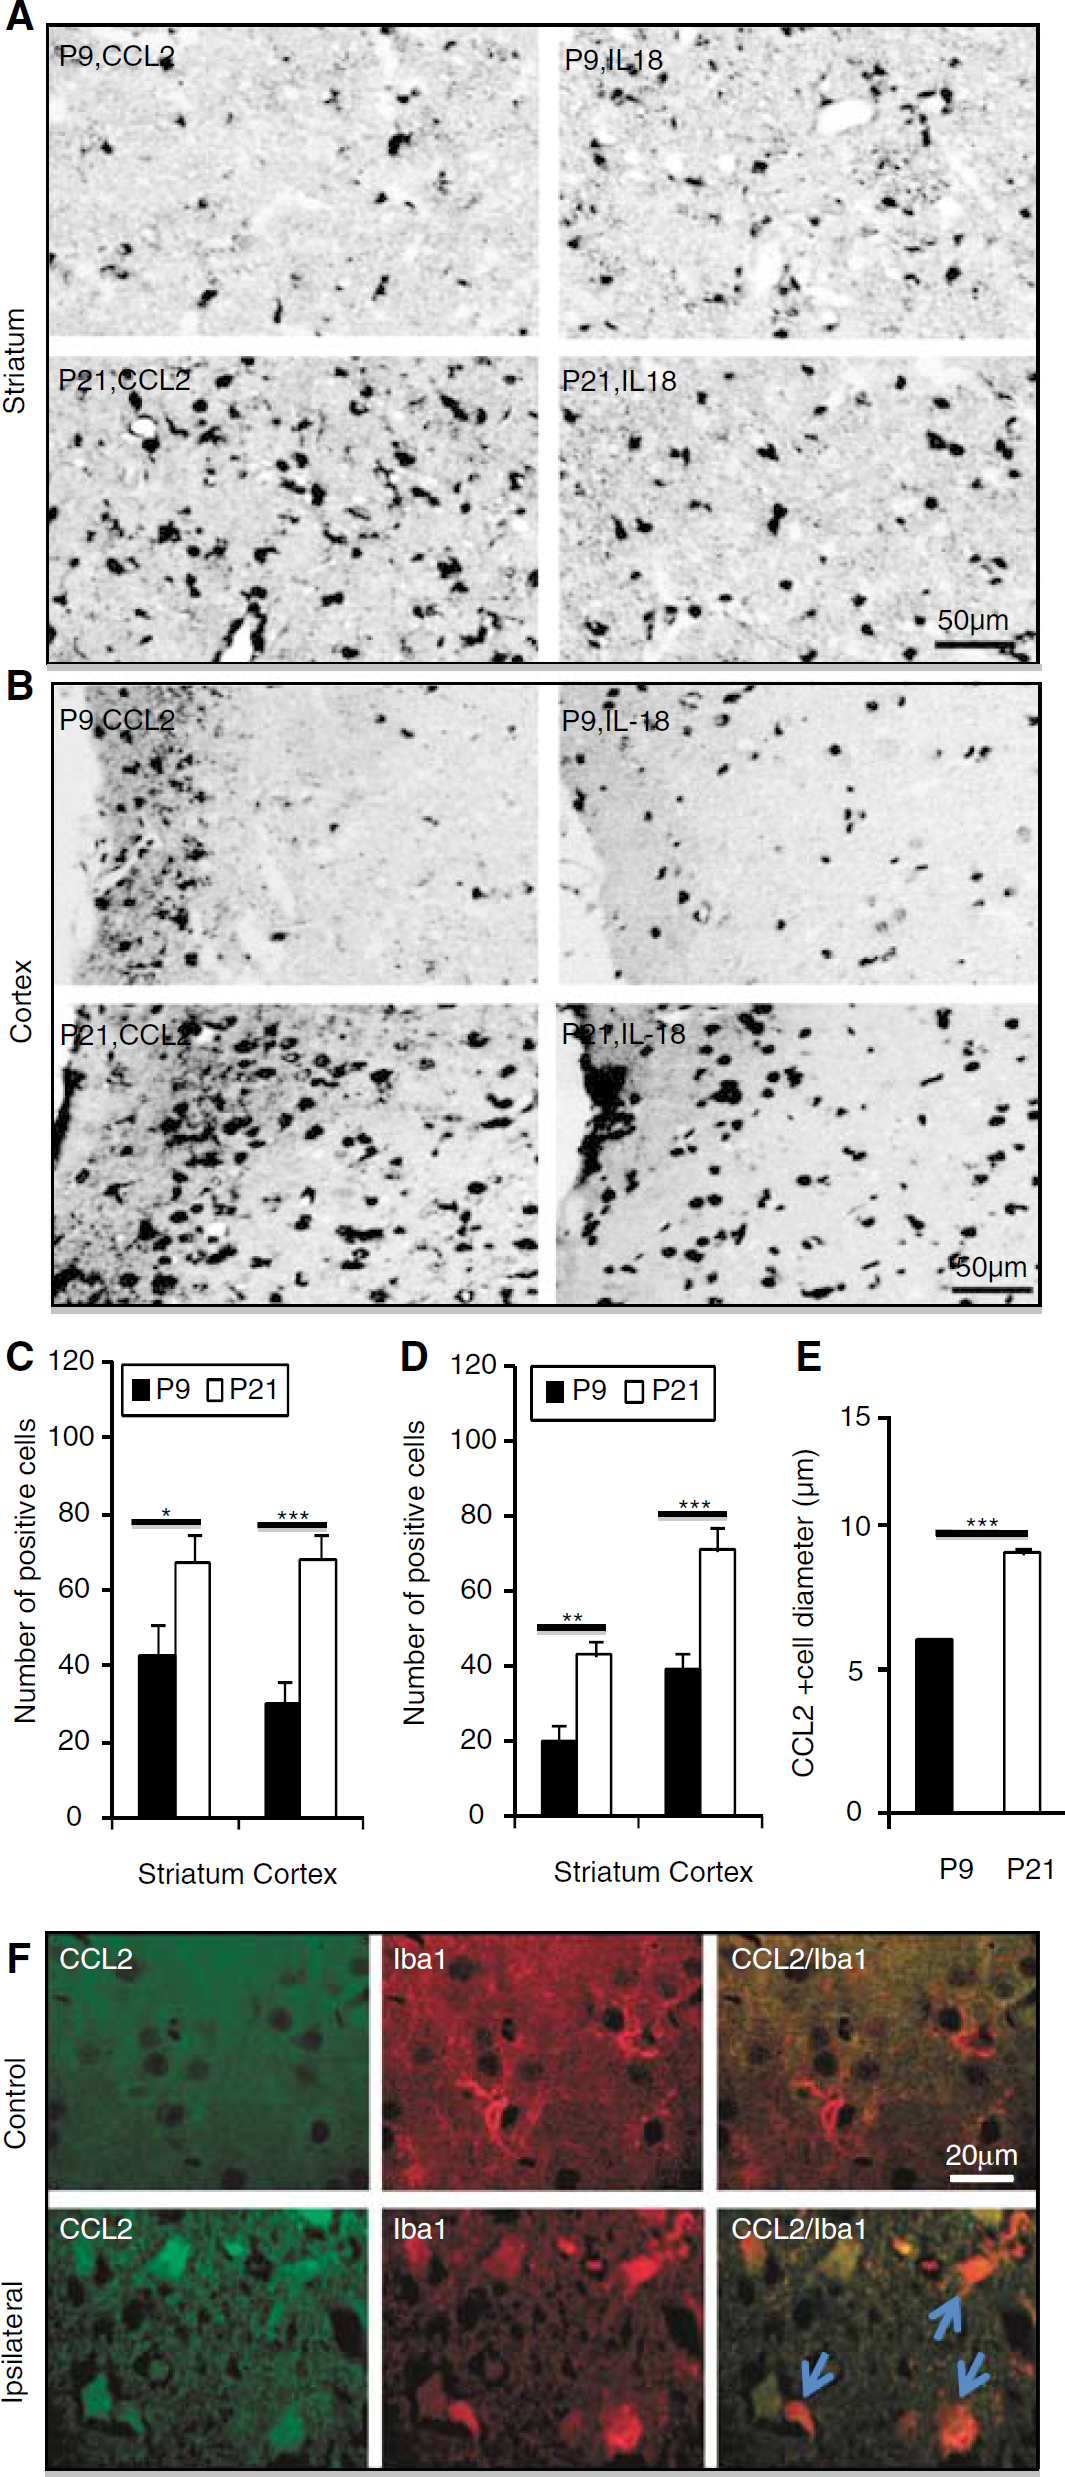
CCL2 and IL-18 staining after HI. Representative CCL2 and IL-18 immunostainings from the striatum (
Discussion
It is widely accepted that stem and progenitor cells can proliferate throughout life and that this process is regulated by physiologic and pathologic stimuli. This study shows that HI brain injury stimulated the formation of new cells, as judged by BrdU incorporation in cells surviving at least 4 weeks, in both the striatum and cortex in the immature, growing brain (at P9); but when brain growth had come to an end (at P21), proliferation could be stimulated only in the striatum, not in the cortex. Furthermore, the relative increase in formation of new cells was much higher in the P21 (460%) than in the P9 striatum (50%), although starting from a lower basal level at P21. Starting from this lower level, proliferation after HI in the P21 striatum reached the same level as in the P9 striatum, but not higher. This is analogous to the situation in the hippocampus, where proliferation did not increase significantly after HI in the immature, P9 dentate gyrus, but it increased several fold in the juvenile, P21 brains, reaching the same level as in the normal, noninjured immature brain (Qiu et al, 2007). This indicates that the immature striatum, in some respect, is already working at the top of its proliferative capacity and that even though basal cell genesis decreased with age, the injury-induced generation of new cells in the juvenile striatum could not increase beyond the basal level of the immature brain.
The total number of cells that were born during the first week after HI and survived to adulthood was much higher in the immature brain, and labeling of surviving cells occurred predominantly during the first week after HI, with much lower numbers labeled during the second and third weeks. Other studies have shown that BrdU labeling was higher in the SVZ during the second week following focal ischemia (Hayashi et al, 2005; Zhang et al, 2001) or HI in the immature brain (Hayashi et al, 2005). In these studies, however, the purpose was to estimate proliferation and labeled cells were not followed for as long as in this study (4 to 5 weeks). In our study the endpoint reflects the combined effects of proliferation, migration, differentiation, and survival, so the discrepancy could be because the newborn cells produced during early recovery after HI did not survive. Importantly, our results suggest that newborn cells in the immature brain, be it under normal or pathologic conditions, survive to a greater extent than cells born in the juvenile brain, but that the striatum of the juvenile brain constitutes an exception in this respect. Furthermore, the ratio of BrdU-labeled cells that could be phenotypically identified by one of the four markers used (NeuN, APC, S100β, or Iba1) increased significantly with age (comparing P9-1 with P21-1), and also increased significantly after hypoxia or HI (in both the P9-1 and P21-1 groups). This was most pronounced in the cortex. This indicates that the young, unchallenged brain retains a higher ratio of undifferentiated progenitors, and that normal brain development on the one hand and pathologic conditions like hypoxia and HI on the other hand, promote differentiation of progenitors.
Ischemia-induced neurogenesis in the striatum has been identified in adult stroke models (Arvidsson et al, 2002; Hou et al, 2008; Parent et al, 2002). However, in the immature striatum, there is controversy. One report showed that HI-stimulated neurogenesis in the periinfarct striatum was short-lived (Plane et al, 2004) and other studies showed that there were no newly formed striatal neurons 4 weeks after HI (Ikeda et al, 2005; Ong et al, 2005). In contrast, a recent study found persistent, increased production of striatal neurons after perinatal HI (Yang et al, 2007). In our study, we found that neurogenesis significantly increased in the ipsilateral striatum, when compared with controls and the contralateral hemisphere (Figure 3C). Lower numbers of double-positive cells were detectable also in other groups, but they were not increased by HI. These findings suggest that HI-induced neurogenesis in the immature ipsilateral striatum was restricted to the first week after HI, and that it was nonsignificant in the juvenile striatum. This might indicate that the immature striatum has a greater potential for regeneration after HI than the juvenile one. In this context it is important to mention that when double-labeled cells were systematically investigated using confocal microscopy we found many ‘satellite’ cells, that is, BrdU-positive cells that were closely apposed to NeuN-positive, BrdU-negative neurons. Kuhn et al (1997) detected a similar phenomenon the adult rat brain, where no BrdU/NeuN double-labeled cells could be found, only BrdU-positive nuclei closely associated with neurons.
There is much controversy surrounding neurogenesis in the cerebral cortex following injury. Some reports have shown a small proportion of BrdU-positive cells colabeled with neuronal markers in the penumbral area (Gu et al, 2000; Magavi et al, 2000). However, other studies did not detect any BrdU-positive cells colabeled with neuronal markers in the injured adult cortex following focal ischemia (Arvidsson et al, 2002; Parent et al, 2002). However, in the immature brain neurogenesis has been detected in the cortex (Hayashi et al, 2005; Yang et al, 2007), and in addition it was shown that HI increased the frequency of BrdU/DCX double-positive cells in the cortex (Hayashi et al, 2005). However, only 1% of BrdU-positive cells, also positive for NeuN, were detected in the cortex 14 days after HI, and no double-positive cells were detected 28 or 42 days after HI (Ikeda et al, 2005). In contrast, a recent study found a robust neurogenic response to neonatal HI where newly formed neurons emerging from the SVZ were detected 5 weeks after the insult, constituting 17% of all the labeled cells (Yang et al, 2007). In our study, much fewer cells (0.41%) were BrdU/NeuN double positive in the ipsilateral cortex after HI in the P9-1 group, even lower than in the control, nonischemic cortex, indicating that HI would actually inhibit neurogenesis. No BrdU/NeuN double-positive cells were detectable in the cortex of any of the other groups. The different findings regarding cortical neurogenesis in different studies may be attributed to different severity of the insult, different species and strains of rodents used, the timing of BrdU injections, the timing of endpoint analysis and the rigor of the search for newly generated neurons. All these parameters are likely to influence the results.
Although neurogenesis persists in the subventricular zone throughout life, the rate of neuronal production declines with age (Enwere et al, 2004). Studies have shown that the decline is largely attributable to a reduction in proliferation of neuronal precursor cells (Luo et al, 2006) mediated by an age-related alteration in the cellular microenvironment (Jin et al, 2003). This study shows that neurogenesis in the striatum and cortex was significantly higher between P10 and P16 and declined dramatically thereafter (Figure 3). The decline corresponds to the age when brain growth levels out. The mechanisms underlying this change are largely unknown, but many growth factors are expressed at higher levels in the developing brain and decrease when brain development approaches completion (Caday et al, 1990). In the striatum, the ischemia-induced new neurons observed may have been recruited from the SVZ and the rostral migratory stream, as shown for the adult brain (Arvidsson et al, 2002; Schabitz et al, 2007), whereas in the cortex, the newly formed neurons were probably derived from local progenitors, the numbers of which declined with brain maturation. This issue is complicated, though, by recent findings indicating that reactive astrocytes might serve as a source of neural stem cells (Buffo et al, 2008).
By far, the majority of the cells generated were of nonneuronal lineage. In this study, HI dramatically increased the production of oligodendrocytes, astrocytes, and microglia during the first week after HI in the immature brain. This finding is consistent with previous reports, showing that oligodendrocytes were generated after neonatal HI injury (Zaidi et al, 2004) and that microglia were rapidly recruited in response to HI (Ivacko et al, 1996). Oligodendrocyte production was increased for at least 2 weeks after HI in the immature striatum and 1 week in the cortex, but there were no significant changes in the juvenile brain. These results may correspond to myelin formation during brain development, beginning around P10 and accelerating between P16 and P30 (Fukuda et al, 2005). Pronounced HI-induced production of oligodendrocytes has been shown in the immature brain, not only in white matter areas but also in the infarct core, up to 4 weeks after the insult (Zaidi et al, 2004).
Astrocytes can both provide protection from, as well as mediate, cell death (Pekny and Nilsson, 2005). A large number of astrocytes were produced in both the striatum and cortex of the immature brain during early recovery from HI. Interestingly, in the juvenile brain the production of astrocytes dramatically increased in the striatum, but not in the cortex, after HI. This stands in contrast to the oligodendrocyte production, which was not altered in either region. The reasons for these differences between cell lineages on the one hand and between the striatum and cortex on the other hand, are not yet understood. In response to an insult, astrocytes become reactive and may proliferate (Pekny and Nilsson, 2005). Although significant astrogliosis was found in the ipsilateral cortex and striatum after HI, it can not be determined from the data at hand how many were derived from stem/progenitor cells or from direct proliferation and invasion. In addition, it has been suggested that reactive astrocytes themselves may constitute a source of stem/progenitor cells (Berninger et al, 2007).
Neural stem cells have not been shown to differentiate into microglia, so the newly formed microglia observed are either the result of local microglia proliferation or recruitment of monocytic leukocytes from the blood stream. Microglia are rapidly activated after brain injury (Tonchev et al, 2005). The basal level of microglia proliferation is high in the immature brain, as microglia populate the brain during normal brain development (Dalmau et al, 2003). This rate of microglia proliferation was increased further during the first week after HI (group P9-1), especially in the infarct area of the striatum, as measured by BrdU/Iba1 double labeling (Figure 4). The juvenile brains displayed a different pattern, with much lower basal levels of microglia proliferation and a dramatic increase in the striatum (49-fold) and a moderate increase in the cortex (2.5-fold) after HI. The HI-induced production of microglia in the striatum of the juvenile brains was the greatest change observed in this study. Microglia constitute a major cellular source of proinflammatory cytokines and other potentially neurotoxic soluble products. Inhibition of microglia activation might enhance neurogenesis and improve function after cerebral ischemia (Liu et al, 2007). However, microglia are also thought to have an instructive role in brain restoration, contributing to the maintenance of neurogenesis (Aarum et al, 2003). Specific inflammatory mediators have been shown to play pivotal regulatory roles in neurogenic and other regenerative responses (Yan et al, 2007). CCL2 (also called Monocyte Chemoattractant Protein-1, MCP-1) and IL-18 are important inflammatory mediators and appear to be important also for the development of HI brain injury (Hedtjarn et al, 2002). Furthermore, CCL2 was shown to regulate the migration of neural progenitors to sites of neuroinflammation (Belmadani et al, 2006) and was shown to be the most strongly upregulated marker of inflammation after irradiation of the immature brain (Kalm et al, 2008). The increased expression of these two proinflammatory markers 72 h after HI, more pronounced in the juvenile brains, is consistent with the massive microglial proliferation occurring during the first week after HI in P21 mice. This indicates that the postischemic inflammation is more pronounced in the juvenile than in the immature brain, as shown also earlier for the hippocampus (Qiu et al, 2007). Other studies have shown that inflammation may impair neurogenesis and that antiinflammatory strategies can restore it (Hoehn et al, 2005; Monje et al, 2003). The inflammatory expression profile of the immature brain, however, appears to be very different from the adult brain (Kalm et al, 2008; Monje et al, 2003) supporting our present finding that the microglia response in the juvenile brain is much stronger and is accompanied by higher levels of proinflammatory cytokines. Further studies are needed to reconcile these apparently contradictive studies on the roles of inflammation and regenerative responses.
In summary, this study shows that HI induced an early transient increase in neurogenesis and gliogenesis in the ipsilateral hemisphere that was region and age dependent (Figure 6). The profound differences observed between the immature and the juvenile brain on the one hand, and the striatum and the cortex on the other, can help us understand how mechanisms of degeneration and regeneration are regulated in the brain. This needs to be taken into consideration when designing neuroprotective and regenerative strategies after brain injury in the immature vs. the mature brain setting.
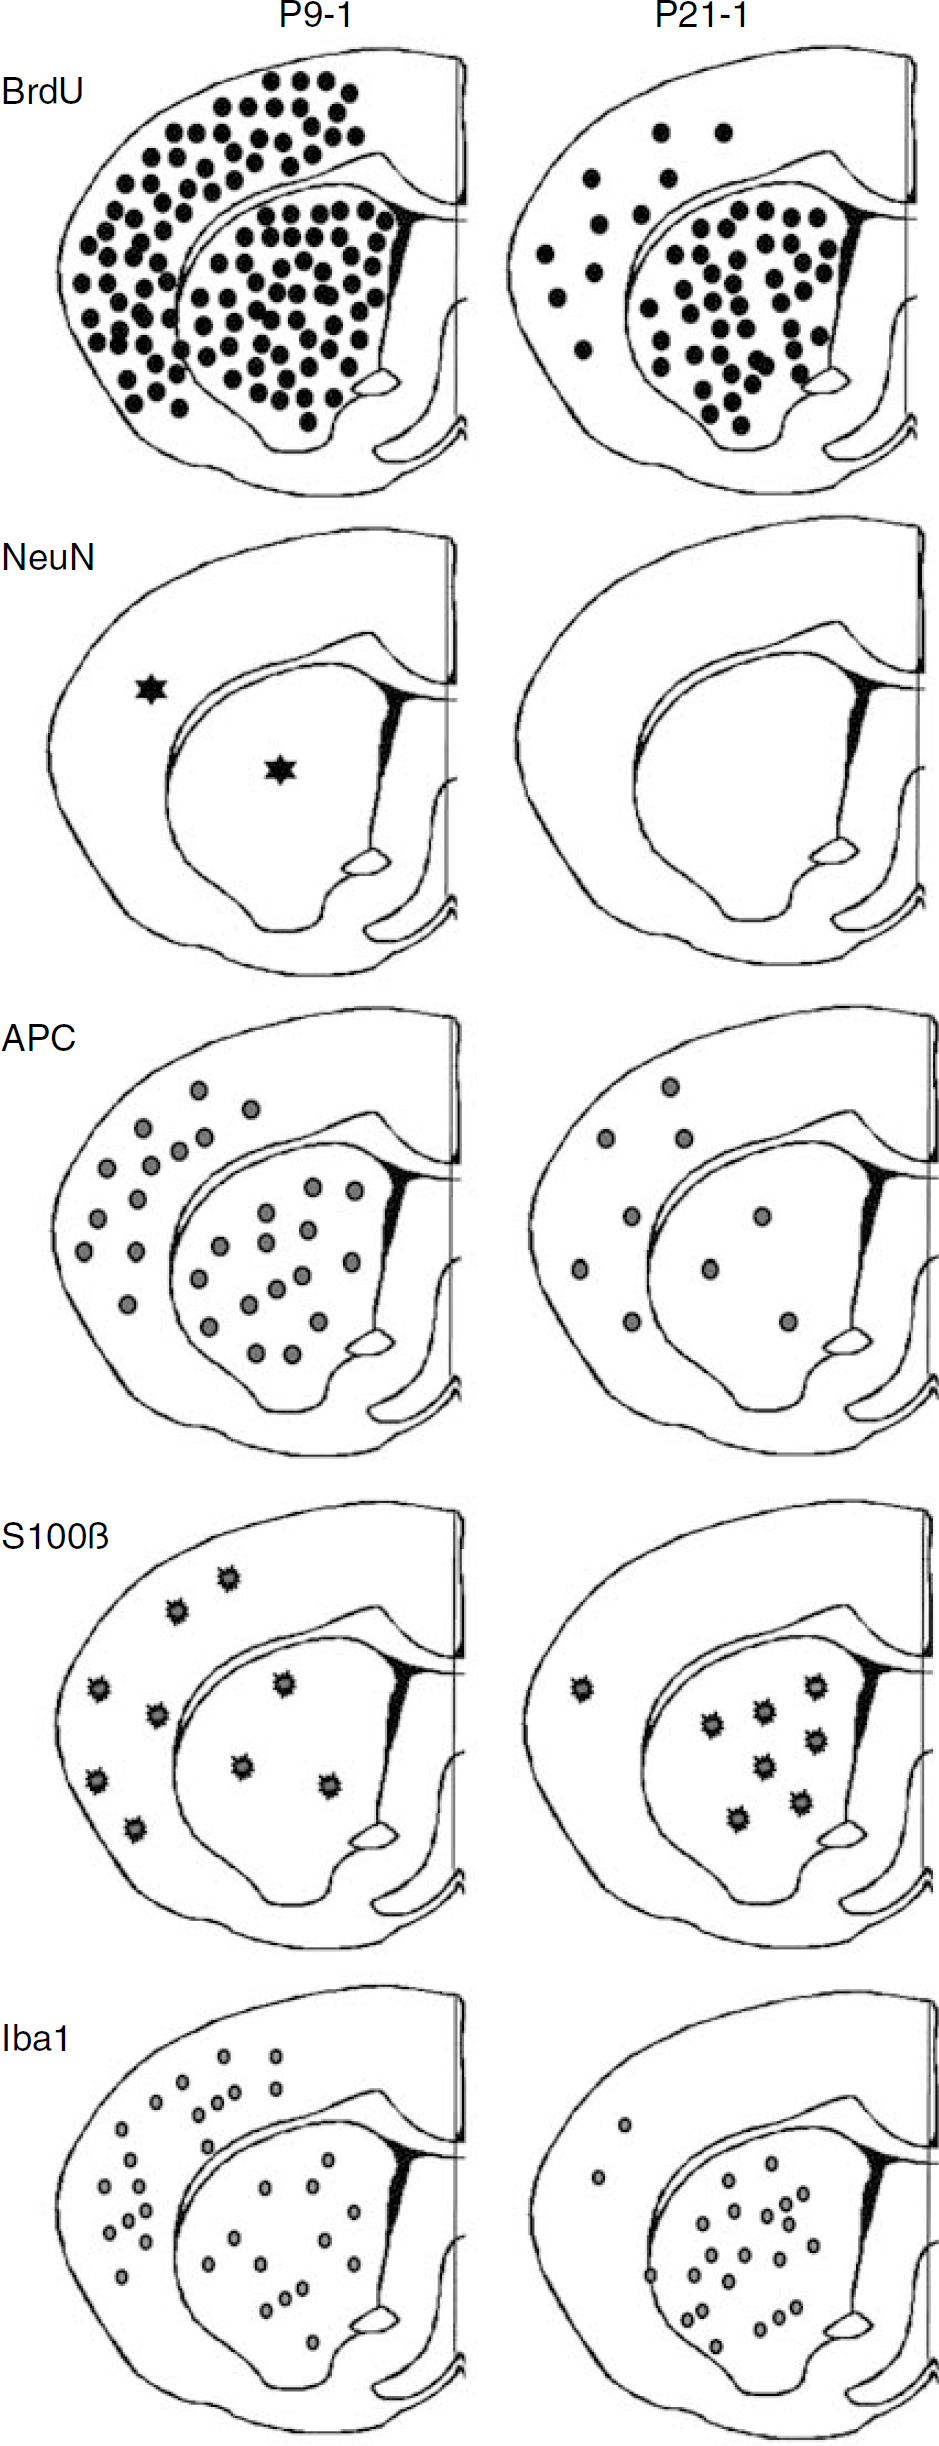
Schematic localization and density of newly formed cells after HI. The approximate localization and density of newly formed cells after the insult, as judged by the number of BrdU-labeled cells remaining 5 weeks after HI (top panel) are shown for the cortex and striatum of the P9-1 (left column) and P21-1 (right column) groups. The approximate localization and density of neurons (NeuN), oligodendrocytes (APC), astrocytes (S100β), and microglia (Iba1) are shown with different symbols underneath.
Footnotes
Acknowledgements
This work was supported by the Swedish Research Council, the Swedish Childhood Cancer Foundation (Barncancerfonden), Swedish governmental grants to scientists working in health care (ALF), Torsten and Ragnar Söderbergs stiftelse, the National Natural Science Foundation of China (to CZ; 30470598), Ministry of Education of China (211 project), the King Gustav V Jubilee Clinic Research Foundation (JK-fonden), the Wilhelm and Martina Lundgren Foundation, the Frimurare Barnhus Foundation, the Gothenburg Medical Society, the Swedish Society of Medicine, the Swedish Research Links Program through the Swedish International Development Cooperation Agency (SIDA).
Disclosure/conflict of interest
None.