
Abstract
Continuous stimulation of the globus pallidus (GP) has been shown to be an effective treatment for Parkinson's disease (PD). We used the fact that the implanted quadripolar leads contain electrodes within the GPi and GPe to investigate the clinical effects of acute high-frequency stimulation applied in these nuclei and changes in regional cerebral blood flow (rCBF) as an index of synaptic activity. In five patients treated by chronic GP stimulation, we compared the effects on PD symptoms and the changes in rCBF at rest and during paced right-hand movements, with and without left GPe or GPi stimulation. Although improving contralateral rigidity and akinesia, left GPe stimulation decreased rCBF in the left cerebellum and lateral premotor cortex at rest and significantly increased it in the left primary sensorimotor cortex (SM1) during movement. In contrast, left ventral GPi stimulation, which improved rigidity and worsened akinesia, decreased rCBF in the left SM1, premotor area, anterior cingulum, and supplementary motor area but did not modify the movement-related activation. GPe stimulation seems to result in a reduced activity of motor-related areas and the facilitation of motor cortex activation during movement, the latter component being absent during GPi stimulation, and this may explain the observed worsening of akinesia.
Keywords
Introduction
Deep brain stimulation (DBS) applied to either the subthalamic nucleus (STN) (Limousin et al, 1998; DBS for PD study group, 2001) or the globus pallidus (GP) (Pahwa et al, 1997; DBS for PD study group, 2001; Volkmann et al, 2004) is an effective treatment for severe forms of Parkinson's disease (PD). Although the mechanisms of stimulation are not well known, this treatment appears to correct the effects of the abnormal neuronal activity that occurs in these two nuclei in PD (DeLong, 1990; Benazzouz and Hallett, 2000; Garcia et al, 2005). The effects of STN stimulation appear to be different from those of GP stimulation, however. STN stimulation reduces all the cardinal motor signs of PD. The effectiveness of this treatment usually results in a marked reduction in the need for antiparkinsonian drug treatment, thereby leading to a reduction in drug-induced motor side effects such as dyskinesia (Limousin et al, 1998). In contrast, GP stimulation, although highly effective in reducing drug-induced dyskinesia, has only moderate effects on PD motor signs (Krack et al, 1998a; DBS for PD study group, 2001; Krause et al, 2001; Durif et al, 2002; Volkmann et al, 2004; Anderson et al, 2005). Consequently, pallidal stimulation does not normally lead to a marked reduction in the dosage of antiparkinsonian drug treatment. Despite these differences in effects, stimulation of either the STN or GP improves features of PD and both targets could be considered for DBS in patients with advanced PD (Anderson et al, 2005).
Our group (Bejjani et al, 1997) and others (Krack et al, 1998b) have provided a possible explanation for the observed differences in the effects of stimulation in these two nuclei. Using the fact that the implanted quadripolar leads cover the entire ventrodorsal extent of the GP and contain electrodes within both its internal part (GPi) and external part (GPe), we compared the effects of acute stimulation (lasting a few minutes) applied within the different parts of the GP. Stimulation applied through electrodes localized within the GPe improved all the cardinal PD signs but could induce abnormal involuntary movements when high voltages were applied, even in patients after withdrawal of dopaminergic treatment; stimulation applied through electrodes localized within the ventral GPi improved rigidity but, in addition to reducing levodopa-induced abnormal involuntary movements, could worsen akinesia and gait when high voltages were applied.
Positron emission tomography (PET) activation studies assess changes in regional cerebral blood flow (rCBF), an index of local synaptic activity, during voluntary movements (Grafton and DeLong, 1997). To clarify the respective effects of GPe and GPi stimulation previously observed in five PD patients in the first months after surgery (Bejjani et al, 1997; Yelnik et al, 2000), we reassessed these patients clinically and compared the effects on rCBF of acute high-frequency stimulation applied to these two nuclei while the patients were at rest and while they were performing a paced hand movement.
Materials and methods
Subjects and Surgical Procedure
The study included five consecutive patients treated by continuous bilateral GP stimulation for a severe form of PD (Table 1). All of them fulfilled the classical criteria for DBS treatment (DBS for PD study group, 2001). Because of severe levodopa-induced dyskinesia (a score of ≢2 on items 32 and 33 of the Unified Parkinson's Disease Rating Scale (UPDRS) (Fahn and Elton, 1987), part IVA), the GP rather than the STN was chosen as a target for DBS. Leads (3387; Medtronic, Minneapolis, MN, USA) were implanted in the GP under sterotaxic magnetic resonance (MR) guidance and with intraoperative neuronal microrecordings and clinical assessment, in accordance with our protocol (Bejjani et al, 1997). The leads comprised four electrodes (numbered from 0 to 3, 0 being the lowest and 3 the uppermost) through any of which stimulation could be delivered. Because the extent (10.5 mm) covered by the four electrodes and the obliquity of the trajectories, and according to stereotaxic guidance and the microelectrode recordings, the leads were positioned so that the lowest electrode was localized in the ventral GPi and the uppermost electrode in the GPe. The anatomical localization of the electrodes was determined by superimposing contours from a digitized version of Schaltenbrand and Wahren's anatomical atlas on the postoperative MR imaging (MRI) obtained in each patient (Figure 1) (Yelnik et al, 2000). At the time of the study (26 to 35 months after lead implantation), all patients showed a significant improvement in comparison to their preoperative state (Table 1). The study protocol was approved by the Ethics Committee of the Pitié-Salpêtrière Hospital and all patients gave informed written consent.
Therapeutic effects of pallidal stimulation at the time of the study and electrodes used for the study
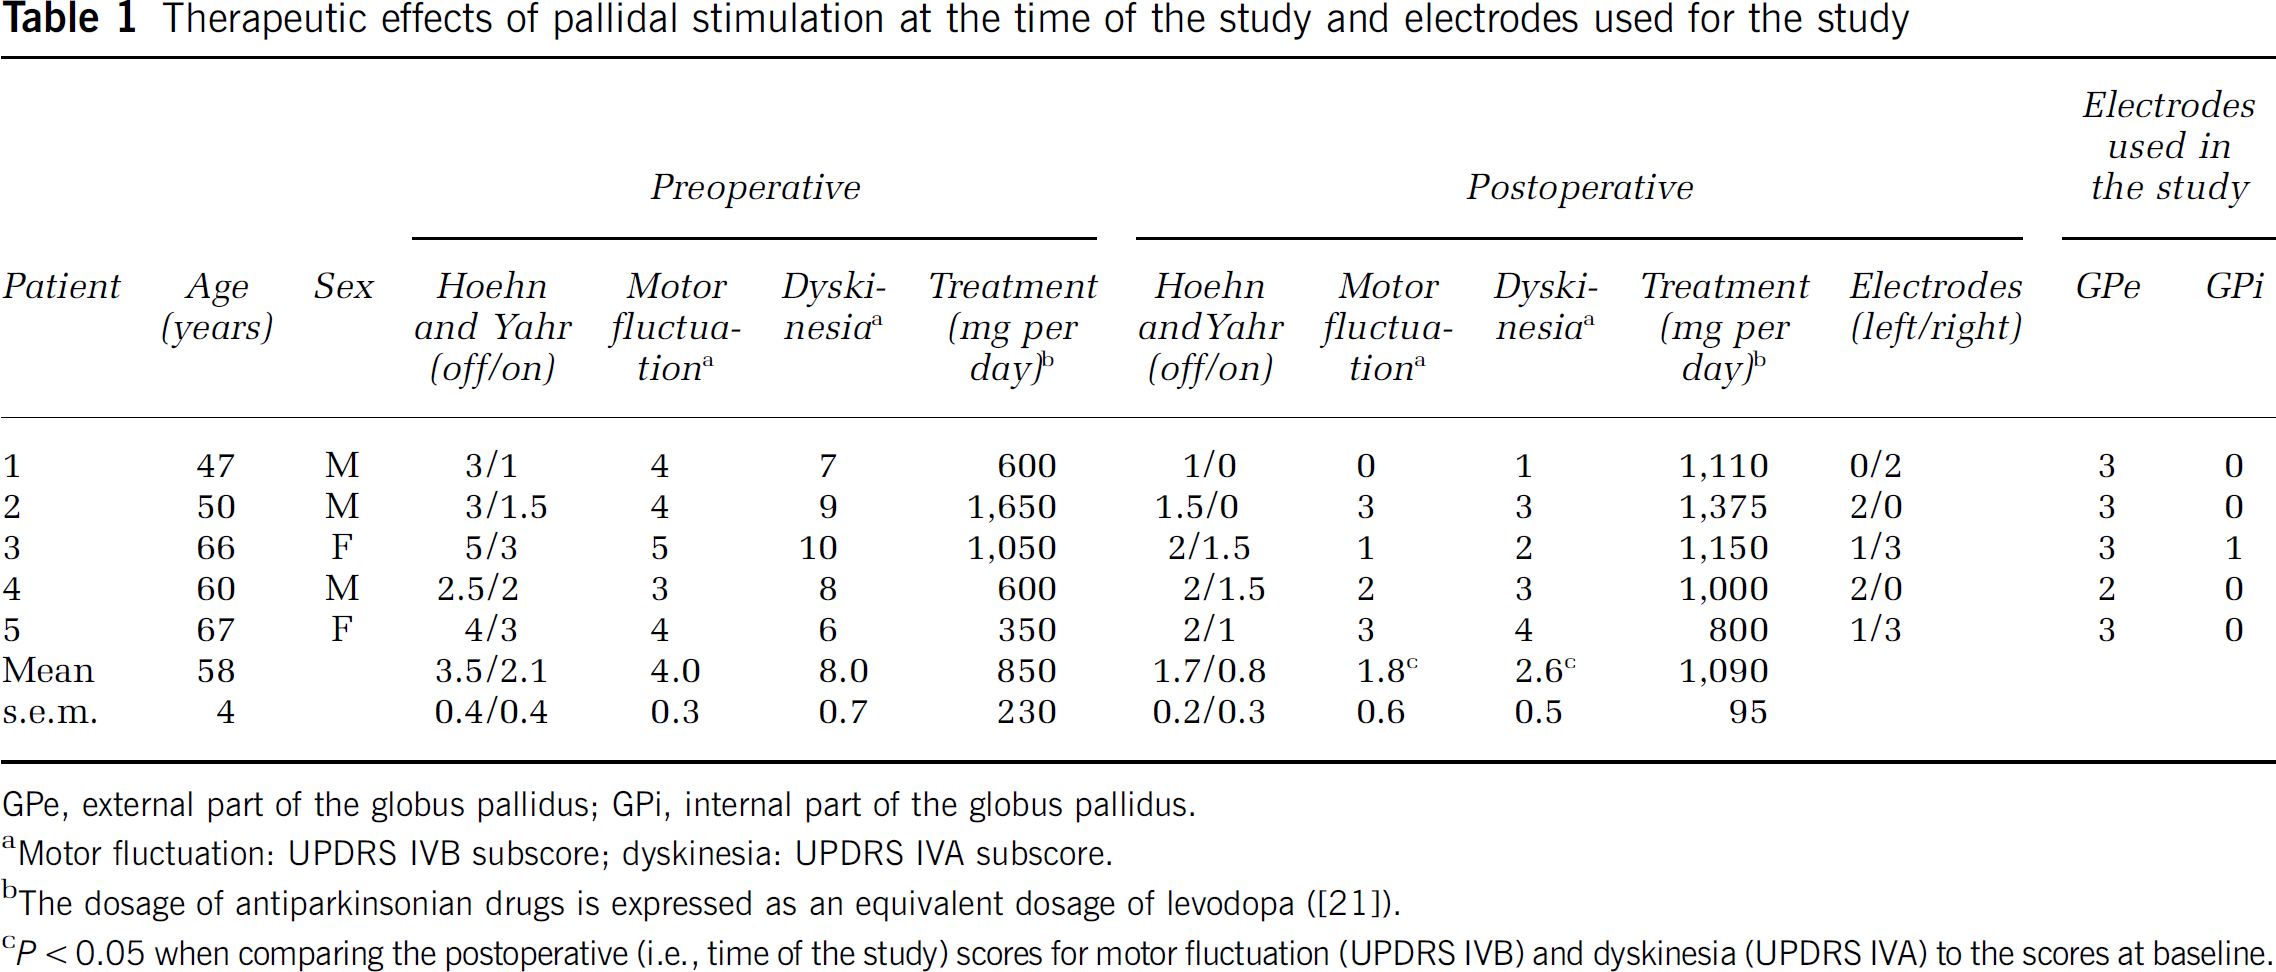
GPe, external part of the globus pallidus; GPi, internal part of the globus pallidus.
Motor fluctuation: UPDRS IVB subscore; dyskinesia: UPDRS IVA subscore.
The dosage of antiparkinsonian drugs is expressed as an equivalent dosage of levodopa ([21]).
P<0.05 when comparing the postoperative (i.e., time of the study) scores for motor fluctuation (UPDRS IVB) and dyskinesia (UPDRS IVA) to the scores at baseline.
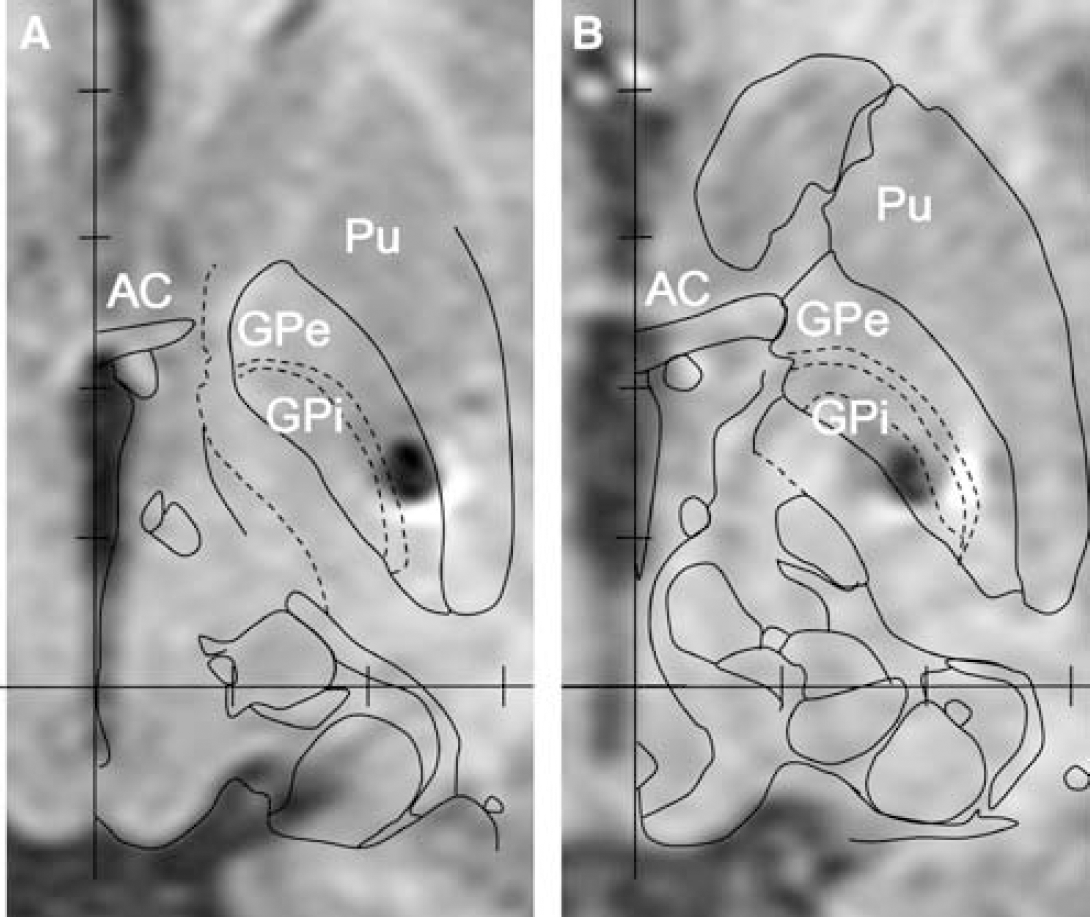
Anatomical localization of the stimulating electrodes within the GPe (
Clinical Assessment
The clinical assessment was performed the day before the PET study. The UPDRS motor score was measured in each patient, after antiparkinsonian drugs had been withdrawn for at least 12 h and both stimulators had been turned off for 2 h, in three stimulation conditions: unilateral left GPe stimulation, unilateral left GPi stimulation, and without stimulation (‘off’ stimulation condition). When more than one electrode was located in the GPe or in the GPi, the electrode through which stimulation was known from the postoperative assessment (Yelnik et al, 2000) to have the strongest effect in increasing akinesia (GPi stimulation; usually in the ventral part of the nucleus) or in decreasing akinesia (GPe stimulation) was chosen. The stimulation was monopolar with a 130-Hz rate and a 60-µs pulse width. The voltage varied from patient to patient and was determined the day before the assessment. It was chosen, from the postoperative assessment of the effects of stimulation (Yelnik et al, 2000), as the minimum voltage (up to 5V) leading to the most pronounced worsening of akinesia whereas applied in the GPi without inducing dyskinesia when applied in the GPe (if this was the case, the highest voltage that did not induce dyskinesia was chosen). The voltages thus defined varied from 2.4 to 4.5V from one patient to another. To ensure that the effects observed were not because of a spread of stimulation to the internal capsule, we verified that a voltage of 5V applied to each of the selected electrodes did not induce a contralateral limb or face contraction (no electromyography was performed, thus a small degree of activation of the corticospinal tract cannot be entirely ruled out). Each stimulation condition (i.e., ‘off’, GPi stimulation, GPe stimulation) was applied for 8 mins before the clinical assessment was performed; the stimulation condition was changed as soon as the motor evaluation was performed and each condition was applied twice. The order of conditions was counterbalanced across patients. Assessments were performed with the patient and the physician (MM) masked to the stimulation condition. There were no statistical differences between scores obtained with the duplicated stimulation condition; the mean of the two scores was used for the calculation. From the motor score on the UPDRS, two subscores were calculated: right-side akinesia (items 23 to 26, maximal score = 16) and right-side rigidity (item 22, right upper and lower limb, maximal score = 8). The akinesia and rigidity scores measured in each condition were compared using the Wilcoxon signed-rank test.
PET Activation Study
After a 12-h withdrawal of all antiparkinsonian drugs, PET scans were performed in the same conditions of stimulation as those used the day before for the clinical evaluation. The right pallidal electrode was turned off and only the left GP stimulator was tested. The study was performed according to a 2×3 factorial design with the three stimulation conditions and two motor conditions. The three stimulation conditions were the same as those used for the clinical evaluation: ‘off’ stimulation, GPi stimulation, and GPe stimulation. Each stimulation condition was applied as soon as the previous image acquisition was finished so as to obtain an optimal stimulation period (at least 8 mins) before the following acquisition. The two motor conditions were: at rest (no movement, arm lying supine on the bed) and a right-hand movement, consisting of alternately opening and clenching the fist, which was paced by an auditory stimulus at a frequency of 0.5 Hz. The patient was trained the day before and in the hour preceding the PET scan so as to ensure that this simple movement would be correctly performed and to avoid a learning effect. The patient's performance was checked using video recording during the PET examination. The movement started 80 secs before image acquisition. Rest and movement were studied in each stimulation condition (‘off’, GPi stimulation, and GPe stimulation), and each condition was replicated, making a total of 12 scans per patient. The order of conditions was randomly assigned to each subject. The patient and PET examiners were masked to the stimulation condition.
A venous cannula was inserted to administer tracer in a left antecubital fossa vein in the arm contralateral to the hand movement. PET measurements were performed with an EXACT HR+ tomograph (CTI/Siemens, Knoxville, TN, USA) allowing the simultaneous three-dimensional acquisition of 63 transaxial slices. Spatial resolution after reconstruction was 4.5 in the transaxial direction and 4.1 mm and axial direction (Brix et al, 1997; Strul and Bendriem, 1999). To measure rCBF, 300MBq of H2 15O were administered for each 80-secs emission scan. To allow complete decay of injected tracer activity, image acquisitions were performed 10 mins apart.
Image analysis was performed on a SPARC station (Sun Microsystems, Palo Alto, CA, USA) using the ‘statistical parametric mapping’ (SPM) package (SPM99, Wellcome Department of Cognitive Neurology, London, UK) (Friston et al, 1995). Images of each subject were realigned to the first volume and normalized to the stereotaxic space of Talairach and Tournoux (1988). The images were coregistered on a template and spatially smoothed with a Gaussian kernel of 12 mm full width at half maximum to take into account variations in gyral anatomy and individual variability in structure—function relationships, and to improve the signal-to-noise ratio.
The five subjects were included in the same statistical analysis on a voxel-by-voxel basis. SPM was then generated using an analysis of covariance (ANCOVA) model implemented through the general linear model formulation (Friston et al, 1995) after normalization for global effect by proportional scaling. Briefly, the ANCOVA vectorial model allows the analysis of two orthogonal effects and the interaction between them, as previously described (Limousin et al, 1997; Payoux et al, 2004). (1) The ‘movement effect’ consists of comparing the images obtained during hand movements with those acquired at rest, regardless of the electrode condition, and corresponds to the following computation: ((NoS M+) + (SGPe M+) + (SGPi M+))–((NoS M–) + (SGPe M–) + (SGPi M–)), NoS being the ‘off’ stimulation condition, SGPe the GPe stimulation condition, SGPi the GPi stimulation condition, M+ the movement condition, and M– the rest condition, with a statistical threshold of P < 0.001 for peak height, corrected to P < 0.05 for multiple comparisons and spatial extent (bidirectional degrees of freedom: 4 and 58). The regions significantly activated by right-hand movements were then used as a mask for all the following statistical analyses. (2) The ‘GP stimulation effect’ compares conditions when the electrode located in the left GPe is turned ‘on’ with the conditions without pallidal stimulation, regardless of the movement condition, and corresponds to ((SGPe M–) + (SGPe M+) versus (NoS M–) + (NoS M+)), where versus indicates a two-tailed comparison. The same analysis was performed for the GPi stimulation ((SGPi M–) + (SGPi M+) versus (NoS M–) + (NoS M+)). (3) The ‘interaction between stimulation and movement’ reveals the pattern of activation specifically induced by the movement in each electrode condition, and corresponds to ((SGPe M+)–(SGPe M–))–((NoS M+)–(NoS M–)) and ((SGPi M+)–(SGPi M–))–((NoS M+)–(NoS M–)). In view of the multiple comparisons, the significance level was set at P < 0.01 (small volume corrected). In the absence of significance, the level was decreased to P < 0.05 (small volume corrected) in an exploratory approach.
Results
Clinical Effects of Stimulation
The postoperative MRI confirmed the position of the lead, with at least one electrode in the GPe and one electrode in the GPi (Figure 1).
Stimulation applied within the left GPe improved contralateral rigidity by 83% (P < 0.01) (UPDRS ‘rigidity score’ decreased from 4.6 ± 1.2 in the condition without stimulation to 0.8 ± 0.4 after 8 mins of GPe stimulation) and akinesia by 39% (P < 0.01) (UPDRS ‘akinesia score’ decreased from 6.6 ± 1.6 to 4.0 ± 1.4) in comparison to the condition with no stimulation. Stimulation applied within the left GPi improved contralateral rigidity by 65% (P < 0.01) (UPDRS ‘rigidity score’ decreased from 4.6 ± 1.2 to 1.6 ± 0.7 after 8 mins of GPi stimulation) but worsened contralateral akinesia by 55% (P < 0.01) (UPDRS ‘akinesia score’ increased from 6.6 ± 1.6 to 10.2 ± 1.0).
Effect of Movement on rCBF
Regardless of the stimulation condition, the right-hand movement significantly activated (P < 0.001, corrected for multiple comparisons) a large set of motor areas, including the primary sensorimotor cortex (SM1) the putamen and the inferior parietal cortex in the left hemisphere, the inferior frontal cortex in the right hemisphere, the insula, the cerebellum, and the premotor cortex (PMC) bilaterally, and the anterior cingulate cortex and supplementary motor area (SMA) on the midline (Table 2).
Regions significantly activated by right-hand movements whatever the stimulation condition
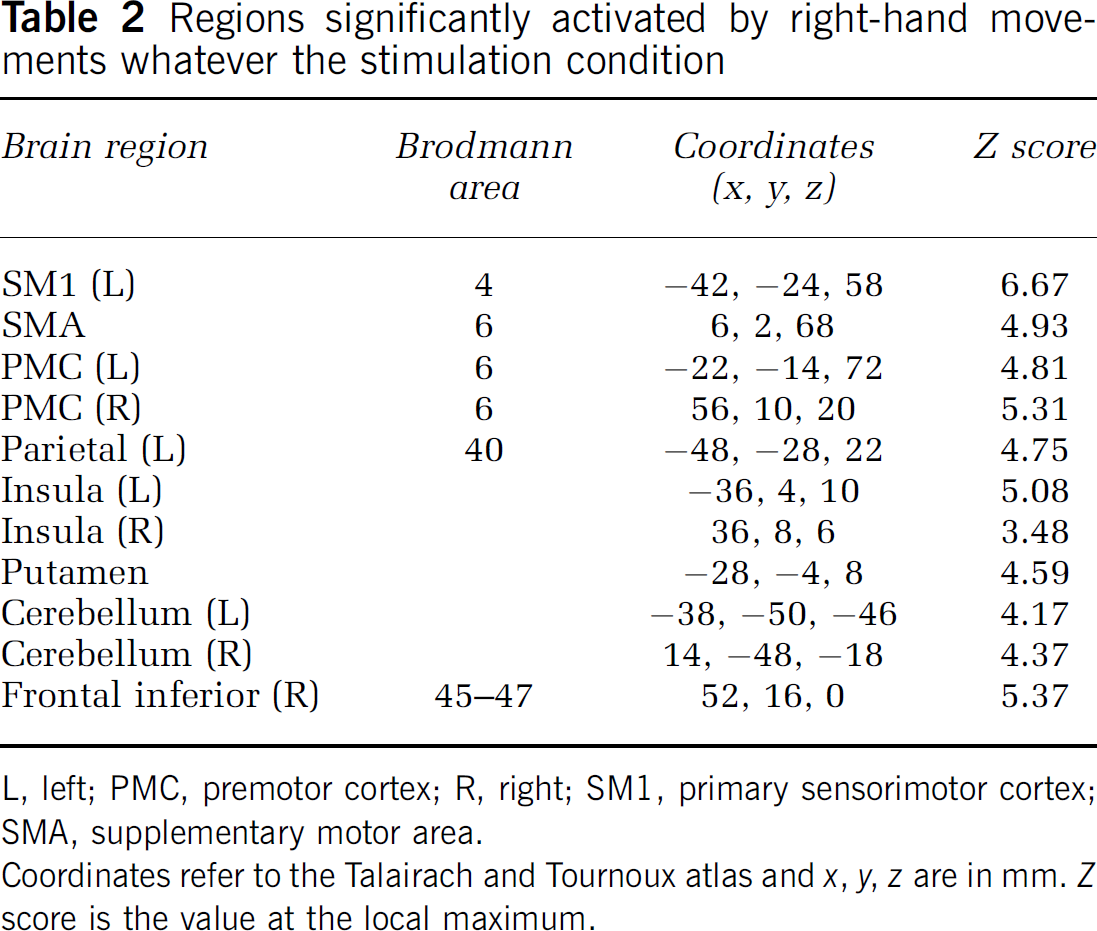
L, left; PMC, premotor cortex; R, right; SM1, primary sensorimotor cortex; SMA, supplementary motor area.
Coordinates refer to the Talairach and Tournoux atlas and x, y, z are in mm. Z score is the value at the local maximum.
Effect of Stimulation Applied to The External Globus Pallidus on rCBF
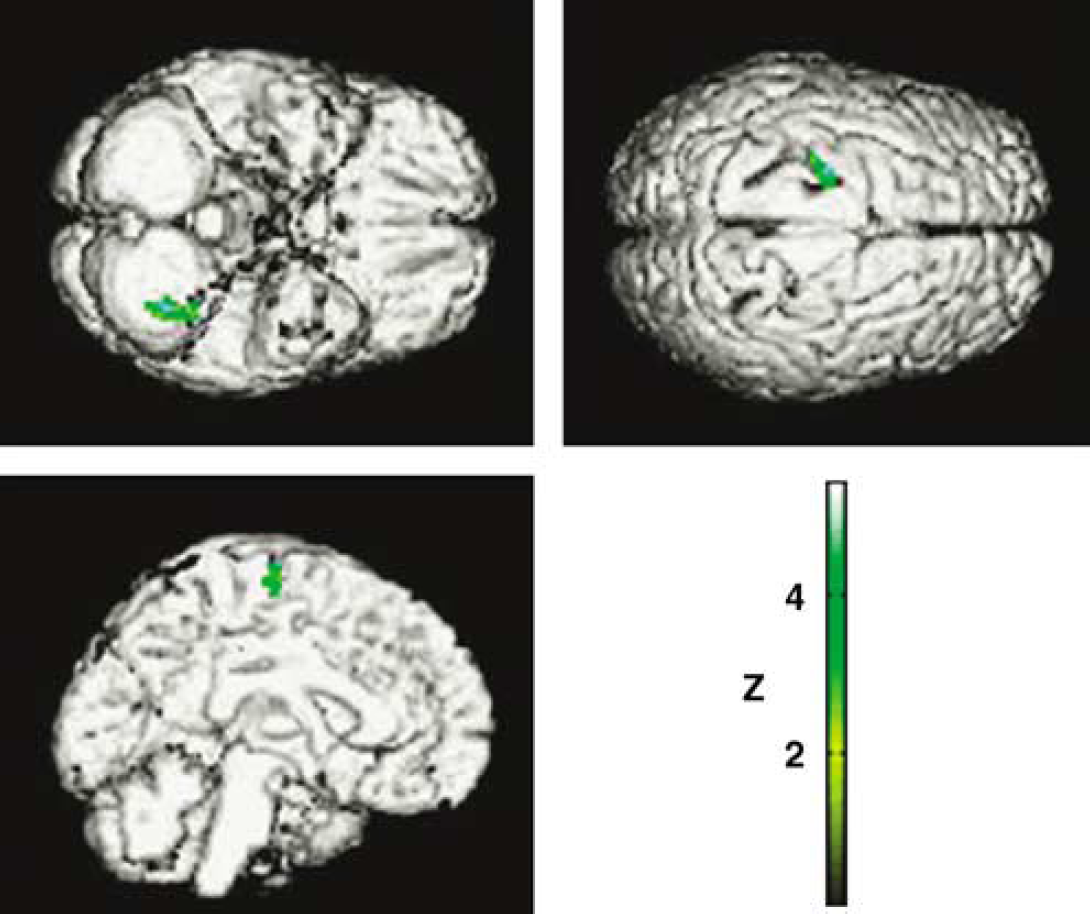
The main effect of stimulation applied within the left GPe, whatever the movement condition, was to significantly decrease the rCBF in the left cerebellum (Z = 4.04) and left PMC (Z = 3.11) (Figure 2). At a P-value < 0.05 (small volume corrected), the interaction between the motor and GPe conditions revealed that GPe stimulation increased left SM1 activation during the right-hand movement (Z = 2.84) (Figure 3).
SPM99 rendering on a standardized brain showing the decrease in rCBF in the left premotor cortex and cerebellum induced by stimulation applied to the left GPe. (The regions significantly activated by the right-hand movement were used as a mask for all subsequent image comparisons.)
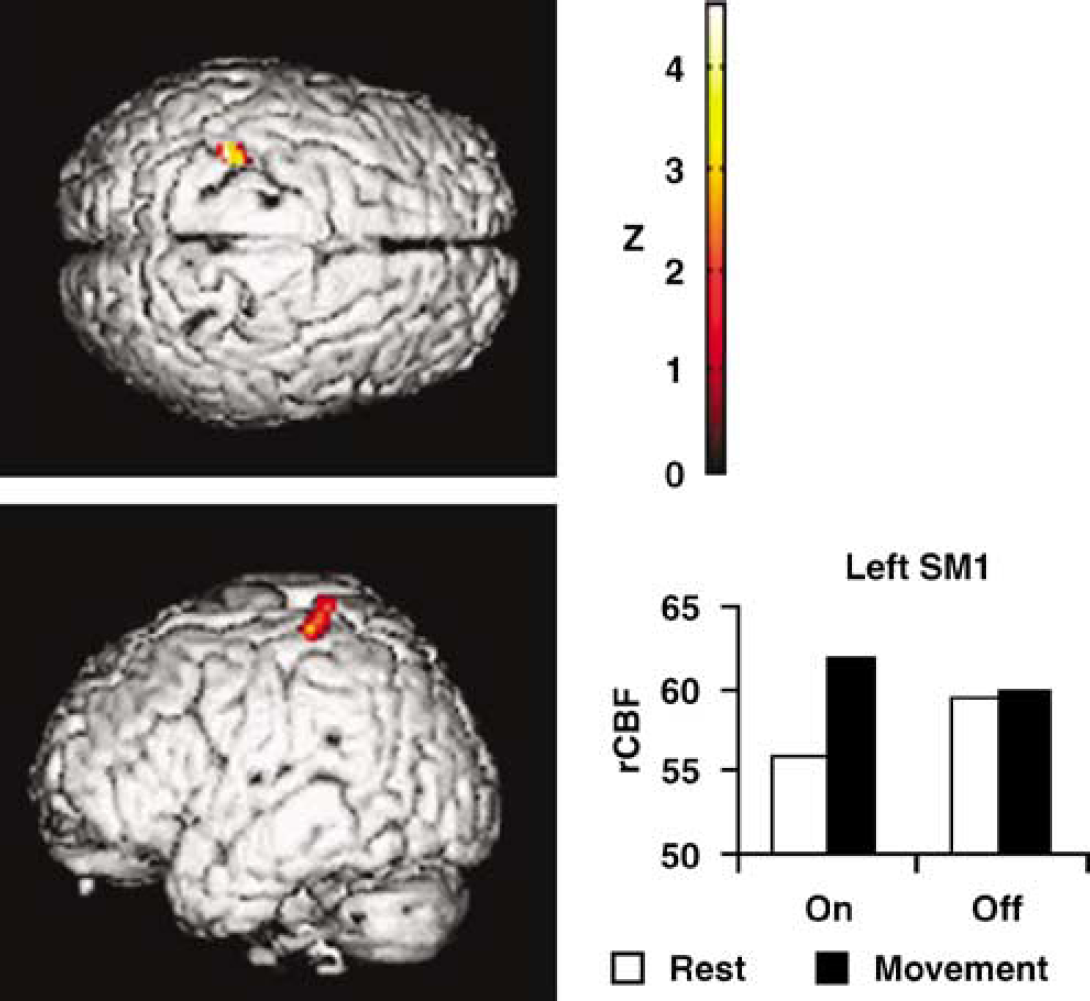
Left: SPM99 rendering of the increase in rCBF induced by right-hand movement during stimulation of the left GPe (P<0.05, small volume corrected). Right: plot of rCBF at the local maximum in the left SM1, showing that the activation evidenced by the interaction analysis was related to both a decreased rCBF at rest and an increased activation during movement in this region when stimulation was applied to the GPe. (The regions significantly activated by the right-hand movement were used as a mask for all subsequent image comparisons.)
Effect of Stimulation Applied to the Internal Globus Pallidus on rCBF
The main effects of stimulation applied within the left GPi were to decrease the rCBF in several cerebral regions, including the left SM1 (Z = 4.11) and PMC (Z = 3.81), the posterior SMA (Z = 3.66), the anterior SMA (Z = 3.56), and the anterior cingulate cortex (Z = 3.24) (Figure 4), and to increase the rCBF in the left putamen (Z = 4.14). The interaction between the motor and GPi conditions revealed that GPi stimulation did not significantly alter the pattern of movement-related activations.
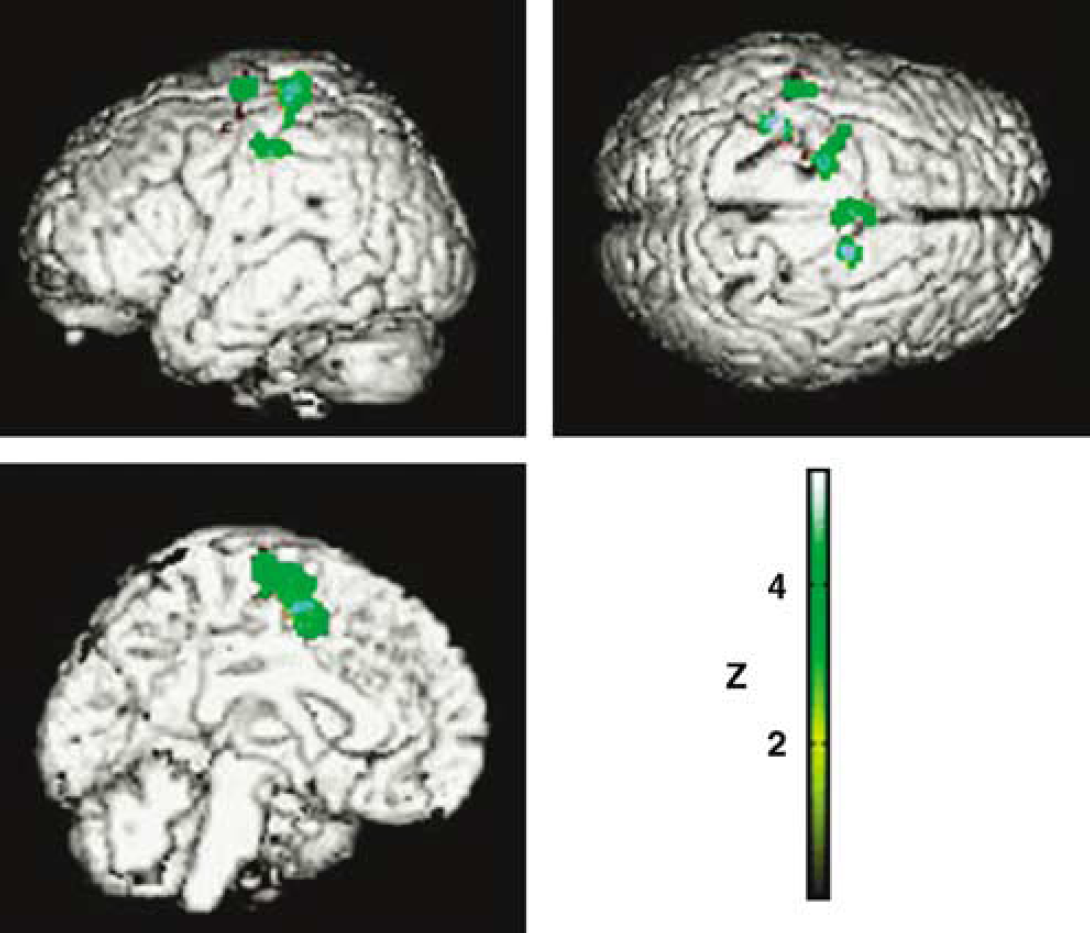
SPM99 rendering on a standardized brain showing the decrease in rCBF in the left SM1 and PMC, the SMA, and the anterior cingulate cortex induced by stimulation applied to the left GPi. (The regions significantly activated by the right-hand movement were used as a mask for all subsequent image comparisons.)
Discussion
The aim of our study was to try to determine why high-frequency stimulation applied to the different parts of the GP has different effects on PD symptoms (Bejjani et al, 1997; Krack et al, 1998b). For a pathophysiological study of this kind, the stimulation parameters (i.e., electrode, electrical parameters) were not those used for chronic pallidal stimulation in our patients but were chosen to assess with the greatest possible contrast the effects of stimulation applied within the GPe and GPi in comparison to the ‘off’ stimulation condition in patients deprived of dopaminergic medication (Table 1). For each patient, we applied through these electrodes the highest possible voltage (i.e., that did not induce abnormal movements when applied to the GPe), and without exceeding 5V, so as to avoid the current spreading to adjacent structures. The choice of such stimulation parameters means that it will be difficult to compare our results with those of other PET scan studies analyzing the effects of pallidal stimulation (Limousin et al, 1997; Davis et al, 1997; Fukuda et al, 2001), all of which report the effects of pallidal stimulation with the patient's usual stimulation conditions. We performed the clinical assessment and PET image acquisition 8 mins after the stimulation condition had been applied. In our experience (Bejjani et al, 1997), the main clinical effects occur within a few minutes after pallidal stimulation is applied. However, the possibility of longer-term changes being induced by pallidal stimulation—not addressed in the present study—cannot be excluded, as such changes have been reported with STN stimulation in PD (Temperli et al, 2003) and are considered to be involved in the beneficial effects of GP DBS in the treatment of dystonia (Tisch et al, 2007).
As observed in the first months after electrode implantation (Bejjani et al, 1997; Yelnik et al, 2000), stimulation applied within the GPe still improved contralateral rigidity and akinesia when applied in patients in the ‘off’ drug state more than a year after surgery. Similar improvements of PD symptoms were also recently reported with macrostimulation applied to the GPe intraoperatively in patients undergoing pallidotomy (Vitek et al, 2004). In our study, the improvement was associated with a decrease in rCBF in the ipsilateral cerebellum and PMC and an increase in movement-related activation in the ipsilateral sensorimotor cortex (Table 3). Both the clinical effects (Limousin et al, 1998; DBS for PD study group, 2001) and the cortical activation pattern (Limousin et al, 1997; Ceballos-Baumann et al, 1999; Payoux et al, 2004) of GPe stimulation were comparable to those observed with STN stimulation. The maximal area of activation during STN stimulation was observed in the SMA and the cingulate and dorsolateral prefrontal cortex (Limousin et al, 1997), in the rostral SMA and PMC (Ceballos-Baumann et al, 1999), or in the sensorimotor cortex (Payoux et al, 2004). The slight variations in the cortical activation pattern were probably because of the protocol design, especially the motor task used, which was different in each of the studies. Imaging studies in PD patients after withdrawal of dopaminergic treatment showed an impairment in the activation of the mesial frontal and prefrontal areas compared with healthy subjects (Jenkins et al, 1992; Playford et al, 1992; Rascol et al, 1992; Jahanshahi et al, 1995; Samuel et al, 1997; Sabatini et al, 2000; Haslinger et al, 2001). This impairment was postulated to be a consequence of excessive inhibitory input from the GPi and to provide the functional substrate of akinesia. In more recent studies, a relative overactivity in the cerebellum (Rascol et al, 1997) and in the lateral premotor and parietal regions (Samuel et al, 1997; Catalan et al, 1999; Sabatini et al, 2000; Haslinger et al, 2001) was also observed and was considered to reflect compensatory mechanisms. After the administration of levodopa or dopamine agonists, the improvement of PD symptoms is associated with a significant increase in the activation of the mesial frontal and prefrontal areas (Jenkins et al, 1992; Rascol et al, 1992, 1994; Haslinger et al, 2001). A relative normalization not only of the decreased activation in the mesial cortex but of the increased activity in the lateral premotor and parietal cortex has also recently been observed using event-related functional MRI (Sabatini et al, 2000). Coupled with the improvement of PD symptoms under GPe stimulation, we found a movement-related activation not of the mesial or prefrontal areas but of the sensorimotor cortex. The absence of significant activation of the mesial or prefrontal areas might be explained by a lack of power in the statistical analysis because of the low number of subjects or by the motor task used in our study. Interestingly, a similar pattern of activation was recently found under STN stimulation in patients performing the same motor task (Payoux et al, 2004). To briefly summarize, the improvement of PD symptoms by stimulation applied within either the GPe or the STN appears to be associated with changes in the pattern of cortical activation similar to those resulting from dopaminergic replacement therapy.
Summary of the effects of stimulation applied in the internal and the external part of the globus pallidus
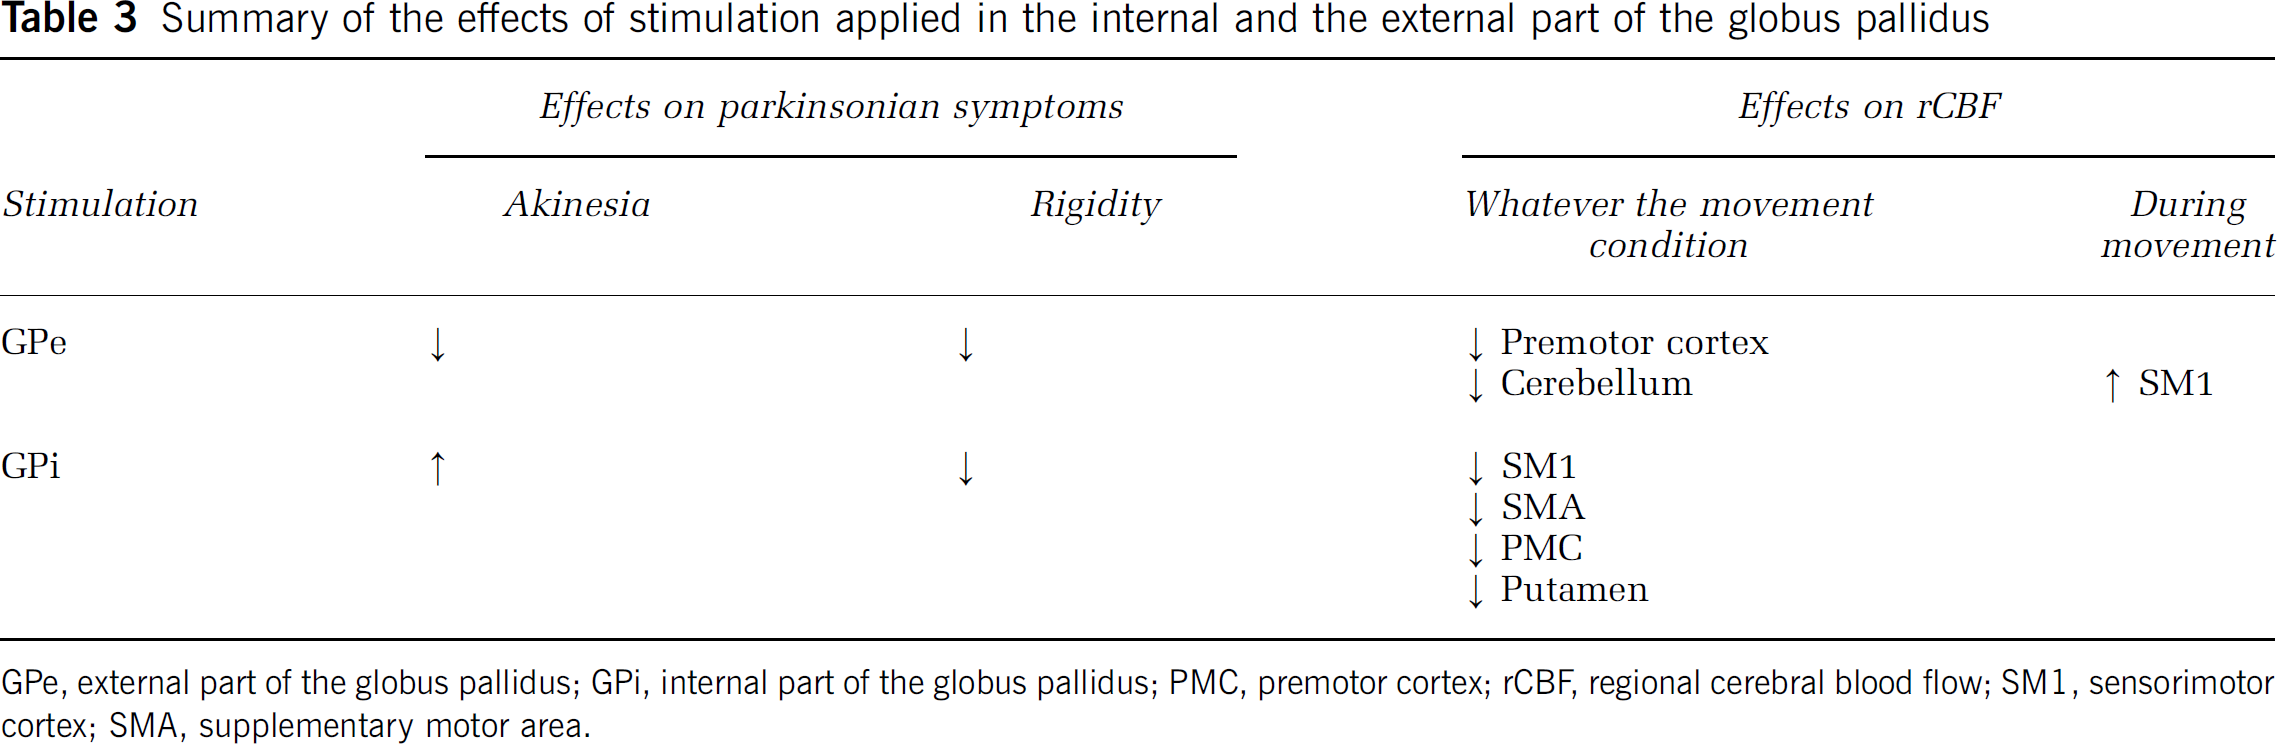
GPe, external part of the globus pallidus; GPi, internal part of the globus pallidus; PMC, premotor cortex; rCBF, regional cerebral blood flow; SM1, sensorimotor cortex; SMA, supplementary motor area.
Stimulation applied to the GPi improved rigidity and worsened akinesia. Such effects were also observed by another group (Krack et al, 1998b) and are consistent with a reduced speed of finger tapping, suggestive of a worsening of akinesia, and a shortening of the silent period in PD patients with GPi stimulation (Chen et al, 2001). In contrast to these results, another study (Vitek et al, 2004) did not observe a worsening of akinesia with intraoperative GPi stimulation. One explanation for this difference could be the more posterior location of the lead in the latter study. In our study, the improved rigidity and worsened akinesia observed with ventral GPi stimulation was associated with a widespread cortical inactivation including the anterior and posterior SMA, with no relative activation in the mesial frontal or prefrontal areas during movement (Table 3). This inactivation is consistent with the reduced activity of the SMA observed in patients experiencing akinesia during phases of drug treatment withdrawal (Jenkins et al, 1992; Playford et al, 1992; Rascol et al, 1992; Jahanshahi et al, 1995; Samuel et al, 1997; Sabatini et al, 2000; Haslinger et al, 2001). This widespread cortical inactivation may also explain the efficacy of GPi stimulation in greatly reducing levodopa-induced dyskinesia (Bejjani et al, 1997; Krack et al, 1998b), known to be associated with increased cortical activity in the SMA and in the contra- and ipsilateral SM1 (Rascol et al, 1998).
The fact that GPi stimulation improved rigidity but worsened akinesia in our study suggests that GPi stimulation modulates these two parkinsonian symptoms through different neuronal networks. Akinesia is usually considered to be associated with the hypoactivity of mesial frontal and prefrontal areas (Jenkins et al, 1992; Playford et al, 1992; Rascol et al, 1992; Jahanshahi et al, 1995; Samuel et al, 1997; Sabatini et al, 2000; Haslinger et al, 2001). The worsening of akinesia coupled with the inactivation of these regions, without activation during movement under GPi stimulation, is in line with this view. To our knowledge, no studies have specifically tried to correlate the symptom of rigidity with the pattern of motor cortical activation in PD. It has been postulated that the relative hyperactivity observed in the lateral PMC in PD patients is the expression of compensatory mechanisms, patients using a parallel pathway to compensate for the impairment of mesial frontal activation because of the lack of dopamine (Samuel et al, 1997; Rascol et al, 1997; Catalan et al, 1999; Sabatini et al, 2000; Haslinger et al, 2001). An alternative hypothesis is that this hyperactivation might be involved in the genesis of some of the ‘positive’ symptoms of PD, such as rigidity and tremor. The improvement of rigidity obtained with the stimulation of both the GPe and the GPi associated with a reduction of PMC hyperactivity would appear to support this hypothesis. As both the GPi and the GPe (through its projection to the GPi and the substantia nigra reticulata) have connections to the brainstem (Parent et al, 1999), the improvement of rigidity induced by the stimulation applied within these nuclei could also be linked to an activation of this descending pathway. Because the small size of the brainstem and its anatomical heterogeneity, such an activation is, however, difficult to detect with the current PET-scan spatial resolution (Thobois et al, 2004).
The exact mechanisms of stimulation are still not completely understood (Johnson et al, 2008). Moreover, the mechanisms might be different among the different nuclei within which DBS is applied. Compared with the STN for instance, the GP is a larger nucleus with lower cell somata density crossed by a high density of bundles (Yelnik et al, 2002). The effects of GP stimulation on both PD symptoms and rCBF likely result from a complex combination of action on local neurons and on crossing fibers and might also differ between the GPi and the GPe. Further studies will thus be needed to identify the exact neuronal networks activated by stimulation applied to these two nuclei.
Conflict of interest
None of the authors has any potential conflict of interest to disclose.