
Abstract
We developed a novel method to study dopaminergic neurotransmission using positron emission tomography (PET) with [1-11C]arachidonic acid ([1-11C]AA). Previous preclinical studies have shown the utility of [1-11C]AA as a marker of signal transduction coupled to cytosolic phospholipase A2 (cPLA2). Using [1-11C]AA and [15O]water PET, we measured regional incorporation coefficients K* for AA and regional cerebral blood flow (rCBF), respectively, in healthy male volunteers given the D1/D2 agonist (10 or 20 μg/kg subcutaneous) apomorphine. We confirmed a robust central dopaminergic response to apomorphine by observing significant increases in the serum concentration of growth hormone. We observed significant increases, as well as decreases in K* and increases in rCBF in response to apomorphine. These changes remained significant after covarying for handedness and apomorphine dosage. The magnitude of increases in K* was lower than those in our previous animal experiments, likely reflecting the smaller dose of apomorphine used in the current human study. Changes in K* may reflect neuronal signaling downstream of activated D2-like receptors coupled to cPLA2. Changes in rCBF are consistent with previous studies showing net functional effects of D1/D2 activation. [1-11C]AA PET may be useful for studying disturbances of dopaminergic neurotransmission in conditions such as Parkinson's disease and schizophrenia.
Introduction
Neuroimaging studies of dopaminergic function in the human brain predominantly rely upon the demonstration of receptor localization or measurement of dopamine synthesis/transport (Cropley et al, 2006; Elsinga et al, 2006; Volkow et al, 2009). These methods have helped to understand synaptic mechanisms relevant to dopaminergic neurotransmission in healthy subjects and in disease states. However, these approaches do not provide information on dopamine receptor-initiated signaling events in the brain, which might be useful for understanding physiologic mechanisms underlying normal dopamine function, as well as perturbations in disease states such as schizophrenia and Parkinson's disease (Brooks and Piccini, 2006; Hirvonen and Hietala, 2011; Dolan et al, 1995). The ability to study specific
We have reported on a quantitative autoradiography method in unanesthetized rodents designed to study signal transduction through dopaminergic D2-like receptors in response to a pharmacological challenge with apomorphine, a
We have extended this method in human subjects, using positron emission tomography (PET), to quantitatively study brain signal transduction involving AA, at rest and after visual stimulation (Esposito et al, 2007; Giovacchini et al, 2002, 2004). In this study, we used PET with [1-11C]AA to test the hypothesis, based in part on preclinical imaging after apomorphine (Bhattacharjee et al, 2008b), that regional changes in the incorporation of AA in the brain can be detected after a pharmacological challenge with apomorphine. Apomorphine is a mixed D1/D2 receptor agonist the affinity of which for D2-like (D2, D3, D4) receptors is 10 times higher than that for D1-like (D1 and D5) receptors (Scarselli et al, 2001). However, because D1 receptors are not coupled to cPLA2 activation, apomorphine is believed to release AA from membrane phospholipids solely through a D2-like coupled mechanism (Bhattacharjee et al, 2005, 2006, 2008b; Nilsson et al, 1998; Vial and Piomelli, 1995).
Our secondary aim was to identify apomorphine-induced changes in rCBF, as a measure of changes in functional activity, using 15O-water PET. A previous PET study in healthy volunteers scanned twice before and after 10 μg/kg subcutaneous apomorphine, while performing a cognitive task, revealed that apomorphine increased rCBF in the anterior cingulate, ventral motor cortex, and the dorsolateral prefrontal cortex, while decreasing rCBF in the retrosplenial cingulate region (Kapur et al, 1994). These regions are believed to form a functional network modulated by the dopaminergic system. Similarly, in a study on normal volunteers, 10 μg/kg apomorphine compared with saline injection increased rCBF in the anterior cingulate and prefrontal cortices without any observed reductions in rCBF (Grasby et al, 1993). In another study, schizophrenic patients performing a cognitive task displayed significantly enhanced rCBF in the anterior cingulate cortex relative to controls after pharmacological challenge with apomorphine (Dolan et al, 1995).
Taken together with these previous findings, we reasoned that measuring AA incorporation and rCBF in response to apomorphine in healthy volunteers during a ‘resting state' would delineate the regional anatomic distribution of signal transduction coupled to cPLA2 through D2-like receptors, as well as neuronal activity, initiated by stimulation of D1/D2 receptors.
Materials and methods
Participants
Research participants in this study were recruited as part of a clinical protocol (protocol number: 06-M-0246) approved by the Combined Neuroscience Institutional Review Board and by the Radiation Safety Committee of the National Institutes of Health (NIH). Subjects were healthy adult male volunteers (
Positron Emission Tomography Scanning
Here, [1-11C]AA was synthesized as reported previously (Chang et al, 1997; Channing et al, 1992). The tracer was 97.6% pure on high-performance liquid chromatography, and its specific activity exceeded 3,700MBq (100mCi)/μmol. On the day of PET imaging, an indwelling radial artery catheter was inserted under local anesthesia in the nondominant hand and an ante-cubital venous catheter inserted in the contralateral arm. The subject's head was secured in a thermoplastic face mask fixed to the scanner bed. Scanning was performed using an Advance Tomograph (GE Healthcare, Waukesha, WI, USA), which acquires 35 simultaneous slices with 4.25-mm separation and has in-plane and axial resolutions of 6 to 7 mm. Scans were performed parallel to the orbitomeatal line and were conducted in a quiet, dimly lit room, with the subject's eyes open and ears unoccluded.
For each subject, two separate PET scans were acquired on the same day with an interval of 1.5 hours between each session. In the first session, a transmission scan was initially performed for attenuation correction. After the transmission scan, ~0.15 mL of saline vehicle was injected subcutaneously. Three minutes later, 370MBq (10mCi) of 15O-water was injected as an intravenous bolus. A 60-second scan in the three-dimensional mode started automatically when the bolus reached the brain, detected by a threshold of count increase. Concurrent to PET scanning, arterial input function was measured continuously using an automated blood counter (Herscovitch et al, 1983). To quantify regional values of K* for AA, 15 minutes after the 15O-water injection, 920 ± 115MBq (24.9 ± 3.1mCi) of 1-11C-AA was infused intravenously for 1 minutes at a constant rate. Serial dynamic three-dimensional scans (30 seconds to 5 minutes) were performed for 1 hour. Radial artery blood (1 to 3 mL) was sampled manually at fixed times, and radioactivity in whole blood and plasma measured using a γ-counter. The second PET session was identical to the first but was performed after injecting apomorphine (4 subjects with 20 μg/kg subcutaneous, 8 subjects with 10 μg/kg subcutaneous; see the ‘Results' section) in place of saline vehicle after a second transmission scan. Subjects were allowed to get off the bed in between the two scanning sessions.
Coregistration to Magnetic Resonance Images
For each subject, the original PET image of 1-11C-AA injection was registered to the 15O-water image to correct for motion between the two scans, using a six-parameter transformation and a mutual information cost function (Giovacchini et al, 2004; Jenkinson and Smith, 2001). The [15O]water and magnetic resonance imaging images of the individual subject were then coregistered using the same six-parameter algorithm. The product of the two transformation matrices was used to bring the dynamic image of [1-11C]AA into the magnetic resonance imaging space where correction for partial volume effect (PVE) and modeling took place. Partial volume correction was performed by implementing the magnetic resonance imaging-based three-compartment model described by Muller-Gartner et al (1992). Details of procedures adopted for motion correction of images, generation of plasma time—activity curves, and partial volume correction have been described previously (Giovacchini et al, 2002, 2004).
Modeling
On a pixel-by-pixel basis, rCBF images were generated using the [15O]water scan and continuous arterial blood samples. Parametric images of K* for AA (incorporation coefficient of plasma AA into the brain tissue, μL/min per cm3 of the brain) and of
where
Positron Emission Tomography Data Analysis
The rCBF and K* images were realigned and spatially normalized into standard stereotactic space and smoothed to full-width at half-maximum of 10 × 10 × 10 mm3 in the
Measurement of Serum Growth Hormone
Arterial blood samples (2 mL) were collected at baseline on the morning of the PET scan (G0), as well as 30 and 60 minutes after saline (G1 and G2, respectively) and apomorphine (G3 and G4, respectively) injections, for measurement of serum growth (GH) hormone concentrations. Serum samples were assayed for GH concentration using a chemiluminiscent immunometric assay (IMMULITE 2500, Siemens USA, Deerfield, IL, USA) as per the manufacturer's instructions.
Results
Apomorphine Induced Changes in Brain Incorporation Coefficient K* of Arachidonic Acid
After pharmacological challenge with apomorphine, we observed significant increases in the regional incorporation coefficients K* of AA in distinct brain regions relative to the saline condition. Affected regions included the left superior medial frontal gyrus (Brodmann area (BA) 6), right superior frontal gyrus (BA 8), right superior temporal gyrus (BA 38), right precentral gyrus/motor cortex (BA 4), right fusiform gyrus (BA 20), brainstem, and the right cerebellar hemisphere (Figure 1, Table 1).
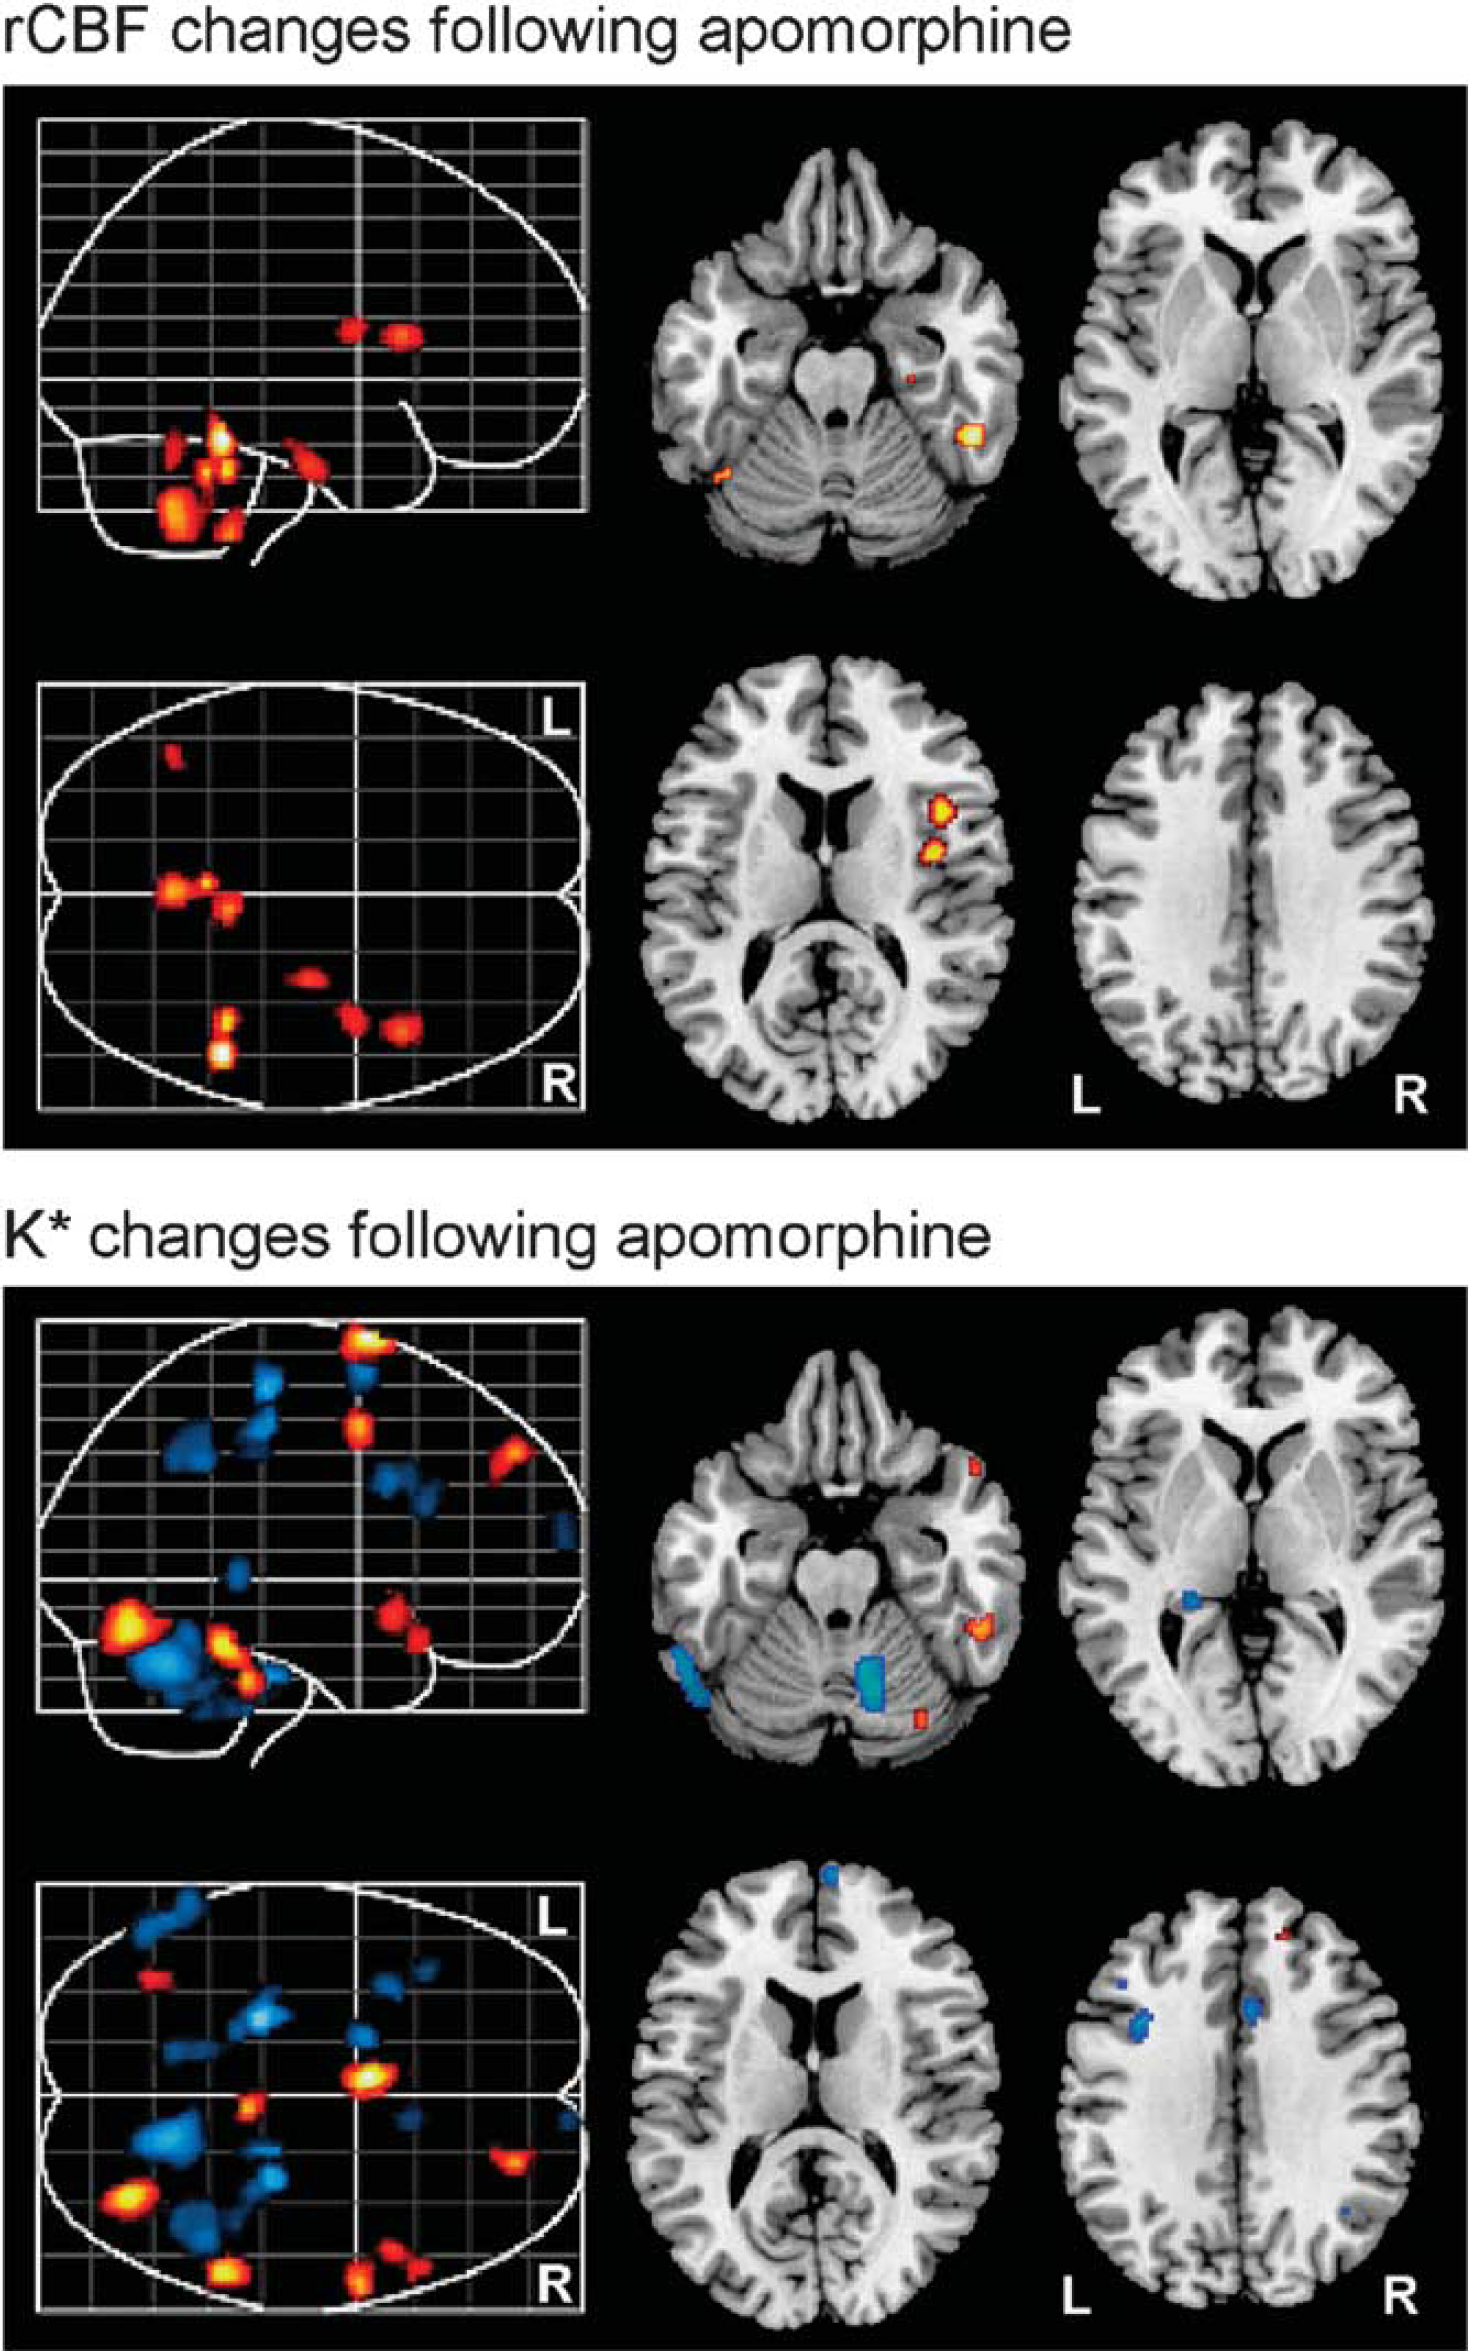
Representative differences in rCBF (top) and K* (bottom) in the brain after apomorphine challenge (relative to saline vehicle). Red and blue regions indicate significant increases and decreases, respectively. rCBF, regional cerebral blood flow.
Local maxima within areas of significant differences in incorporation coefficient K* for arachidonic acid after apomorphine challenge
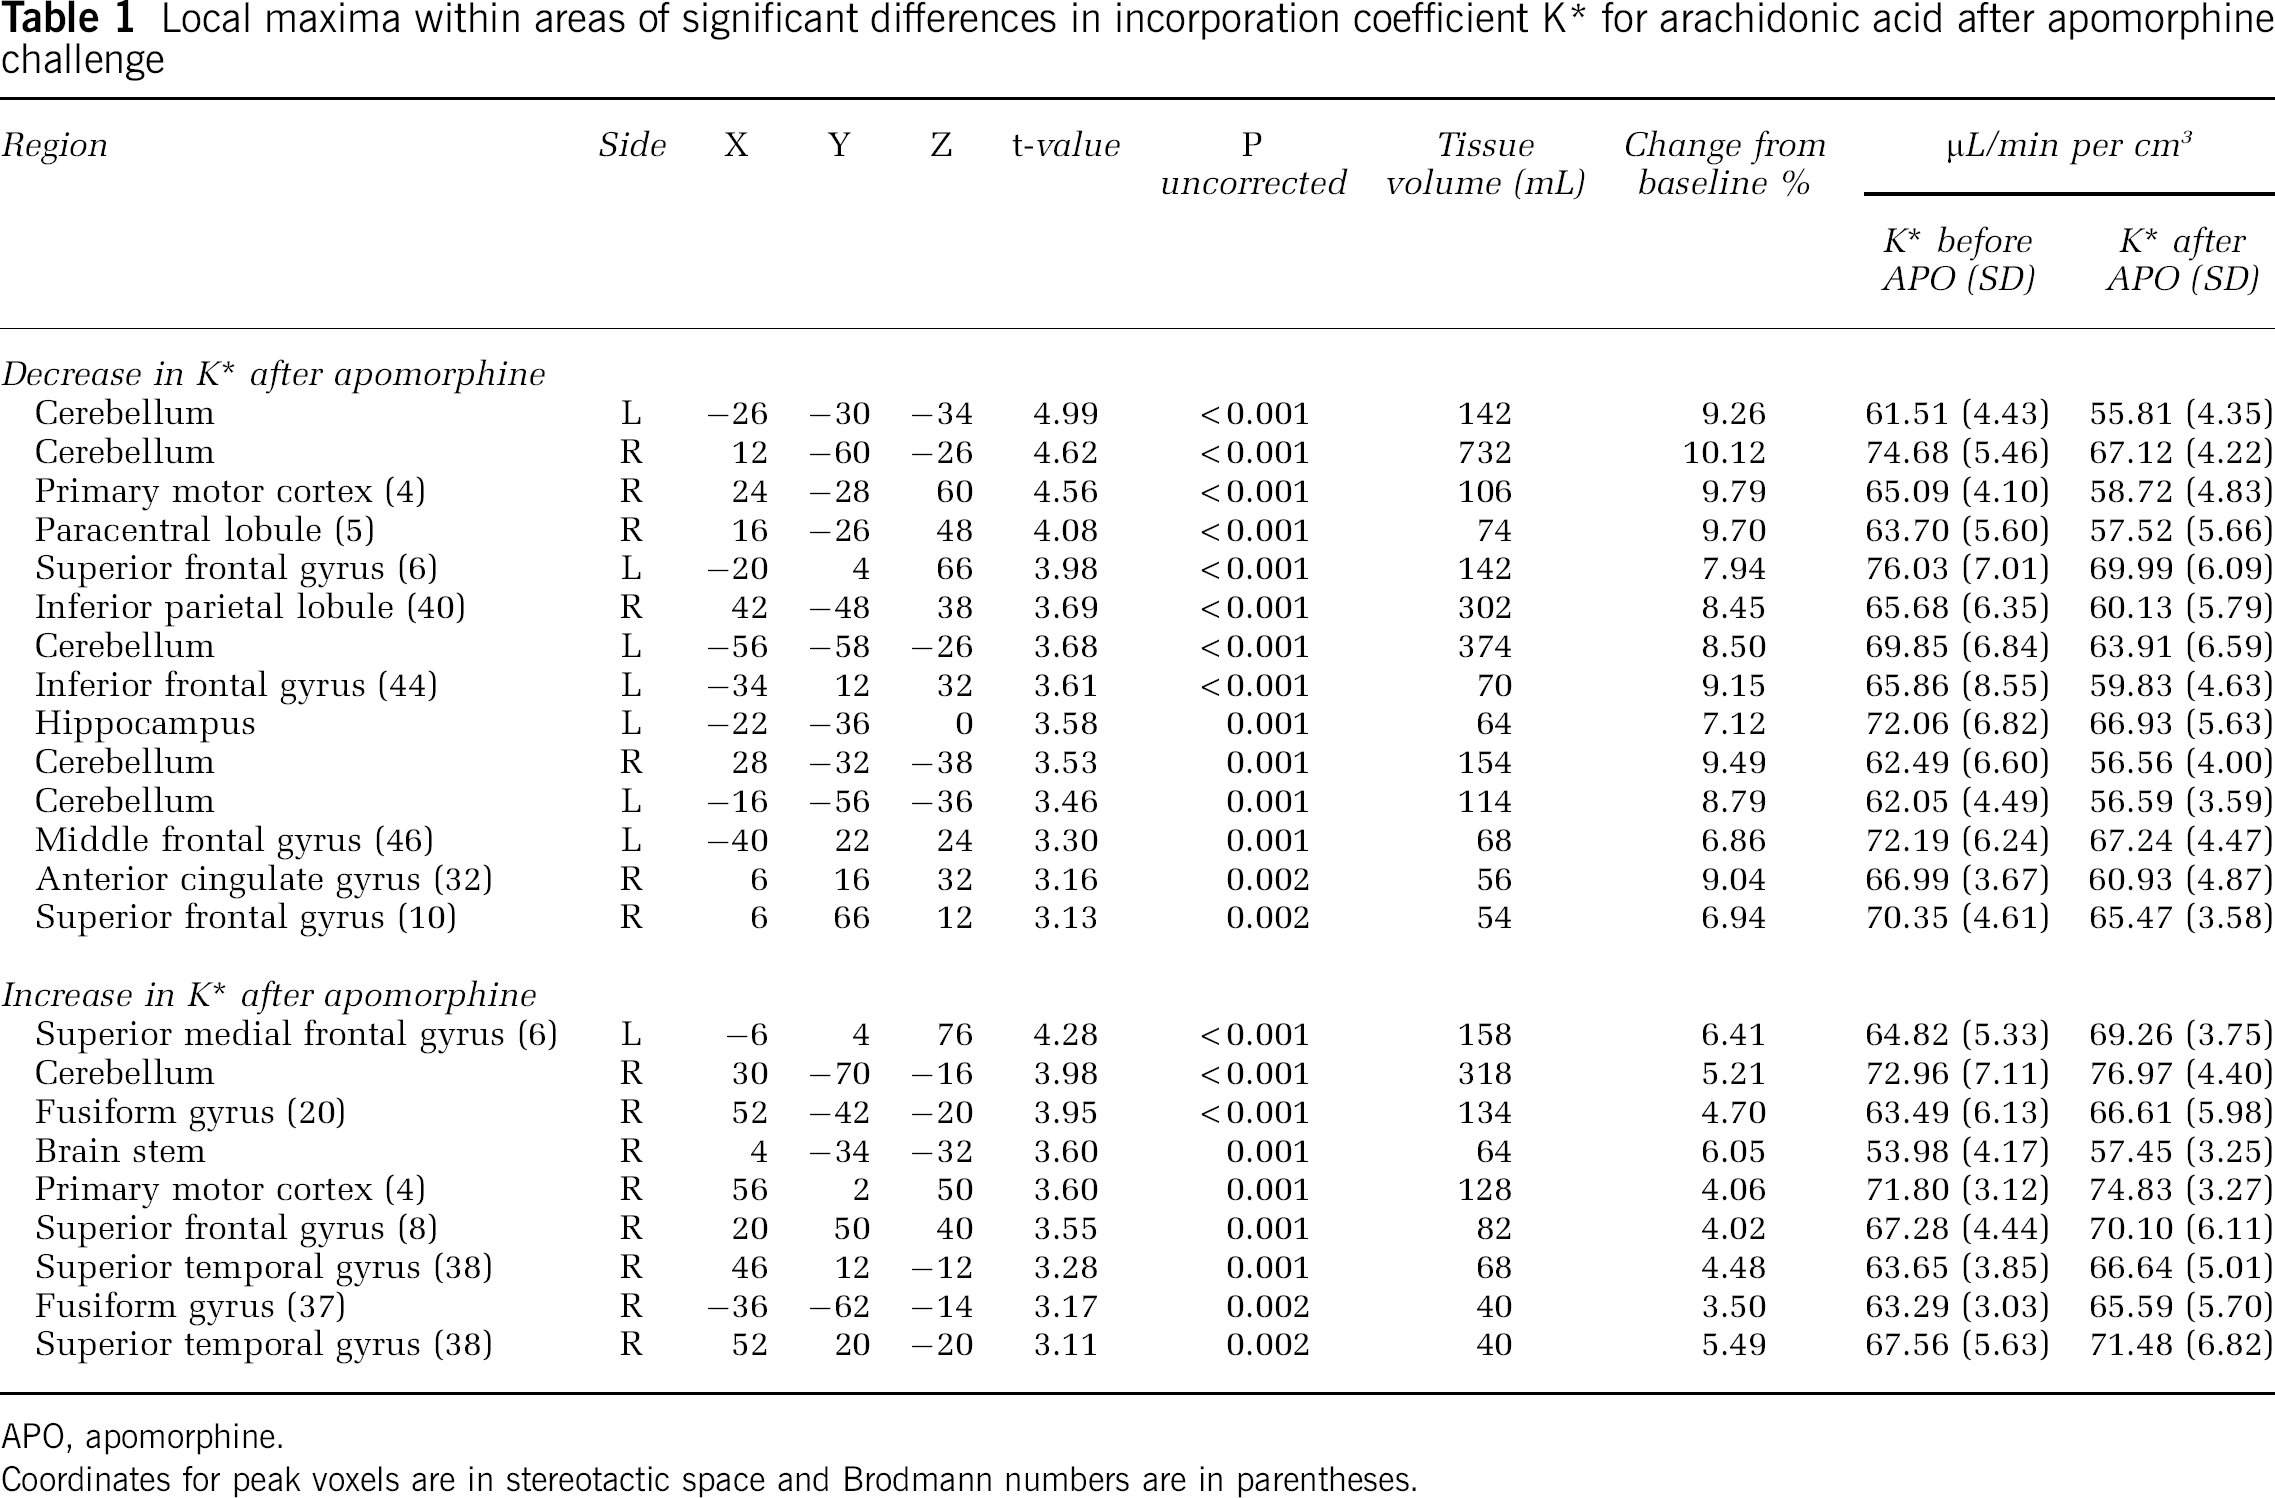
APO, apomorphine.
Coordinates for peak voxels are in stereotactic space and Brodmann numbers are in parentheses.
Apomorphine-induced decreases in K* for AA were observed in the left superior frontal gyrus (BA 6), right precentral gyrus/motor cortex (BA 4), right paracentral lobule (BA 5), right inferior parietal lobule (BA 40), left inferior frontal gyrus (BA 44), left hippocampus, left middle frontal gyrus (BA 46), right anterior cingulate gyrus (BA 32), right superior frontal gyrus (BA 10), right fusiform gyrus (BA 20), right superior temporal gyrus (BA 38), and regions within bilateral cerebellar hemispheres (Figure 1, Table 1). The observed changes in apomorphine-induced incorporation coefficients K* of AA remained significant even after covarying for subject handedness and apomorphine dosage.
Apomorphine Induced Changes in Regional Cerebral Blood Flow
We observed significant increases in rCBF after administration of apomorphine relative to the saline condition, in the right fusiform gyrus (BA 20), right parahippocampal gyrus (BA 35), right insula, as well as in bilateral cerebellar hemispheres (Figure 1, Table 2). The observed changes in apomorphine-induced rCBF remained significant even after covarying for subject handedness and apomorphine dosage.
Local maxima within areas of significant differences in rCBF after apomorphine challenge
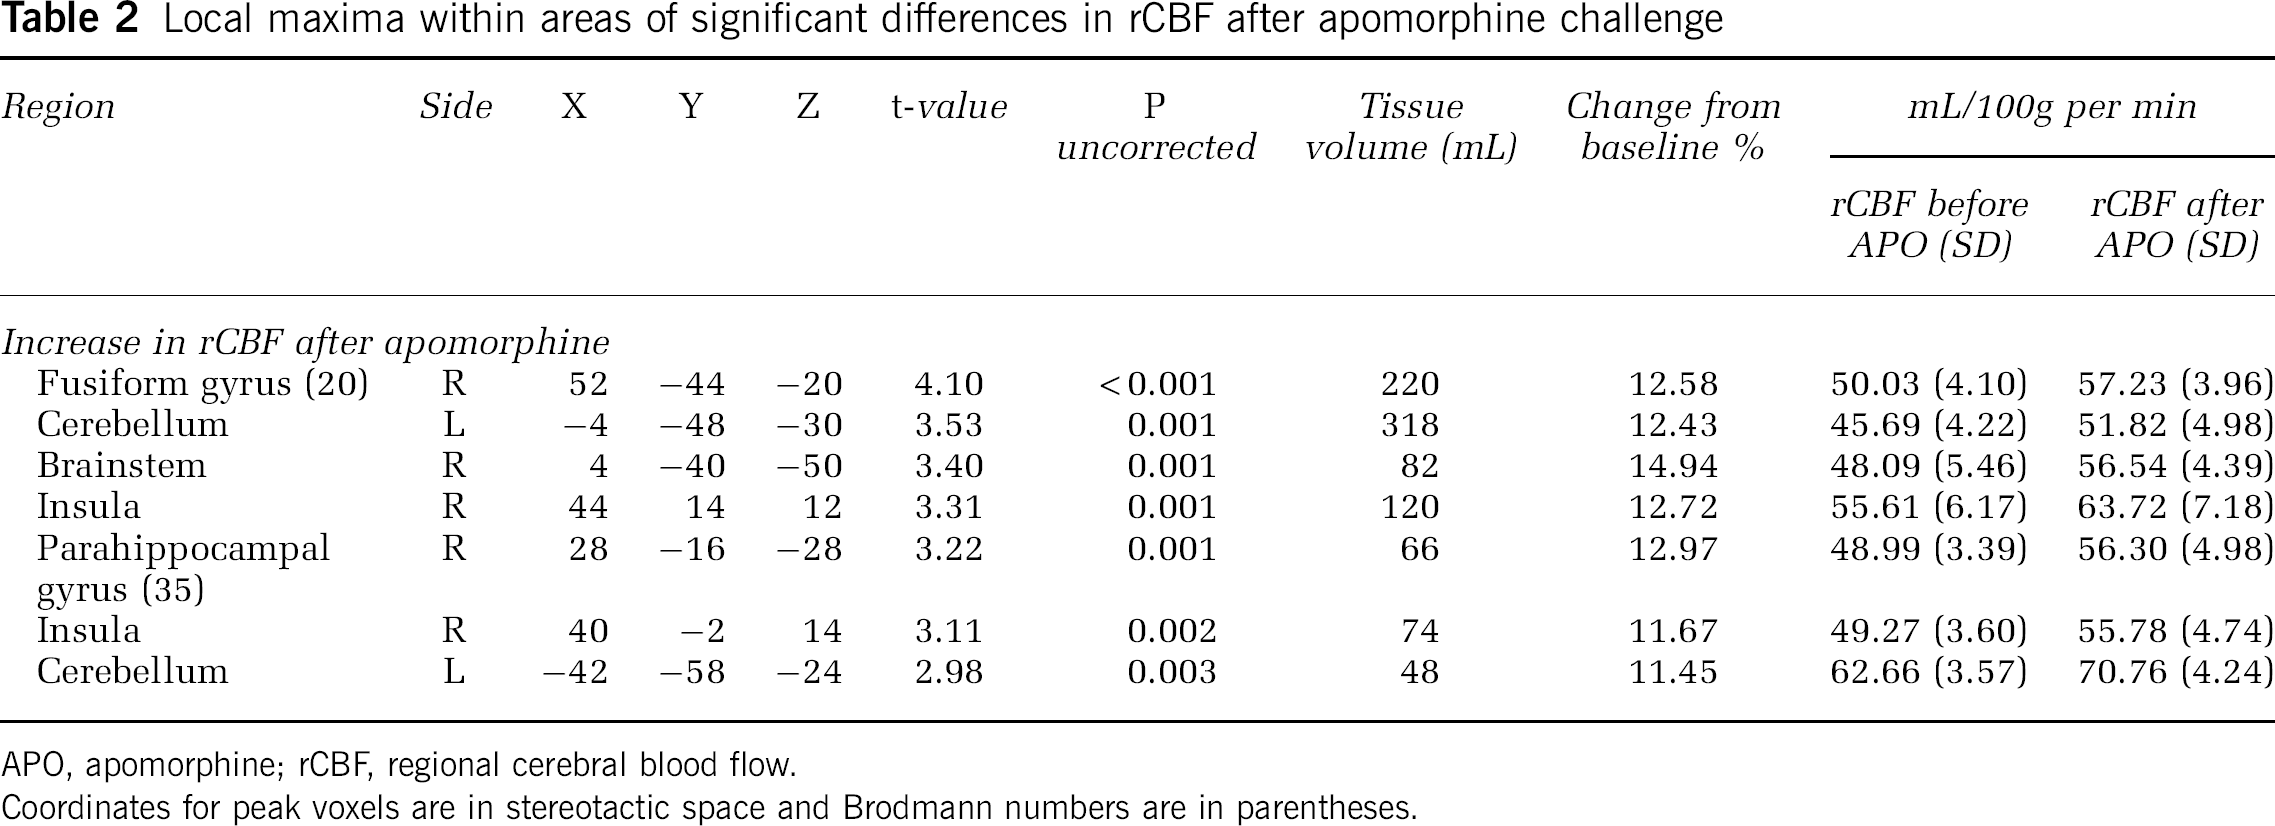
APO, apomorphine; rCBF, regional cerebral blood flow.
Coordinates for peak voxels are in stereotactic space and Brodmann numbers are in parentheses.
Serum Growth Hormone Concentration
The mean serum GH concentration at baseline (G0) was 0.16 ng/mL (range < 0.1 to 0.6 ng/mL). The mean serum GH concentrations after 30 minutes (G1) and 60 minutes (G2) after injection of saline vehicle were 0.3 ng/mL (range <0.1 to 0.9 ng/mL) and 2.9 ng/mL (range 0.1 to 19.1 ng/mL), respectively. After administration of apomorphine, mean serum GH concentrations at 30 minutes (G3) and 60 minutes (G4) were 13.4 ng/mL (range 0.1 to 53.8 ng/mL) and 11.9 ng/mL (range 2.1 to 37.0 ng/mL), respectively (Table 3). The increase in serum GH concentration following apomorphine was significantly greater than following saline (
Mean serum growth hormone (GH) concentrations measured at baseline (G0), 30 and 60 minutes following saline (G1 and G2, respectively) and apomorphine (G3 and G4, respectively)
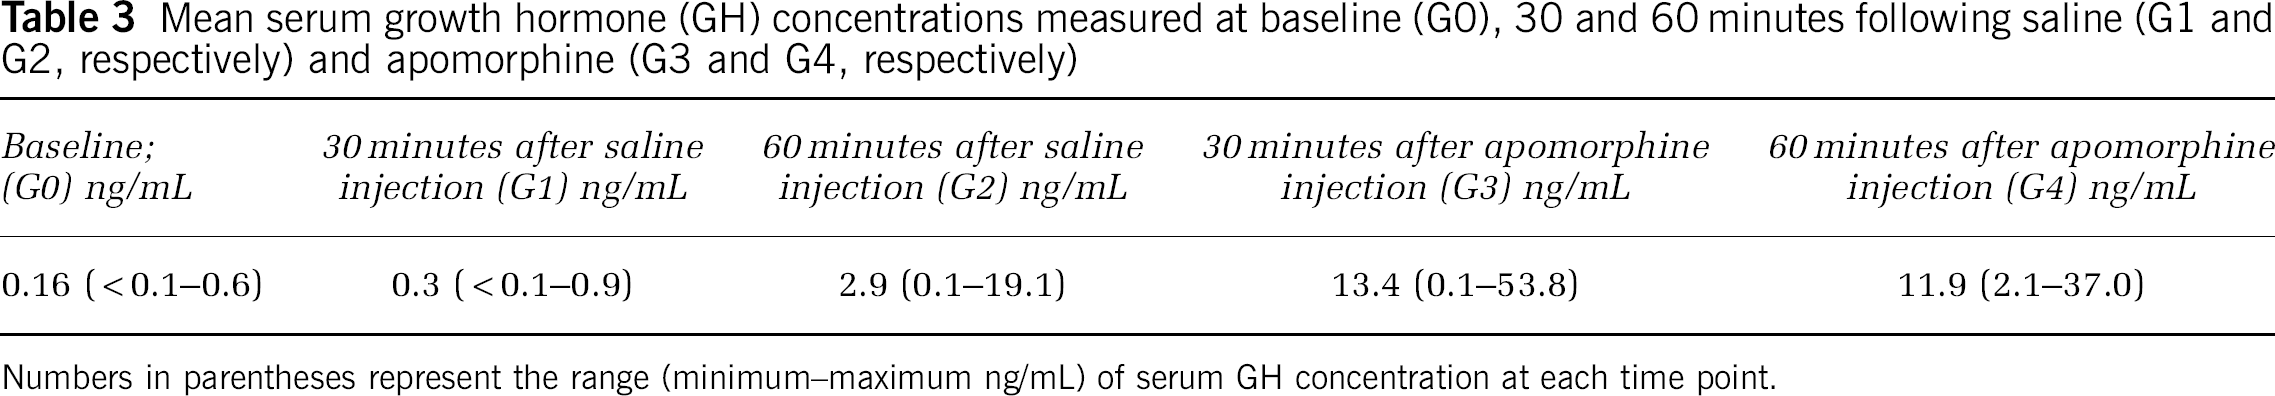
Numbers in parentheses represent the range (minimum—maximum ng/mL) of serum GH concentration at each time point.
Tolerability and Dosage of Apomorphine
All research participants whose PET data were used in this analysis completed the protocol without any adverse events (
Discussion
We have developed a novel PET method using 11C-labeled AA and have used it for the first time in humans to visualize
Although our current results represent a substantial extension of our previous preclinical observations in unanesthetized rodents, the magnitude of apomorphine-induced increases in K* that we observed in this human study is considerably lower than those in animal experiments (Bhattacharjee et al, 2008b). The most likely explanation for these differences is the different doses of apomorphine administered in animal relative to human studies. We injected 0.5 mg/kg of apomorphine intraperitoneally in rodent experiments, whereas in the current human volunteer study, the dose of apomorphine that we determined could be safely administered was 10 to 20 μg/kg subcutaneous. The considerably higher dose of apomorphine challenge used in animal studies likely resulted in a much better signal:noise ratio than in this human study. This is an important consideration that must be taken into account in the interpretation of our current results. The dose-limiting considerations in the use of apomorphine as a pharmacological challenge in healthy human subjects may thus also limit our ability to derive accurate quantitative estimates of D2 receptor-mediated AA release in the paradigm we used in these studies.
Our findings of increases in rCBF in response to apomorphine are consistent with previous [15O]water PET investigations (Kapur et al, 1994; Grasby et al, 1993). Although the regional pattern of changes in rCBF after apomorphine were distinct from those in K* in most regions, suggesting that these were associated with altered activity of neurons not involving cPLA2 activation, we observed concomitant increases in K* and rCBF in the right fusiform gyrus, suggesting a close coupling of neuronal activity and cPLA2-initiated signal transduction in this brain region. However, this coupling does not reflect the effect of altered rCBF on K* for AA, since K* has been shown to be blood flow independent (Chang et al, 1997; Esposito et al, 2008). Our findings are also comparable to a previous fluorodeoxyglucose PET study that showed increased glucose metabolism in the posterior frontal and inferior parietal regions after apomorphine (Cleghorn et al, 1991).
Consistent with previous studies, we did not observe any significant change in rCBF in the striatum (Grasby et al, 1993; Kapur et al, 1994). Similarly, no change in K* was seen in this region, which has a very high density of dopamine receptors. To explain this apparent paradox, Kapur et al, (1994) have suggested that although receptor-binding studies pinpoint regions with high receptor density (Farde et al, 1986; Sedvall et al, 1986; Sedvall, 1990), studies identifying functional effects of dopaminergic drugs, such as ours, map the regions where receptor binding in such regions leads to downstream functional effects. Therefore, it is plausible that activation of D1/D2 receptors at striatal sites produces modulated neuronal firing and cPLA2-mediated AA release in the extrastriatal brain regions identified in our study. Supporting this idea, our observed increases in K* occurred in regions receiving rich projections from the striatum, including the motor cortex and mesial frontal cortex (Alexander and Crutcher, 1990). We also found predominantly right hemispheric increases in K* after apomorphine. Although our study sample included both right- and left-handed individuals, this observation is consistent with the reported hemispheric asymmetry within the dopaminergic system in healthy individuals (Cannon et al, 2009; Tomer et al, 2008; Vernaleken et al, 2007).
Besides the single subject who experienced bradycardia and hypotension after 20 μg/kg subcutaneous apomorphine, and who responded to intravenous hydration, no serious adverse events were observed in response to apomorphine at the doses used in this study (10 to 20 μg/kg subcutaneous). Previous studies have reported minor side effects including somnolence, nausea, dizziness, and hallucinations in response to apomorphine (Aymard et al, 2003; Bowron, 2004; Menon and Stacy, 2007). To prevent apomorphine-induced nausea during the PET protocol, we premedicated study participants with the antiemetic trimethobenzamide (Bowron, 2004). This medication was well tolerated without any side effects and completely prevented nausea during the course of the scanning procedure.
To confirm a robust central response to apomorphine, we assayed serum concentration of GH at baseline and at 30 and 60 minutes after injection of saline vehicle and apomorphine. Consistent with previous reports, we observed significant increases in serum GH levels in response to apomorphine relative to saline vehicle (Aymard et al, 2003; Kapur et al, 1994). Therefore, this finding suggests that the changes in K* and rCBF observed after apomorphine were induced by a measurable central effect of the drug.
Some important differences between this investigation and previous PET studies of dopaminergic neurotransmission merit consideration in interpreting our results. Unlike other studies, we did not include a cognitive task in our PET paradigm (Grasby et al, 1993; Kapur et al, 1994), choosing instead to measure the PET signals in a true resting state. Cognitive tasks have been used in previous PET studies of dopaminergic function to standardize the behavioral state and thereby reduce intrasubject and intersubject variability in rCBF. However, we chose not to use a cognitive task in our PET protocol, to avoid task-induced activations of brain regions that might in turn influence changes in K* and rCBF. However, this may have reduced the signal:noise ratio of our observations by increasing the baseline variance in neuronal activity. Another factor to be considered is that, in the interests of subject safety and to prevent apomorphine-induced nausea, we premedicated our study participants with trimethobenzamide. There is some suggestion that benzamides possess presynaptic and postsynaptic actions on dopaminergic systems (Elliott et al, 1977). It is unclear to what extent this medication may have influenced our PET results. An additional caveat that must be considered in the interpretation of our findings is that with the relatively small number (
In summary, we used [1-11C]arachidonate PET in a study of healthy human subjects to show measurable effects on regional brain AA incorporation and rCBF in response to pharmacological challenge with apomorphine, a D1/D2 receptor agonist. Our study shows the feasibility of this strategy to visualize
Footnotes
Acknowledgements
MT and SIR are grateful to Ms Jane Bell (deceased) for her invaluable contributions to this study. We also acknowledge the dedication and professionalism of the nursing staff of the 7SE Unit, NIH Clinical Center.
The authors declare no conflict of interest.