
Abstract
As an alternative to functional magnetic resonance imaging (fMRI) with blood oxygenation level dependent (BOLD) contrast, cerebral blood volume (CBV)-weighted fMRI with intravascular contrast agents in animal models have become popular. In this study, dynamic measurements of CBV were performed by magnetic resonance imaging (MRI) and laser-Doppler flowmetry (LDF) in α-chloralose anesthetized rats during forepaw stimulation. All recordings were localized to the contralateral primary somatosensory cortex as revealed by BOLD at 11.7 T. Ultra-small superparamagnetic iron oxide (15mg/kg)—a plasma-borne MRI contrast agent with a half-life of several hours in blood circulation—was used to quantify changes in magnetic field inhomogeneity in blood plasma. The LDF backscattered laser light (805 nm), which reflects the amount of red blood cells, was used to measure alterations in the non-plasma compartment. Dynamic and layer-specific comparisons of the two CBV signals during functional hyperemia revealed excellent correlations (> 0.86). These results suggest that CBV measurements from either compartment may be used to reflect dynamic changes in total CBV. Furthermore, by assuming steady-state mass balance and negligible counter flow, these results indicate that volume hematocrit is not appreciably affected during functional activation.
Introduction
Non-invasive mapping of brain activation by functional magnetic resonance imaging (fMRI) provides relatively high spatiotemporal resolution with fairly large coverage of the brain. Because of technological advances, fMRI can now be conducted with many different contrasts because the magnetic resonance imaging (MRI) signal can be made sensitive to changes in blood oxygenation (BOLD), blood flow (CBF), and blood volume (CBV). Although the BOLD contrast is the favored fMRI technique, CBF and CBV approaches are finding wider appeal because these methods are affected less by complicating factors that contribute to BOLD (Ogawa et al, 1993).
As the earliest fMRI maps of human brain function with CBV contrast using repeated bolus injections of a paramagnetic contrast agent that has a relatively short half-life in blood circulation (Belliveau et al, 1991), intravascular paramagnetic contrast agents that maintain a steady blood concentration over several hours have allowed CBV measurements in animals with much better spatiotemporal resolution (Kennan et al, 1998). Because these MRI contrast agents are solely plasma borne (Mandeville et al, 1998), concerns remain about whether these signals reflect changes in total CBV.
Toward that end, in α-chloralose anesthetized rats during forepaw stimulation, we carried out dynamic CBV measurements by MRI using a superparamagnetic iron oxide contrast agent and compared these transients to CBV measured by laser-Doppler flowmetry (LDF). Using the LDF backscattered laser light to reflect the amount of red blood cells (Barfod et al, 1997), we assessed volume alterations in the cellular compartment. We found excellent correlations between CBV dynamics in plasma (CBVplasma) and red blood cell (CBVrbc) at different depths of the cortex in the contralateral somatosensory region (S1), suggesting that either of these measures may be used for transients in total CBV (CBVtotal). Issues of CBV quantification for understanding the BOLD contrast are discussed.
Materials and methods
Animal Preparation
Sprague—Dawley rats (n = 18) were tracheotomized and artificially ventilated (70% N2O, 30% O2). The anesthesia was switched to α-chloralose (i.p., 80 mg/kg initial dose, then 40 mg/kg/h) from halothane (1% to 2%) after the surgery. A femoral arterial line was used for monitoring blood pressure, acid-base balance, and blood gases throughout the experiment. A femoral vein was cannulated for injecting the MRI contrast agent. A pair of copper wires was inserted below the skin of the forepaw. Each stimulus train lasted 30 secs with 3 Hz frequency using pulses of 2 mA in amplitude and 0.3 ms in duration. All stimulus presentation was controlled by a μ 1401 analog-to-digital converter unit (CED, Cambridge, UK) running custom-written script for providing block design (off-on-off) electrical stimuli of 30 secs in duration with 900 secs in between consecutive stimuli presentations. MRI and LDF measurements were performed on two separate groups of animals.
MRI Measurements
All fMRI data (n = 6) were obtained on a modified 11.7 T Bruker horizontal-bore spectrometer (Billerica, MA, USA) using a 1H surface coil radio-frequency probe (1.4 cm diameter). BOLD signal was acquired with sequentially sampled echo-planar imaging (EPI) using gradient echo contrast Hyder et al (1995) with repetition and echo times of 1000 and 15 ms, respectively. The field of view was 2.56 cm in both axes with in-plane matrix of 64 × 64 and slice thickness was 2 mm. CBV signal was measured by the same EPI parameters but in the presence of an intravenous injection of iron oxide nanocolloid particles (Combidex, 15 mg/kg, AMAG, Cambridge, MA, USA) that has a very long half-life in blood circulation of rodents (Kida et al, 2000). Since with the MRI contrast agent on board stimulation-induced decrease in the EPI signal reflected an increase in volume, all CBV-weighted MRI data were multiplied by −1 to reflect positive changes in plasma during functional hyperemia (CBVplasma).
LDF Measurements
The rats (n = 12) were placed in a stereotaxic holder (Kopf Instruments, Tujunga, CA, USA) on a vibration-free table inside a Faraday cage. Tiny burr holes above the S1 region (4.4 mm lateral and 1.0 mm anterior to bregma) were drilled and fiber optodes (interoptode distance of 200 mm; giving a sampling volume of ~ 0.1 μL) were inserted into three different depths (0.3 ± 0.1, 1.0 ± 0.1, and 1.5 ± 0.1 mm, respectively, for upper, middle, and lower layers; n = 4 for each depth) of the cortex with stereotaxic manipulators to measure two independent LDF signals (805 nm; Oxford Optronix, Oxford, UK) of red blood cell activity: the flux and backscattered light which are believed to reflect CBF and CBV dynamics, respectively (Barfod et al, 1997; He et al, 2007). Data were digitized at a rate of 50 Hz. As stimulation-induced decrease in the backscattered signal reflected an increase in volume, all backscatter data were multiplied by −1 to reflect positive changes in red blood cell volume during functional hyperemia (CBVrbc).
Results
Forepaw stimulation in α-chloralose anesthetized rats, in agreement with prior results, reproducibly increased BOLD (Sanganahalli et al, 2008) and LDF (Ances et al, 1999) signals predominantly in the contralateral S1 (Figure 1A and 1B). The averaged BOLD and LDF responses from all layers of S1 were 6.1% ± 0.3% (n = 6) and 36% ± 12% (n = 12), respectively, where each averaged signal peaked within 6 ± 1 and 4 ± 1 secs, respectively. The magnitude of the relative CBF signals measured by LDF were lower than quantitative CBF changes measured by MRI methods (Hyder et al, 2001; Kida et al, 2004; Maandag et al, 2007). In contrast, the CBV signals demonstrated different dynamics (Figure 1C and 1D).
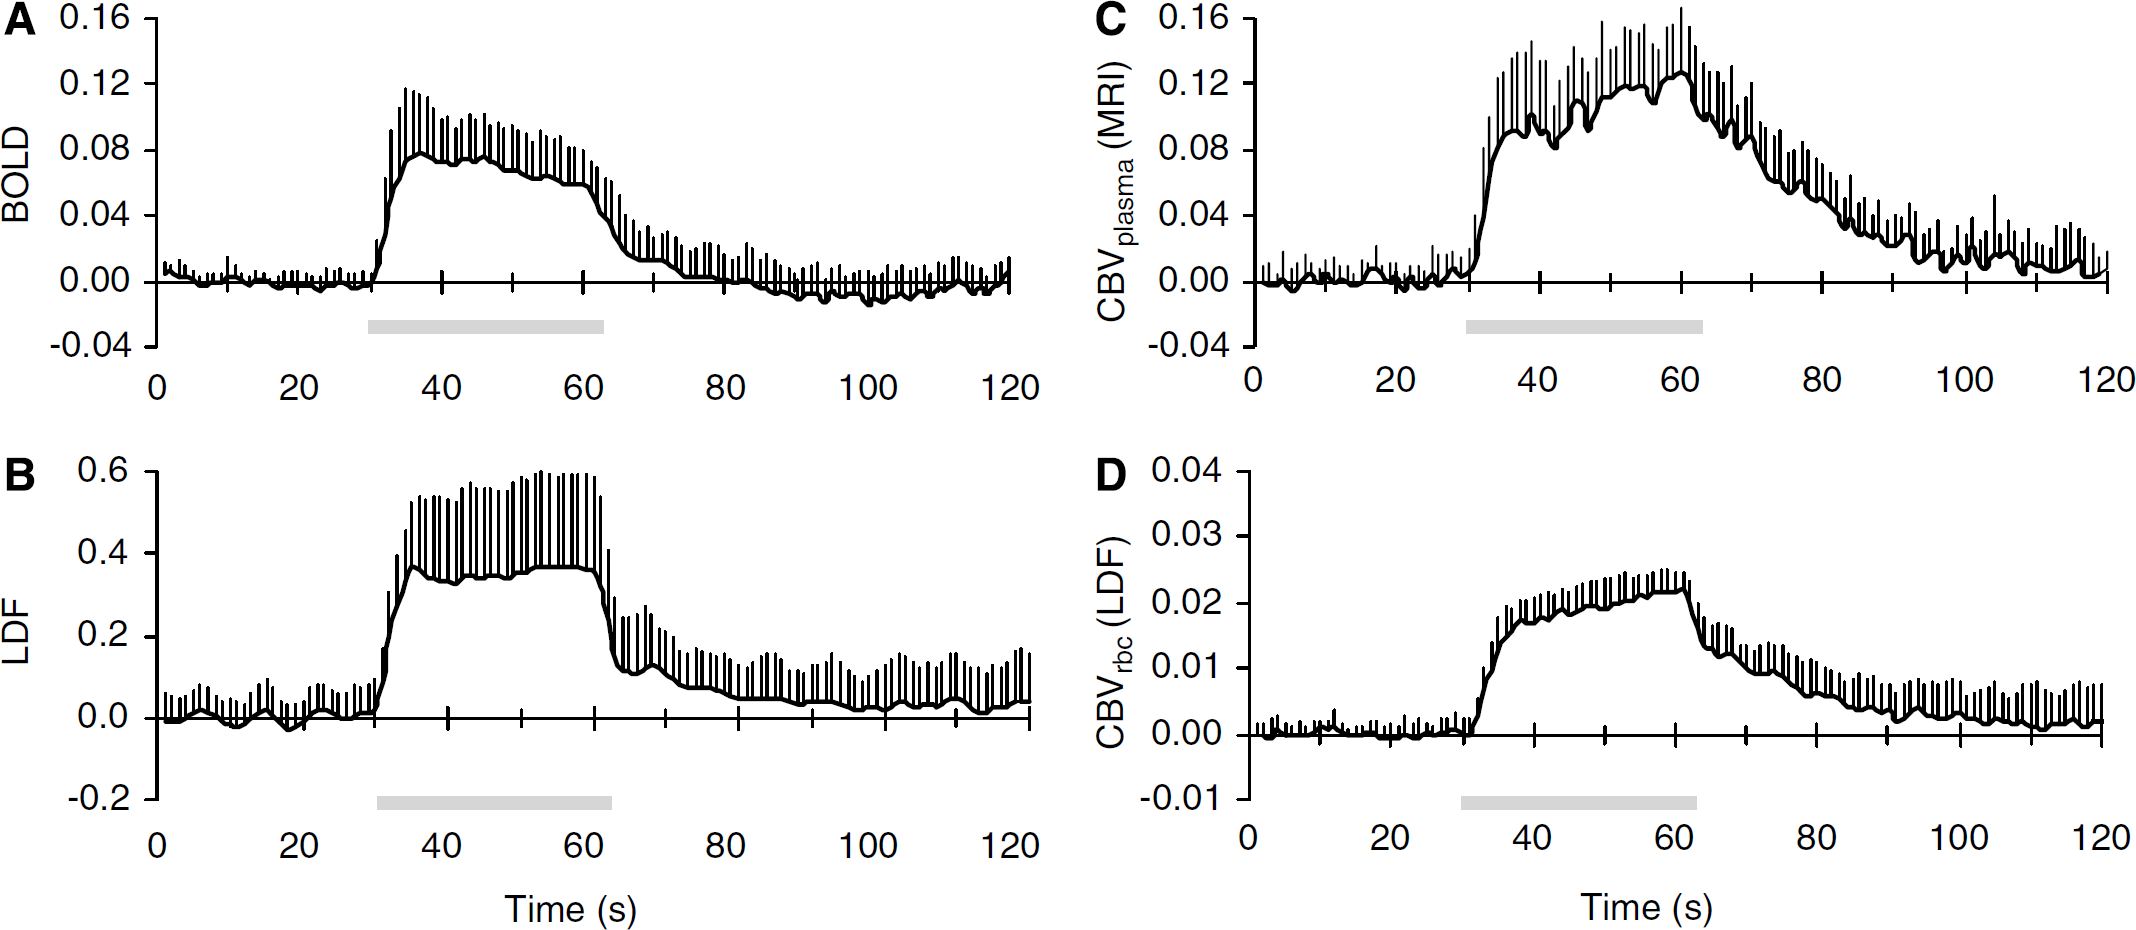
Functional changes in BOLD, CBF, and CBV signals during forepaw stimulation. Dynamics of (
The averaged CBVplasma and CBVrbc changes from all layers of S1 were 9.5% ± 3.6% (n = 6) and 1.6% ± 0.1% (n = 12), respectively. Despite the magnitude difference between these signals, the dynamics of these CBV-weighted transients appeared to be quite similar. Both normalized CBV signals demonstrated a rapid increase (B16% per second) within the first 5 secs (i.e., onset phase), then reached a pseudo steady-state with the signals increasing very slowly (B0.8% per second) until the end of stimulation (i.e., plateau phase), and after stimulation offset the signals began to decrease (i.e., offset phase) but much more slowly (B1.3% per second) than during the initial rise.
The dynamic CBVplasma and CBVrbc signals from all layers of S1 were compared (Figure 2A) to reveal a strong linear regression fit between the individual data points of the non-normalized signals (R2 = 0.97). Excellent correlation between the CBVplasma and CBVrbc signals for the onset (0.96 ± 0.02), activation plateau (0.86 ± 0.16), and offset (0.97 ± 0.02) phases of the functional hyperemic response was observed (Figure 2B). Time courses of CBVplasma and CBVrbc signals from different cortical depths of S1 were compared (Figure 2C) to reveal excellent regional correlations (from upper to lower; 0.97 ± 0.15, 0.98 ± 0.01, 0.97 ± 0.17) between these signals (Figure 2D). Together these results suggest good dynamic and layer-specific correlations between MRI and LDF signals.
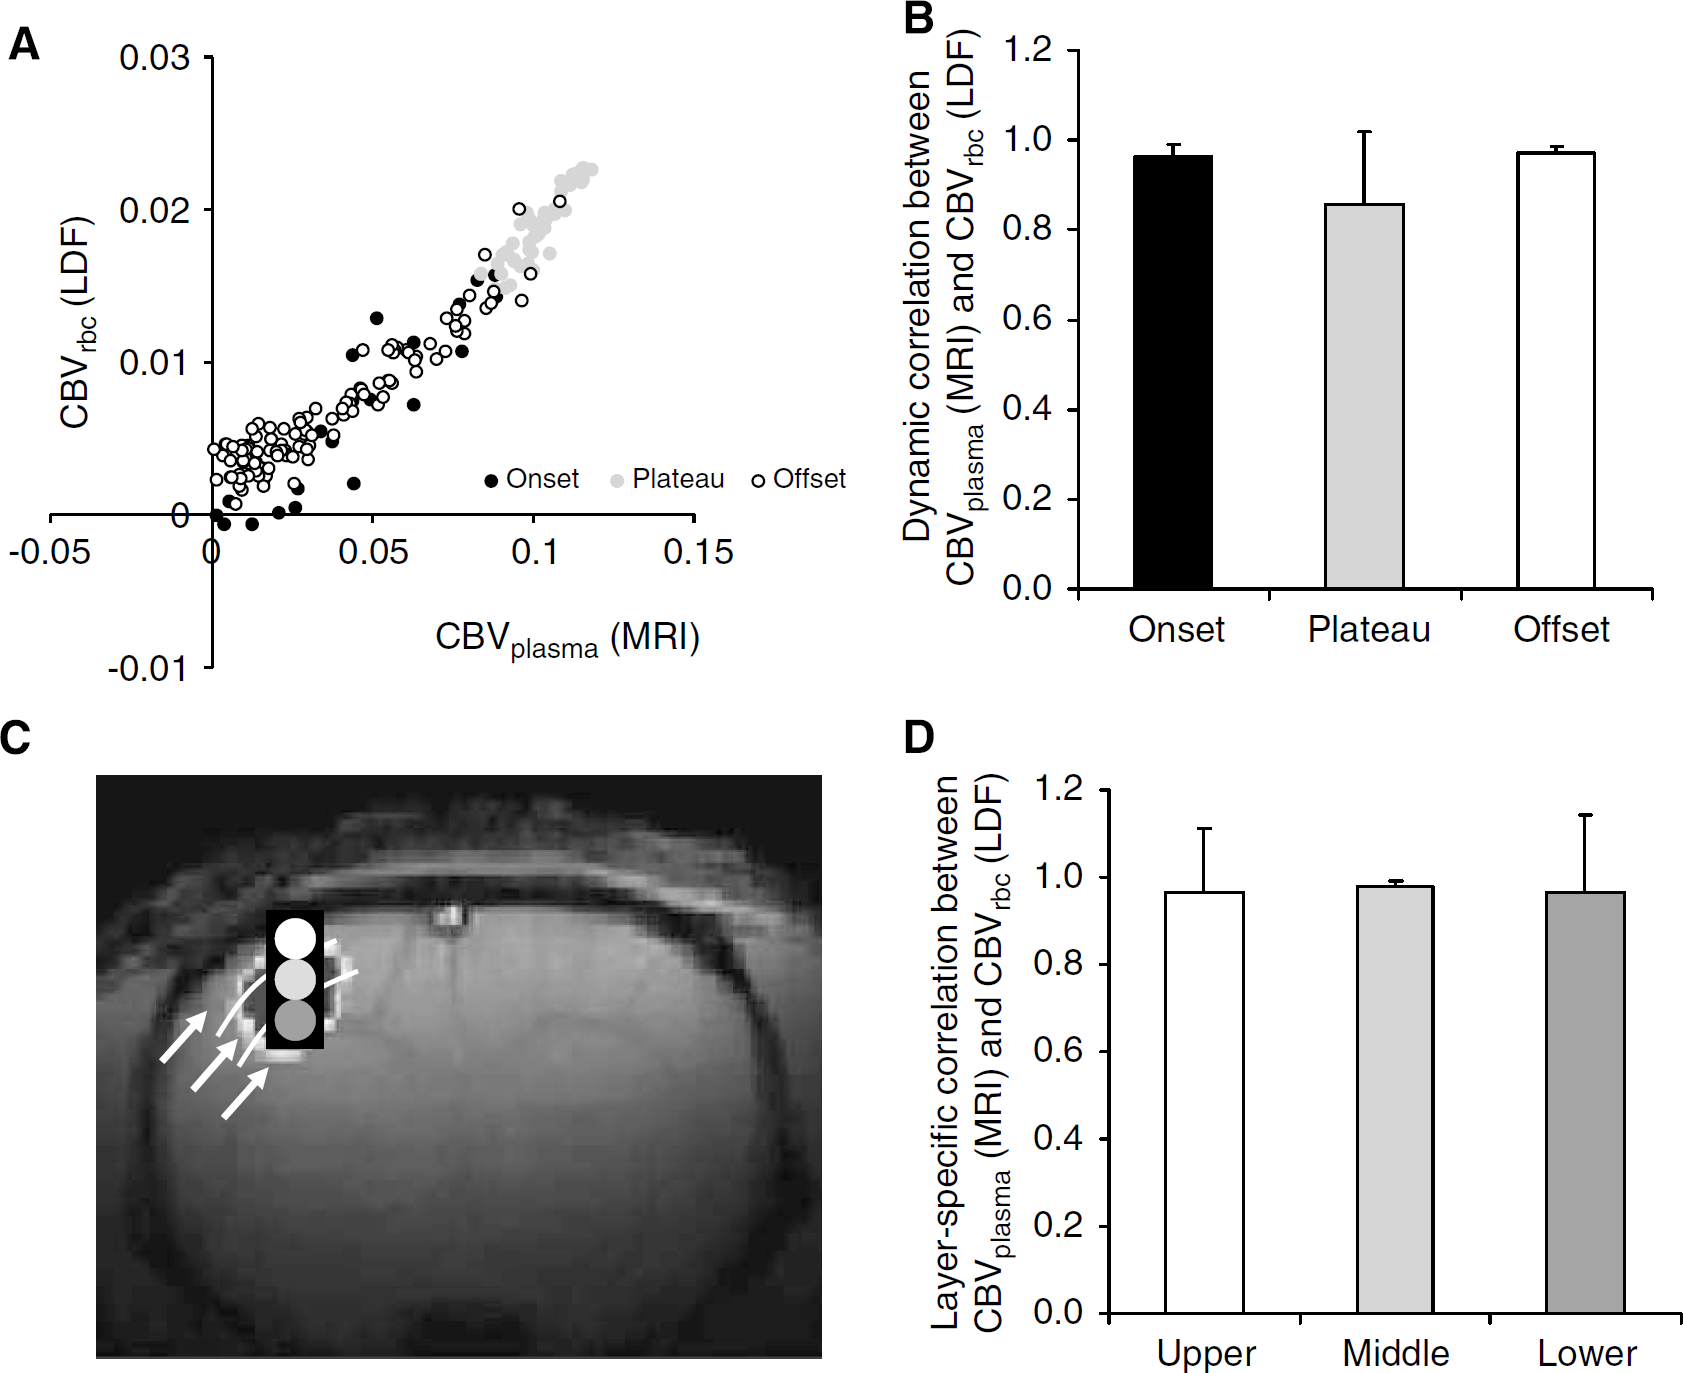
Correlations between CBV signals during forepaw stimulation. (
Discussion
CBV-weighted fMRI, using long half-life and plasma-borne intravascular contrast agents, has become an attractive alternative to BOLD-weighted fMRI in animal models (Keilholz et al, 2004; Kida et al, 2007; Lu et al, 2007). A central question that remains, however, is whether the MRI signal changes from such experiments demonstrate changes in total CBV (CBVtotal) because the technique is sensitive to plasma volume (CBVplasma). To measure CBV changes associated with red blood cells (CBVrbc), we used LDF that can be used to determine both red blood cell flux and backscatter simultaneously where the latter signal is related to volume changes (Barfod et al, 1997; He et al, 2007). Dynamic and layer-specific comparisons of CBVplasma and CBVrbc revealed excellent correlations during functional activation, suggesting that CBV measurements from either method could be used to reflect dynamic changes in CBVtotal. A limitation of our study is the exclusion of hypercapnia or hypocapnia challenges. CO2 inhalation has been used to study the dynamic range of vascular reactivity (Kannurpatti et al, 2003). However, we chose not to include this systemic perturbation because of concerns about the effects of oxygen binding on hemoglobin with CO2 (Popel, 1989).
MRI Measurements of Plasma Volume
The MRI-based CBVplasma measurement is based on a first-order assumption (Kennan et al, 1998) that changes in the transverse relaxation rate (i.e., T2 or T*2 for spin-echo or gradient-echo MRI, respectively) caused by stimulation is separable in terms of blood volume (caused by the exogenous contrast agent) and blood oxygenation (caused by the endogenous hemoglobin) changes. The contrast agent causes the MRI signal to decrease with stimulation, whereas the BOLD effect causes the MRI signal to increase. At high dose of the contrast agent, the magnetic susceptibility effect of the contrast agent can essentially overpower the BOLD effect, thereby leaving the remaining MRI signal to be primarily CBVplasma weighted (Lu et al, 2007). Since an underlying premise for interpreting magnetic susceptibility weighted MRI signal change is that cerebral hematocrit is unchanged (Kennan et al, 1998), CBVplasma changes are assumed to reflect changes in CBVtotal (Mandeville et al, 1998).
There are several studies in α-chloralose anesthetized rats that have demonstrated time courses of CBVplasma during forepaw stimulation at field strengths of 2.0/4.7 T (Mandeville et al, 1999), 7.0 T (Kida et al, 2007), and 9.4 T (Lu et al, 2007) that are nearly identical to our observations at 11.7 T (Figure 1C). Furthermore studies in isoflurane-anesthetized rats during forepaw stimulation (Shen et al, 2008), isoflurane-anesthetized cats during visual stimulation (Jin and Kim, 2008), and awake monkeys during visual stimulation (Leite et al, 2002) all showed similar time courses as in α-chloralose anesthetized rats during forepaw stimulation (i.e., a rapid onset phase followed by a very slowly increasing plateau phase and then a slow offset phase). These studies used different types of iron oxide superparamagnetic contrast agents with nm range particles that have partiality for blood plasma albumin (Jung and Jacobs, 1995). These results suggest that the time courses of CBVplasma are not significantly affected by sensory modality, anesthetic agent, nanocolloid agent, and/ or magnetic field dependent factors.
Optical Studies of Red Blood Cell Volume
The LDF-based CBVrbc measurement depends on the modified Lambert—Beer law (Kocsis et al, 2006) that accounts for light intensity changes in a scattering environment. Changes in the backscattered signal depends on concentration of the chromophores (i.e., hemoglobin in red blood cells) as well as the scattering loss within tissue. As the LDF technique uses light-source of only one wavelength, it is important to measure the backscattered signal close to an isosbestic point of hemoglobin (e.g., 805 nm) where the absorption coefficients of oxygenated and deoxygenated hemoglobin are approximately the same, and therefore, the signal is only influenced by the changes in concentration, not the oxygenated state.
The LDF-based CBVrbc recording cannot be used for absolute measurements because tissue scattering coefficients are difficult to measure (Duncan et al, 1996; Nishimura and Tamura, 2005), and moreover, the backscattered signal intensity depends on characterization of the LDF device (Barfod et al, 1997). A limitation of our study, however, could be that small vessels may have been damaged as a consequence of inserting the LDF probe into brain tissue for the layer-specific measurements. Because good agreement was found between the averaged LDF signals from the different layers and data from surface LDF probe over a thinned skull (PH unpublished results), we believe that normal flow responses were observed by the LDF probes.
Optical studies have examined dynamics of CBVrbc in α-chloralose anesthetized rats. Matsuura et al (1999) used LDF (780 nm) during 5 Hz hindpaw stimulation to reveal CBVrbc dynamics that exhibited a rapid onset after start of stimulation, a pseudo plateau state during stimulation, and slow offset after stimulation. The continuous wavelength near infrared spectroscopy method (Kocsis et al, 2006) can measure the relative change of oxygenated and deoxygenated hemoglobin concentration non-invasively in the brain, where the total hemoglobin concentration is related to CBVrbc. Recently Culver et al (2005) applied near infrared spectroscopy in a topographic format during 3 Hz forepaw stimulation to obtain relative changes in CBVrbc. Both of these optical results are in good accord with our LDF observations (Figure 1D).
Microcirculation and Volume Hematocrit
Dynamic vascular behavior is heterogeneous, spanning from arterioles or venules to capillaries. Therefore spatial resolution of the methods used to measure different vascular parameters may affect dynamic behavior of the signals. However with quite different spatial resolutions of MRI and LDF signals, where neither technique had appropriate spatial resolution to resolve the dynamic behavior at the level of individual blood vessels, we observed comparable transients of blood plasma and red blood cell compartments, thereby suggesting that the total blood volume follows similar kinetics. If the microvasculature network experiences negligible counter flow with steady-state mass balance during the span of a typical experimental run, then these results suggest that volume hematocrit does not vary significantly during prolonged activation. The studies discussed above show that our results are generally consistent with prior observations using both MRI and optical methods. Nevertheless there is potential that with the spatial resolutions of MRI and LDF measurements used in this study, and those mentioned above, could have averaged out heterogeneous microscopic mismatch, if any, between blood plasma and red blood cell compartments. Much higher spatial resolution may be needed for differentiating between the different branches in the microvasculature (Herman and Eke, 2006; Park et al, 2008). But data comparison across large spatial dimensions could provide a more inclusive perception about the gradation of blood circulation in vivo.
There are several methods that measure blood plasma and red blood cell compartments at the level of arterioles, venules, and capillaries. Classical autoradiographic volume measurements rely on radioactively labeled red blood cells and serum albumin (Bereczki et al, 1992; Hans et al, 1993; Wei et al, 1993). However the results reflect the state of blood circulation just moments before tissue freezing. Microscopy-based optical techniques have been used to measure transient behavior of microvasculature for a range of perturbations (Rovainen et al, 1993; Cox et al, 1993; Kleinfeld et al, 1998). But these techniques are limited to detection just below the pia mater. Future studies, utilizing these or some combinations of these techniques, may reveal the interplay of volumes as well as velocities between blood plasma and red blood cell compartments during functional activation, specifically given that velocity of red blood cell changes are quite dominant during activation-flow coupling (Detre et al, 1998; Matsuura et al, 1999). An important consideration, however, in these future studies would be the involvement of the Fahraeus (1929) effect itself on BOLD contrast as the spatiotemporal resolution of the fMRI techniques improve (Kida et al, 2007; Shen et al, 2008).
Footnotes
Acknowledgements
The authors thank scientists and engineers at MRRC (mrrc.yale.edu), and QNMR (qnmr.yale.edu). This work was supported by grants from National Institutes of Health (R01 MH-067528, R01 DC-003710, P30 NS-52519).