
Abstract
The Deoxyglucose Method in the Ferret Brain. II. Glucose Utilization Images and Normal Values
C. Redies, M. Diksic, and Y. L. Yamamoto
Cone Laboratory, Montreal Neurological Institute, and Department of Neurology and Neurosurgery, McGill University, Montreal, Quebec, Canada
(Article appeared in J Cereb Blood Flow 9:43–52 (1989))
The captions for Tables 1 and 2 that appeared on pages 44 and 45 were inadvertently switched. They appear correctly below.
Transfer rate constants for 2-deoxyglucose in the brain of the anesthetized ferret Regional values are estimates ± SEM. Volume of tracer distribution in brain, K1*/(k2* + k3*). Glucose utilization (calculated according to Eq. 1).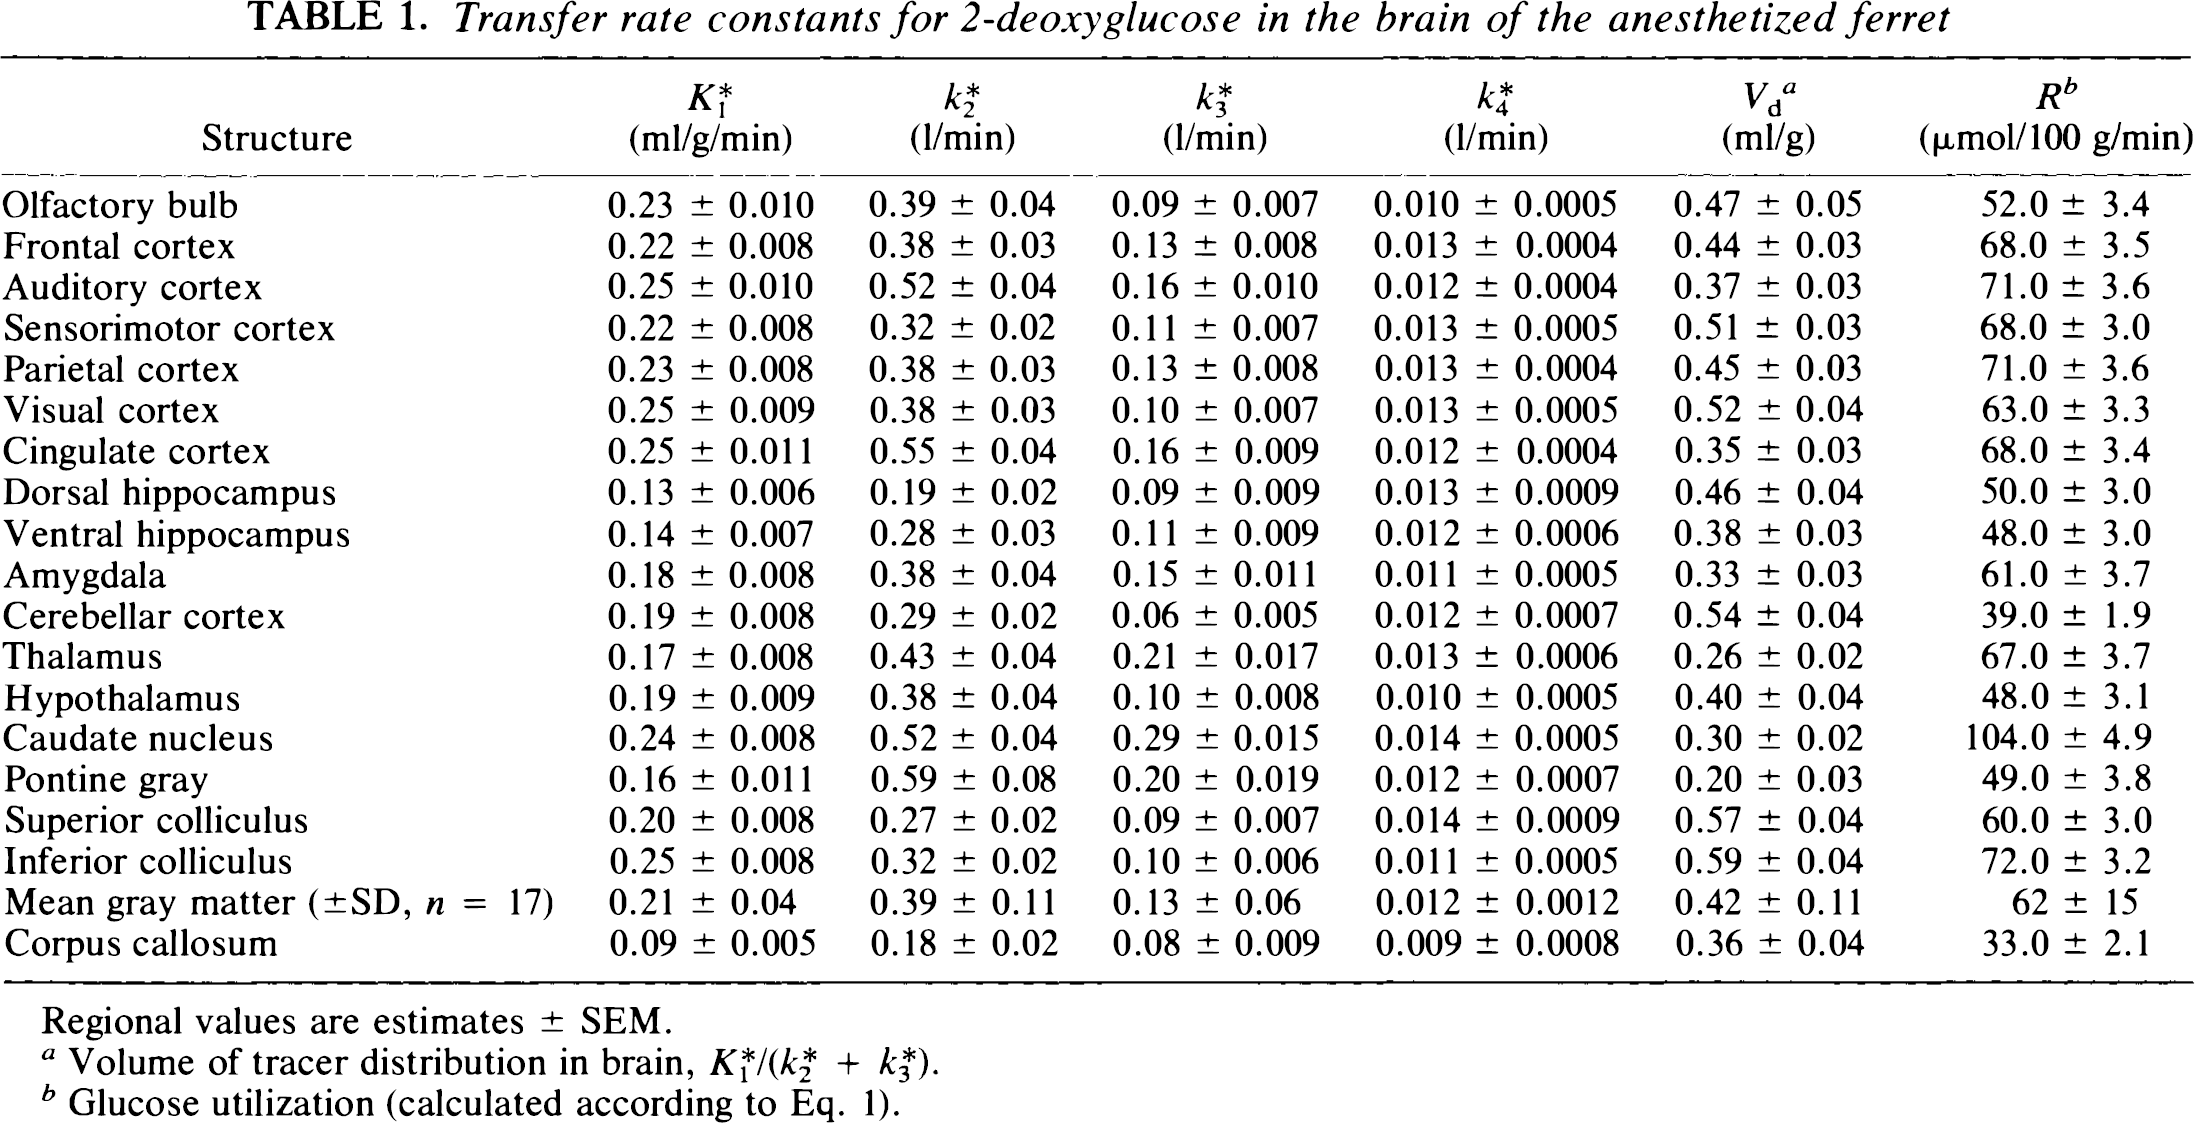
Structure
K1* (ml/g/min)
k2* (1/min)
k3* (1/min)
k4* (1/min)
Vd
a
(ml/g)
R
b
(μmol/100 g/min)
Olfactory bulb
0.23 ± 0.010
0.39 ± 0.04
0.09 ± 0.007
0.010 ± 0.0005
0.47 ± 0.05
52.0 ± 3.4
Frontal cortex
0.22 ± 0.008
0.38 ± 0.03
0.13 ± 0.008
0.013 ± 0.0004
0.44 ± 0.03
68.0 ± 3.5
Auditory cortex
0.25 ± 0.010
0.52 ± 0.04
0.16 ± 0.010
0.012 ± 0.0004
0.37 ± 0.03
71.0 ± 3.6
Sensorimotor cortex
0.22 ± 0.008
0.32 ± 0.02
0.11 ± 0.007
0.013 ± 0.0005
0.51 ± 0.03
68.0 ± 3.0
Parietal cortex
0.23 ± 0.008
0.38 ± 0.03
0.13 ± 0.008
0.013 ± 0.0004
0.45 ± 0.03
71.0 ± 3.6
Visual cortex
0.25 ± 0.009
0.38 ± 0.03
0.10 ± 0.007
0.013 ± 0.0005
0.52 ± 0.04
63.0 ± 3.3
Cingulate cortex
0.25 ± 0.011
0.55 ± 0.04
0.16 ± 0.009
0.012 ± 0.0004
0.35 ± 0.03
68.0 ± 3.4
Dorsal hippocampus
0.13 ± 0.006
0.19 ± 0.02
0.09 ± 0.009
0.013 ± 0.0009
0.46 ± 0.04
50.0 ±3.0
Ventral hippocampus
0.14 ± 0.007
0.28 ± 0.03
0.11 ± 0.009
0.012 ± 0.0006
0.38 ± 0.03
48.0 ± 3.0
Amygdala
0.18 ± 0.008
0.38 ± 0.04
0.15 ± 0.011
0.011 ± 0.0005
0.33 ± 0.03
61.0 ± 3.7
Cerebellar cortex
0.19 ± 0.008
0.29 ± 0.02
0.06 ± 0.005
0.012 ± 0.0007
0.54 ± 0.04
39.0 ± 1.9
Thalamus
0.17 ±0.008
0.43 ± 0.04
0.21 ± 0.017
0.013 ± 0.0006
0.26 ± 0.02
67.0 ± 3.7
Hypothalamus
0.19 ± 0.009
0.38 ± 0.04
0.10 ± 0.008
0.010 ± 0.0005
0.40 ± 0.04
48.0 ± 3.1
Caudate nucleus
0.24 ± 0.008
0.52 ± 0.04
0.29 ± 0.015
0.014 ± 0.0005
0.30 ± 0.02
104.0 ± 4.9
Pontine gray
0.16 ± 0.011
0.59 ± 0.08
0.20 ± 0.019
0.012 ± 0.0007
0.20 ± 0.03
49.0 ± 3.8
Superior colliculus
0.20 ± 0.008
0.27 ± 0.02
0.09 ± 0.007
0.014 ± 0.0009
0.57 ± 0.04
60.0 ±3.0
Inferior colliculus
0.25 ± 0.008
0.32 ± 0.02
0.10 ± 0.006
0.011 ± 0.0005
0.59 ± 0.04
72.0 ± 3.2
Mean gray matter (±SD, n = 17)
0.21 ± 0.04
0.39 ± 0.11
0.13 ± 0.06
0.012 ± 0.0012
0.42 ±0.11
62 ± 15
Corpus callosum
0.09 ± 0.005
0.18 ± 0.02
0.08 ± 0.009
0.009 ± 0.0008
0.36 ± 0.04
33.0 ± 2.1
Transfer rate constants for fluorodeoxyglucose in the brain of the anesthetized ferret Regional values are estimates ± SEM. Volume of tracer distribution in brain, K1*/(K2* + k3*). Glucose utilization (calculated according to Eq. 1).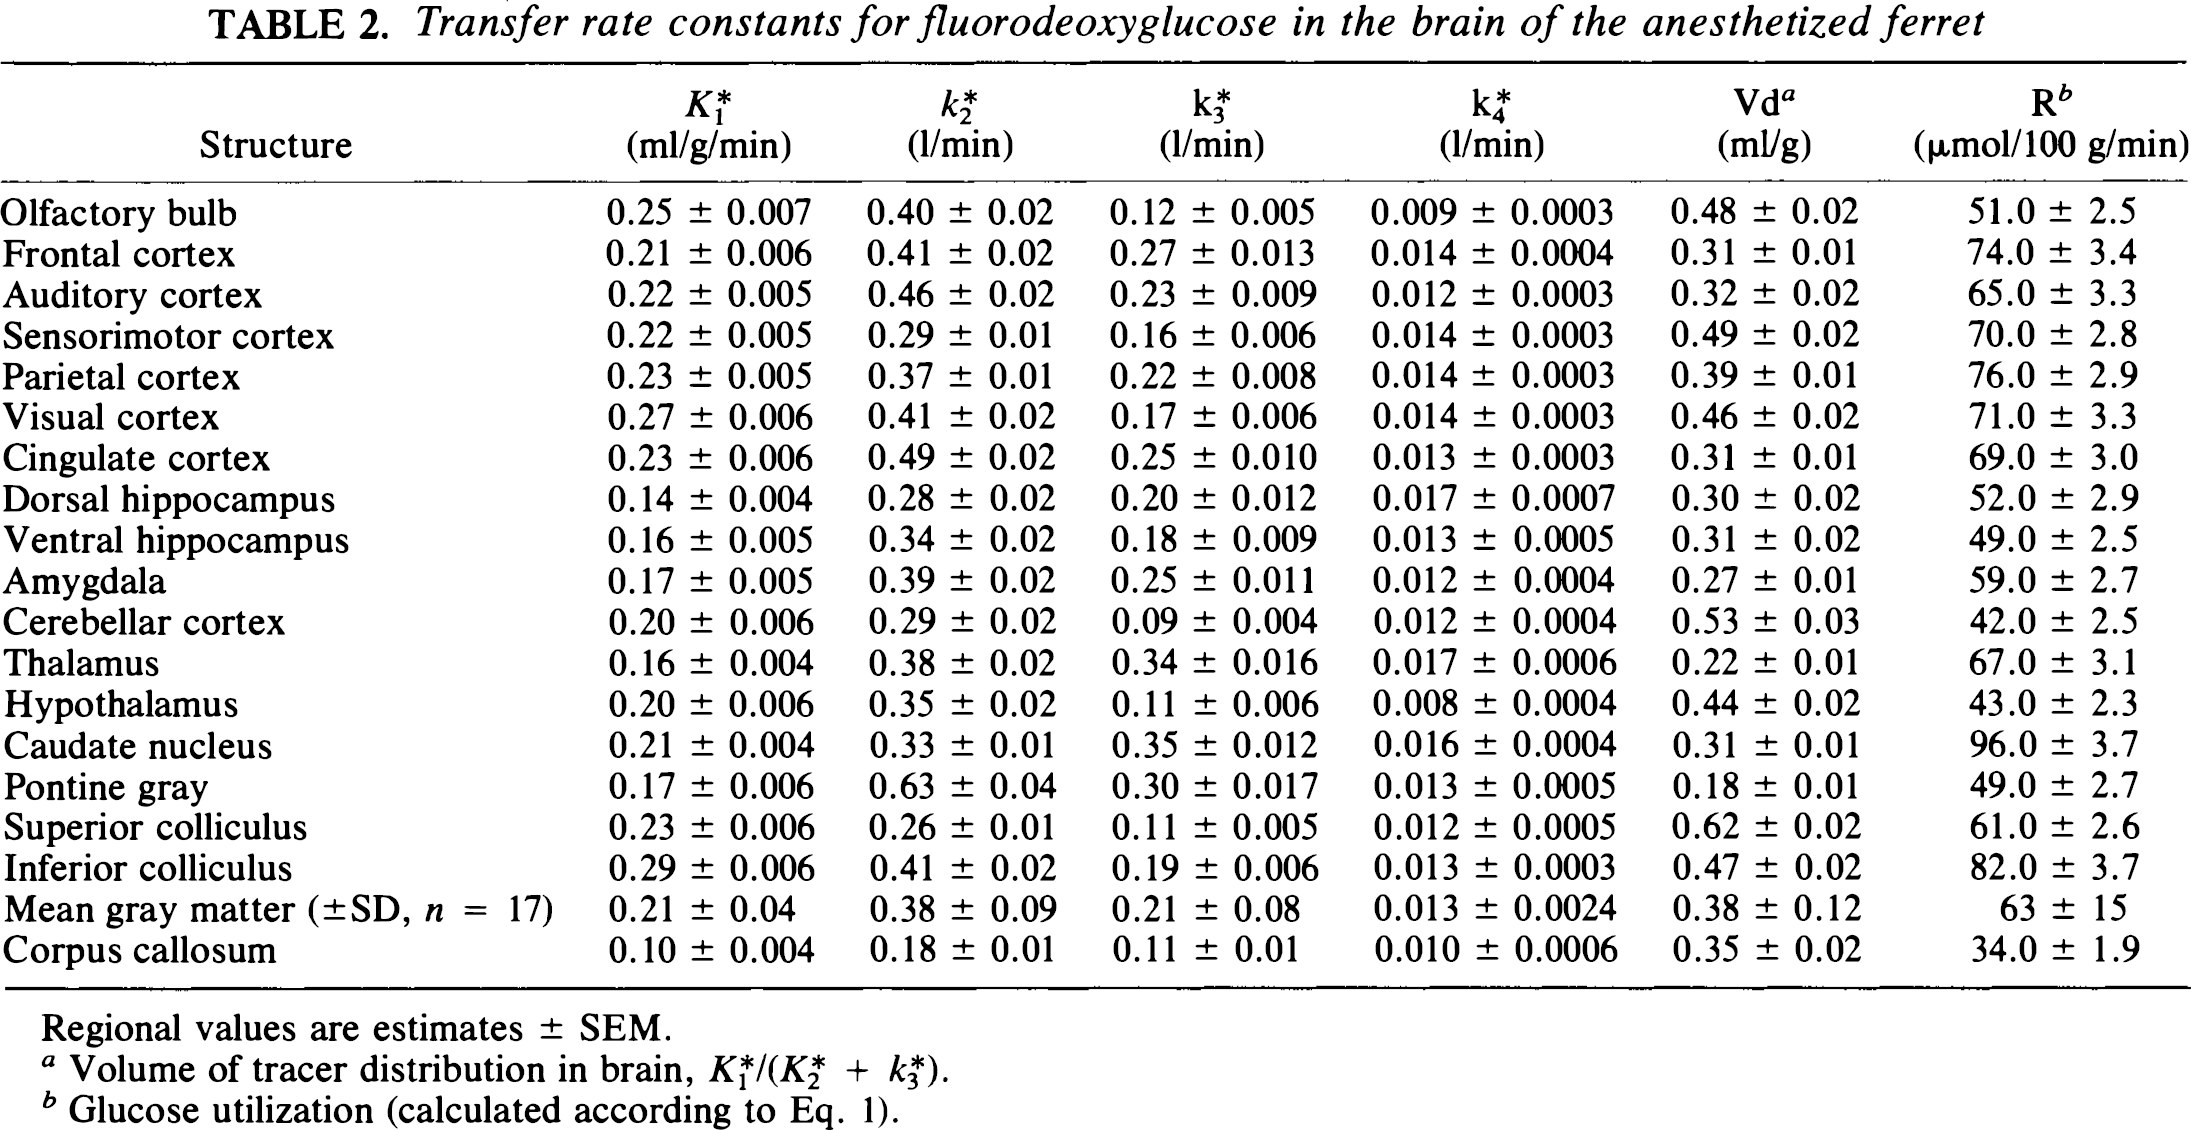
Structure
K1*(ml/g/min)
k2* (1/min)
k3* (1/min)
k4* (1/min)
Vd
a
(ml/g)
R
b
(μmol/100 g/min)
Olfactory bulb
0.25 ± 0.007
0.40 ± 0.02
0.12 ± 0.005
0.009 ± 0.0003
0.48 ± 0.02
51.0 ± 2.5
Frontal cortex
0.21 ± 0.006
0.41 ± 0.02
0.27 ± 0.013
0.014 ± 0.0004
0.31 ± 0.01
74.0 ±3.4
Auditory cortex
0.22 ± 0.005
0.46 ± 0.02
0.23 ± 0.009
0.012 ± 0.0003
0.32 ± 0.02
65.0 ± 3.3
Sensorimotor cortex
0.22 ± 0.005
0.29 ± 0.01
0.16 ± 0.006
0.014 ± 0.0003
0.49 ± 0.02
70.0 ± 2.8
Parietal cortex
0.23 ± 0.005
0.37 ± 0.01
0.22 ± 0.008
0.014 ± 0.0003
0.39 ± 0.01
76.0 ± 2.9
Visual cortex
0.27 ± 0.006
0.41 ± 0.02
0.17 ± 0.006
0.014 ± 0.0003
0.46 ± 0.02
71.0 ± 3.3
Cingulate cortex
0.23 ± 0.006
0.49 ± 0.02
0.25 ± 0.010
0.013 ± 0.0003
0.31 ± 0.01
69.0 ± 3.0
Dorsal hippocampus
0.14 ± 0.004
0.28 ± 0.02
0.20 ± 0.012
0.017 ± 0.0007
0.30 ± 0.02
52.0 ± 2.9
Ventral hippocampus
0.16 ± 0.005
0.34 ± 0.02
0.18 ± 0.009
0.013 ± 0.0005
0.31 ± 0.02
49.0 ± 2.5
Amygdala
0.17 ± 0.005
0.39 ± 0.02
0.25 ± 0.011
0.012 ± 0.0004
0.27 ± 0.01
59.0 ± 2.7
Cerebellar cortex
0.20 ± 0.006
0.29 ± 0.02
0.09 ± 0.004
0.012 ± 0.0004
0.53 ± 0.03
42.0 ± 2.5
Thalamus
0.16 ± 0.004
0.38 ± 0.02
0.34 ± 0.016
0.017 ± 0.0006
0.22 ± 0.01
67.0 ± 3.1
Hypothalamus
0.20 ± 0.006
0.35 ± 0.02
0.11 ± 0.006
0.008 ± 0.0004
0.44 ± 0.02
43.0 ± 2.3
Caudate nucleus
0.21 ± 0.004
0.33 ± 0.01
0.35 ± 0.012
0.016 ± 0.0004
0.31 ± 0.01
96.0 ± 3.7
Pontine gray
0.17 ± 0.006
0.63 ± 0.04
0.30 ± 0.017
0.013 ± 0.0005
0.18 ± 0.01
49.0 ± 2.7
Superior colliculus
0.23 ± 0.006
0.26 ± 0.01
0.11 ± 0.005
0.012 ± 0.0005
0.62 ± 0.02
61.0 ± 2.6
Inferior colliculus
0.29 ± 0.006
0.41 ± 0.02
0.19 ± 0.006
0.013 ± 0.0003
0.47 ± 0.02
82.0 ± 3.7
Mean gray matter (±SD, n = 17)
0.21 ± 0.04
0.38 ± 0.09
0.21 ± 0.08
0.013 ± 0.0024
0.38 ± 0.12
63 ± 15
Corpus callosum
0.10 ± 0.004
0.18 ± 0.01
0.11 ± 0.01
0.010 ± 0.0006
0.35 ± 0.02
34.0 ± 1.9