
Abstract
Microarray technology is a multiplex analytical technique for the detection of many different analytes in a mixture of biomolecules. The detection limits for each of the analytes for which the array is designed depend on a multiplicity of reaction parameters, the array itself, and profoundly on the label and detection technology employed. Significant improvements in assay sensitivity have been achieved by optimizing all steps that affect the generation of signal and noise. Nanoparticle technology brings a new dimension to this technology by providing not only higher sensitivity but also improved specificity for hybridization-based microarray assay systems.
Introduction
Microarray technology began some 15 years ago as a new tool for the rapid sequencing of DNA1-3 but has since emerged as a general high-throughput technology for the analysis of cellular or viral functions, ranging from the genetic and expression analysis of their genomes to the analysis of content and composition of their proteins, carbohydrates, lipids, or metabolic products. An abundant amount of literature on each of these topics is now available and has been summarized in several books.4–10 What is shared by these different applications is the basic setup of the analytic technique, including arrayed biomolecules that serve as capture reagents for a mixture of analytes, which are either labeled directly or indirectly via a detection reagent. The amount of captured analytes at each address of the microarray is analyzed by instrumentation that varies with the type of label and the form of the array.
Though most frequently the analytes are labeled with fluorophors, a plethora of other labeling strategies11–15 as well as label-free technologies16–18 have been employed. Consequently, the detection modes vary from measuring photons, electrons, gravity, density, or other physico-chemical changes imposed on the microarray by the binding of the analyte, or the analyte detector moiety complex. In addition, the array itself may have very different forms that affect the instrumentation. Especially for large arrays, the typical configuration is a 2-D matrix of capture elements affixed on a glass microscope slide with a chemically functionalized surface. Driven in part by intellectual property issues, other configurations have emerged that include 3-D or linear arrays, and more commonly, “liquid arrays” consisting in beads or carrier tags that have a unique identifier.19–21
Definition of Assay Sensitivity and Approaches for Improvements
In spite of such diversity in analytical approaches, microarray assays are still based on the key steps common to most diagnostic tests, but the array itself complicates the detection system, has significant effects on the assay kinetics, and requires complicated manufacturing technology. In addition to array manufacture, all assay steps have to be optimized to provide for a sensitive assay system, making each step a key target for improvements in the ongoing evolution of assay sensitivity.
While the sensitivity (S) is typically defined as a system's responsiveness to an increase in analyte concentration, i.e., the slope of the dose-response curve (Fig. 1), diagnostic assay developers often prefer to focus on the limit of detection, i.e., the smallest amount of analyte that results in a detectable signal above background. For this definition to become meaningful, one needs to know the noise (N) of the system that causes fluctuations around the mean background. A good working definition for the detection limit is the amount of analyte that generates a signal/noise ratio of 2,
22
whereby noise is defined as the standard deviation of the background, and the raw signal has been corrected for the mean background.
Typical dose response of a diagnostic test. Note that the exact detection limit is a function of the noise of the background. The dashed lines indicate the mean of the background ± stdev. The wavy line indicates the noise of the background.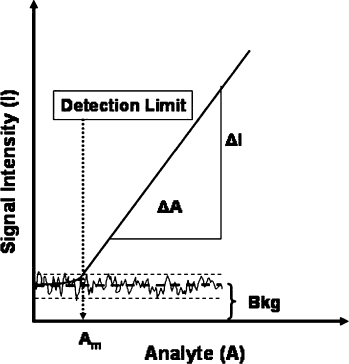
There is also noise in the signal, of course, but that is mostly a function of sample preparation and labeling. More detailed descriptions of signal and noise analysis are found elsewhere.23, 24 Thus, for a given sample that has been readied for the analysis, assay sensitivity and detection limit are basically a function of signal intensity and background, and since maximizing the former and minimizing the latter are equally valid approaches to increasing sensitivity, it is useful to ask how the various components of a microarray assay system contribute to either of these. For simplicity's sake, we can break down the microarray assay system into four key components: (1) the sample, (2) the array and its support surface, (3) the assay configuration by which the sample is contacted with the array, and (4) the instrument system for reading and analyzing the result.
The capture probes (arrayed biomolecules) can vary from DNA, RNA, antibodies, receptors, lipid-bound proteins, or small haptens, and their appropriate attachment to the array surface remains an art that continues to be the subject of much research and development. Two concepts that deserve special mention are the “biological complexity” (C) and spot dimensions. For nucleic acids, C describes the number of non-repeat nucleotides, which can vary from fewer than 100 for oligos to 100,000 for large clones (e.g., BAC, PAC, or P1). Reduction in the complexity of the capture probe causes a concomitant reduction in signal intensity, which can even be felt in expression analysis when going from cDNA (C ∼500-1000) to oligo arrays (C=30-75),
32
although it has been reported that there is no significant loss of sensitivity when comparing either a 50-mer oligo array
33
or a 70-mer oligo array
34
to a PCR-generated array (C
Most likely, the reason is that the average length of the target DNA or RNA molecules is on the order of 500 to 2000 nucleotides; therefore, a capture spot that has a complexity of, say, 100,000 nucleotides could theoretically capture on the order of 100 times as many target molecules as a spot that has a complexity of 1000. This turns out not to be true, because the concentration of each individual capture sequence is also reduced by a factor of 100 (assuming equal capture probe density), reducing the hybridization kinetics for each type of target. Of course, all this assumes that the target DNA actually contains all sequences represented by the capture spot, i.e., it has to have a complexity that is equally large or larger. Once the complexity of the capture probes is equal or lower than the average length of the target molecules, then there should be no difference in the number of molecules that can be captured by a spot that contains a homogeneous 75-mer capture probe versus a 300-mer probe. Any differences in capture efficiency that are observed in this case, as cited above, are likely due to differences in hybridization kinetics as a function of probe size rather than complexity.
Most promising for signal enhancements are recently developed methodologies for reducing the spot diameter from the micron to the nanometer range.35, 36 Since capture of a limiting number of targets onto a smaller spot should increase the mean signal intensity in a square function, this should provide for a major boost of sensitivity. Of course, this can only be realized in an appropriate assay configuration that includes a miniaturized binding reaction and a detection system capable of reading signals with nanometer resolution.
Once the diffusion limitations are overcome, a variety of other factors come into play, such as the size, density, and sequence/structure of the capture probes (as mentioned above) and signal probes (if used); the exact composition of the hybridization buffer; and most importantly, the biological complexity of the sample. In contrast to the above-described effect that complexity has on the capture probe, the reverse effect (i.e., loss in signal intensity) will result if the complexity of the sample exceeds that of the capture probe by several logs. For example, the hybridization kinetics for a pure oligo or cDNA target are significantly faster than those for the same target at equal concentration when it is present in a mixture of total mammalian RNA or DNA. This fact is sometimes overlooked when measuring detection limits with pure synthetic target DNAs.
More recently, several strategies have focused on replacing fluororescence with more powerful label systems. Since the quantum yield (the efficiency of converting adsorbed energy into photons) of the typically used fluorophors is already fairly high, these strategies have focused on increasing the extinction coefficient, i.e., on making larger molecules or molecular aggregates that adsorb more light. Examples include dendrimers, 46 quantum dots,47, 48 micron-sized upcon-verting phosphors, 49 or fluorescent latex particles. 50
Of special interest here are very powerful nanometer-size labels based on metallic colloids that have many advantages over fluorophors. While gold particles have been used as indirect labels in immuno-chemistry and in situ hybridization for many years,51, 52 the development of covalently linked DNA oligo-gold nanoparticle probe conjugates and their use as probes for DNA-based assays was first reported by Mirkin and co-workers. 53 These probes possess several unique physico-chemical properties that provide significant advances for 2-D array- as well as liquid array-based DNA diagnostics.
First, the gold nanoparticle portion acts as a catalyst in autometallography (silver amplification), which allows simple and highly sensitive detection by a variety of methods, including Rayleigh scatter, 54 electrical detection, 11 and surface-enhanced Raman spectroscopy. 55 Silver amplification is particularly useful for particles that are only a few nanometers in diameter, while larger particles (>40 nm) have a sufficiently large extinction coefficient that their scattered light can be detected efficiently without the benefit of enlarging the particle size through silver deposition. In this case, the color of the scattered light is a function of the particle size, 56 allowing the design of multiple color labeling systems for array applications. 57 Even when used in an indirect labeling format, such labels were demonstrated to be at least 10 times more sensitive than fluorescence in expression array applications. 58
The second and most significant properties of DNA-modified nanoparticle probes are raised melting temperatures (Tm) and extremely sharp melting transitions compared to oligos of identical sequence that are only labeled with fluorophors. 54 Higher Tms allow for higher stringency during the hybridization, which results in unmatched hybridization selectivity. Consequently, nanoparticle probe technology has opened the possibility for array-based DNA diagnostics that does not require PCR or any other type of target amplification. Using unamplified bacterial genomic DNA, the detection of methicillin resistance in Staphylococci was recently demonstrated. 59 More importantly, the detection of specific single nucleotide polymorphisms (SNPs) in total human DNA without complexity reduction appears equally feasible through application of this technology.60, 61
Conclusions
Considering these advances in array manufacture, assay development, miniaturization, and microfluidics, combined with nanoparticle-based ultrahigh sensitivity and specificity, the development of fully automated and even hand-held systems for genotyping and expression analysis at the point of care should not be far off. The last hurdle, undoubtedly, is the simple, robust, and reproducible preparation of sample and its interface with the assay and detection system. Automation of this step may also reduce the significant variability that is associated with manual sample preparations.