
Abstract
Introduction
Despite increasing health effects of arthropod bites and associated costs, research on their frequency is limited, especially at the population level. The aim of this study was to estimate the prevalence, correlates, and recent trends in visits to US emergency departments related to arthropod bites and stings.
Methods
The prevalence of arthropod bites, including information regarding location of the bite, was calculated for years 2010 through 2014 using data from the Healthcare Cost and Utilization Project Nationwide Emergency Department Sample. Sex- and age-stratified multivariate logistic regression analyses were conducted with “arthropod bite” as the dependent variable and patient and hospital characteristics as independent variables.
Results
Overall, there were significant increases in bites over the study period with higher rates of bites in the summer months (June–August), especially among children. Individuals who seek treatment for arthropod bites in the emergency department are more likely to reside in zip codes with lower median household income and to be without insurance coverage or with Medicaid rather than private insurance. The cost of care related to arthropod bites increased approximately 40% over the study period.
Conclusions
These results provide updated surveillance on the prevalence and correlates of arthropod bites and stings in the US population.
Introduction
Adverse encounters with arthropod bites and stings can lead to pain and discomfort, severe tissue damage, and in some cases death.1,2 In the United States, potentially life-threatening allergic reactions from insect stings occur in 3% of adults, and insect sting anaphylaxis results in approximately 100 deaths per year. 3 Arthropods are also major vectors of infectious diseases,2,4 and the incidence of illness contracted from mosquitoes and fleas has increased threefold in recent years. 5 Moreover, new pathogens and vector-borne illnesses are being identified. 6 –8 Beyond these important health considerations, negative encounters with arthropods can manifest in socioenvironmental costs such as fear of the outdoors and unnecessary destruction of arthropod habitat.
Despite the health impact of arthropod bites and stings, little research has accrued, especially at the population level. Using the electronic injury surveillance system-all injury program data from 2001 through 2010, between 750,000 and 1 million individuals were seen annually in emergency departments (EDs) for noncanine bites and stings, with the highest rates observed among children. 9 Unsurprisingly, bees accounted for the majority of arthropod-related injuries, and most stings and bites occurred in the summer months (June–August) and on the extremities (arms and legs). Research regarding scorpion envenomation in the United States typically focuses on individual states and the bark scorpion, specifically. 10 Results of one of the few studies examining the prevalence of scorpion exposures across the United States based on 2005–2015 data from the National Poison Data System revealed an average of 16,855 exposures per year. 10 It appears that arthropod-related bites and stings, especially scorpion stings, occur more frequently in southern states.11,12 Recent prevalence rates on overall and specific types of arthropod bites and stings are absent from the literature, and patient correlates including age, sex, insurance coverage, and hospital region are also unknown.
Although bites and stings from arthropods are ubiquitous, there remains a dearth of research on arthropod bites and stings in the general population. Most studies are cases or regional circumscribed samples.13,14 The admit study provides updated surveillance information regarding recent trends in arthropod bites and stings and their correlates based on hospital ED admissions data. Given the lack of cost estimates related to ED admissions for arthropod bites and stings, we also estimate the charges associated with these phenomena. Arthropod bites and stings affect the lives of millions of people. As such, ongoing surveillance studies of arthropod bites and stings have practical relevance because they direct attention to the problem and provide an empirical platform from which educational awareness training and medical care policy decision-making can proceed.
Methods
The admit study is a retrospective analysis of the 2010–2014 Nationwide Emergency Department Sample (NEDS) from the Healthcare Cost and Utilization Project (HCUP), sponsored by the US Department of Health and Human Services Agency for Healthcare Research and Quality. The NEDS is considered a “limited data set” under the health insurance portability and accountability act (HIPAA) privacy rule and contains no direct patient identifiers. Under HIPAA guidelines, review by an institutional review board is not required for use of HCUP data. 15
The NEDS sampling frame is limited to hospital-owned EDs in the 34 states and District of Columbia for which HCUP ED data are available through the state inpatient databases (patients initially seen in the ED and admitted to the same hospital) and state ED databases (ED visits that are not admitted to the same hospital). Sample stratification was based on geographic region, trauma center designation, urban–rural location of the hospital, teaching hospitals, and hospital ownership. NEDS is the largest all-payer ED database in the United States, providing national estimates of hospital-based ED visits with data on approximately 31 million discharges each year. NEDS data are compiled from 953 hospitals located in 34 participating states (AR, AZ, CA, CT, DC, FL, GA, HI, IA, IL, IN, KS, KY, MA, MD, ME, MN, MO, MT, NC, ND, NE, NJ, NV, NY, OH, RI, SC, SD, TN, UT, VT, WI, and WY), approximating a 20% stratified sample of US hospital-owned EDs.
ARTHROPOD BITE
Nonvenomous arthropod
For 2010 through 2014, ED discharges with the international classification of diseases, 9th revision, clinical modification (ICD-9-CM) external cause of injury code (ECODE1–ECODE4) “bite of nonvenomous arthropod” (E906.4) were coded as “nonvenomous bite.” Any nonvenomous arthropod bites, regardless of type of arthropod, are included under the code. Type of arthropod is only specified in the ICD-9-CM codes if the bite caused poisoning and toxic reactions.
Venomous arthropod
Discharges with ICD-9-CM ECODE1–ECODE4 “venomous spiders causing poisoning and toxic reactions” (E905.1) were coded as “spider.” Discharges with ECODE 905.2 for “scorpion sting causing poisoning and toxic reactions” were coded as “scorpion” and those with ECODE 905.3 for “sting of hornets, wasps, and bees causing poisoning and toxic reactions” were coded as “hornet, wasp, bee.” Discharges with ECODE 905.5 “other venomous arthropods causing poisoning and toxic reactions” were coded as “other venomous.”
Arthropod
Nonvenomous and all venomous bites and stings from the specific types of arthropod (spider, scorpion, hornets, wasps, and bees) were combined into 1 variable, “arthropod,” for analysis of trends in overall arthropod bites from 2010 through 2014.
HOSPITAL AND PATIENT COVARIATES
Patient characteristics included sex, age (categorized by youth [≤17 y] and adults [≥18 y]), median household socioeconomic status in quartiles designated by the patient’s zip code, primary payer (Medicare; Medicaid; private insurance; self-pay; no charge; and other, including worker’s compensation, Civilian Health and Medical Program of the Uniformed Services, Civilian Health and Medical Program of the Department of Veterans Affairs, Title V, and other government programs), month of admission divided into 4 categories (December, January, February; March, April, May; June, July, August; September, October, November), and total charges (in USD) for ED care. Region of the hospital (northeast, midwest, south, and west) was also included.
STATISTICAL ANALYSIS
Arthropod bite cases were identified for 2010 through 2014. A 10% weighted sample of nonarthropod bite cases from each year was used for comparison purposes. The prevalence estimates of venomous spider, hornet/wasp/bee, scorpion, and other venomous and nonvenomous arthropod bites as well as total arthropod bites were calculated for 2010 through 2014. The compound annual growth rate (CAGR) was calculated to estimate the trend in total arthropod bites from 2010 through 2014 and for comparisons with other diagnostic trends.

Sex- and age-stratified multivariate logistic regression analyses were conducted with “arthropod bite” as the dependent variable and patient and hospital region as independent variables. Analyses accounted for the cluster sampling design specific to the NEDS using the hospital and discharge weight variables provided by HCUP with Stata’s svy commands.
Results
Approximately 860,000 individuals visited US EDs for arthropod bites or stings from 2010 to 2014. Figure 1 displays trends in the prevalence of arthropod bites and stings for 2010 to 2014 by type, including spider, hornet/wasp/bee, and scorpion. Hornet/Wasp/Bee stings are overwhelmingly the most prevalent type of arthropod-related bites/stings, followed by spider bites, with scorpion stings as the least prevalent. For each type of bite/sting, the prevalence dropped from 2010 to 2011. The prevalence of scorpion bites continued to decrease until 2014. Both spider bites and hornet/wasp/bee stings decreased from 2012 to 2013. All 3 groups increased from 2013 to 2014. The highest prevalence of spider bites occurred in 2012, for hornet/wasp/bee stings in 2014, and for scorpion stings in 2010. The prevalence of arthropod bites/stings overall increased from 153,910 bites/stings in 2010 to 185,913 in 2014, representing a CAGR of nearly 5%. Considering changes in the prevalence of arthropod bite/sting over the study period, results indicate that the prevalence increased from 2010 to 2012 and then decreased in 2013. The overall prevalence increased to its highest point during the study period in 2014 (185,913 bites/stings).
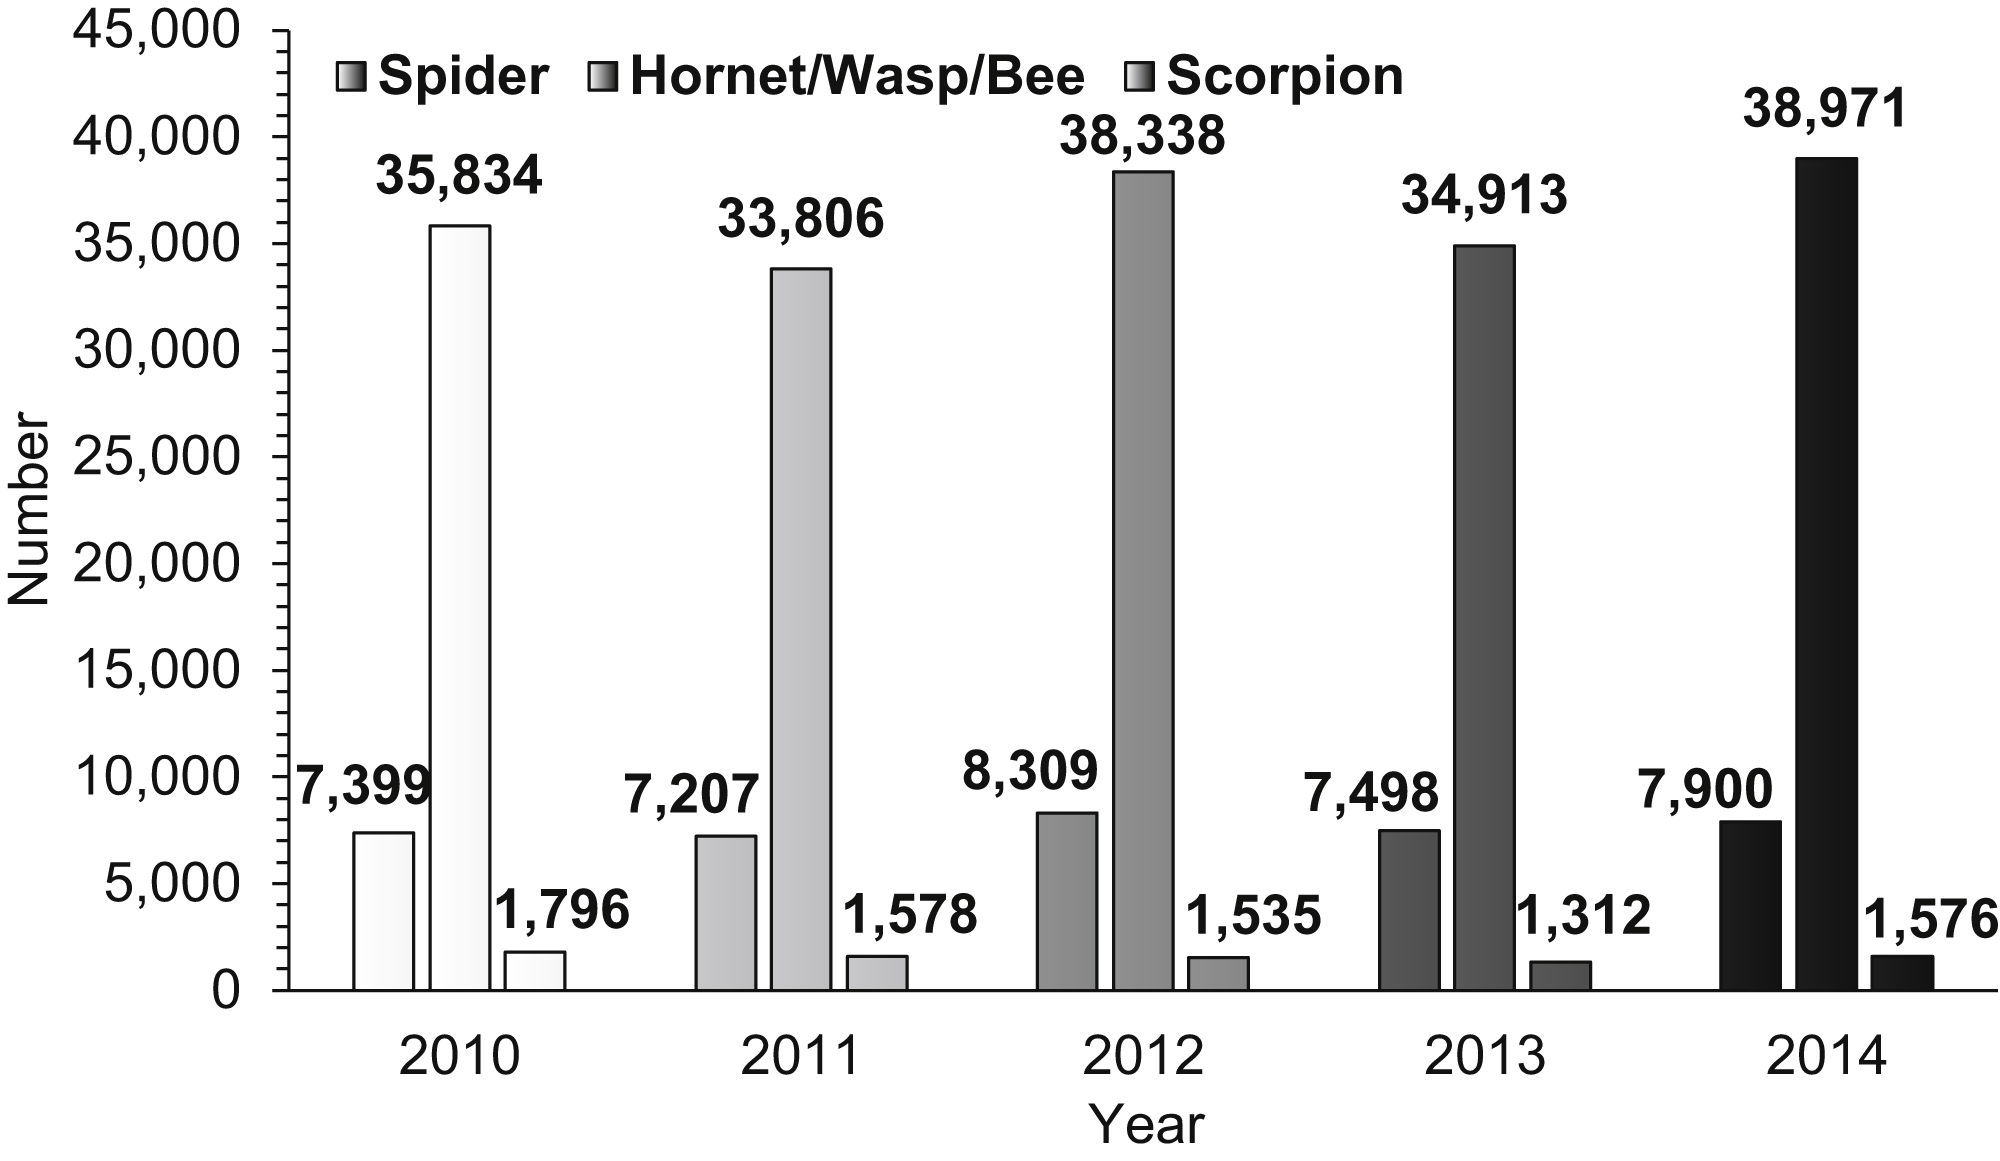
Prevalence of type of arthropod bite by year.
CHARACTERISTICS OF ARTHROPOD-RELATED BITE CASES IN THE ED
Age group
Table 1 presents the demographic characteristics of arthropod bite cases discharged from the ED stratified by age and sex. For both adults and children, females were more likely to be admitted to the ED with an arthropod bite (adults: OR=1.17, 95% CI 1.15–1.18; children: OR=1.22, 95% CI 1.21–1.24). Adult arthropod bite patients were more likely to admit to a hospital in the south than in the northeast (OR=1.48, 95% CI 1.41–1.54). Additionally, adults are 6 times (95% CI 6.00–6.40) and youth are 7 times (95% CI 6.78–7.33) more likely to visit the ED for an arthropod bite in the summer months compared to the winter months (December to February). For both age groups, individuals with Medicaid or no insurance are more likely than those with private insurance to admit with an arthropod bite. Adults with Medicare are less likely than adults with private insurance to seek emergency care for an arthropod bite (OR=0.61, 95% CI 0.60–0.62). Adults and children living in zip codes in the lower median household income quartiles are more likely to admit with an arthropod bite compared to those living in the higher income quartiles.
Correlates of arthropod bite discharges from United States emergency departments stratified by age and sex
OR, odds ratio.
P<0.001.
P<0.05.
P<0.01.
Notes: n=weighted count. The reference groups are column specific. For each column, the reference group is noninsect bite ED visits within each age group and sex.
Sex
For both males and females, adults are less likely than youth to admit to the ED with an arthropod bite (females: OR=2.18, 95% CI 2.14–2.23; males: OR=2.08, 95% CI 2.03–2.14). Additionally, both males and females are more likely to admit to an ED in the South for arthropod bites compared to any other region and to visit the ED for arthropod bites in the summer months compared to the winter months (females: OR=6.17, 95% CI 5.98–6.37; males: OR=7.13, 95% CI 6.90–7.37). Both males and females are significantly more likely to have Medicaid than private insurance (females: OR=1.95, 95% CI 1.91–2.00; males: OR=1.89, 95% CI 1.84–1.94). Furthermore, for both males and females, individuals residing in zip codes in the lower income quartiles are significantly more likely to be discharged from the ED with an arthropod bite compared to those in the highest income quartile.
Total charges
The average total charge per person for ED services for arthropod bites increased each year from approximately US $710 (95% CI US $683–737) in 2010 to almost US $1000 (95% CI US $947–1047) in 2014, representing a 40% increase. The total cost for any ED visit increased approximately 45% from US $2000 in 2010 to nearly US $3000 in 2014. The average total charge per person for arthropod bites in the ED over the entire study period was approximately US $850 (95% CI US $826–873), amounting to a total of approximately US $7.3 million in ED charges from 2010 through 2014.
Discussion
Arthropod bites and stings are relatively common, but their prevalence and demographic determinants are understudied. Our objective was to provide recent prevalence and correlate estimates on arthropod bites and stings from a well-characterized data source of national hospital EDs. Several key findings are worth highlighting. First, we found significant increases in ED visits for arthropod bites and stings over the study period. The CAGR for arthropod bites from 2010 through 2014 was nearly 5%. This growth is higher than the CAGR for total number of ED visits (2%) during that time period and the CAGR of 2% for abdominal pain, the most common reason for an ED visit. 16 Second, with regard to different types of arthropods, similar to previous studies, our results suggest that stings from bees, hornets, and wasps are more common than spider bites and scorpion stings. Third, consistent with previous literature, we found higher rates of bites and stings in the summer months, in the South, and among children. Fourth, those seeking treatment in the ED are more likely to have lower levels of income, to be without insurance coverage, and to have Medicaid rather than private insurance. Finally, we observed a dramatic rise in the costs associated with arthropod bites and stings over the study period such that current costs are likely approximately US $1000 per treated episode.
Although the causes for these increases are unknown, we offer several possibilities. First, these increases may be due to greater habitat encroachment, thus providing increases in exposure to arthropods. North Americans are increasingly living in or near wildlife areas and in suburban areas (nature in the suburbs effect) where there is a greater population of arthropods, especially hornets, wasps, and bees. Additionally, the greening of urban areas provides increased arthropod habitat and increases the likelihood of human–arthropod interactions. 17 There also could be trends underway in reduced willingness for self-care of bites and stings; however, if this were the case, we would seemingly not observe such a dramatic increase in such a short time frame. Finally, we cannot rule out the possibility that the increases are an artifact of random fluctuations in the phenomenon or in data collection that cannot be fully understood without longer time frames.
A variety of factors influence how arthropod bites and stings are treated—including, of course, the type of arthropod, time elapsed since injury, and the patient’s medical history, including any diseases, conditions, or allergies that may affect wound healing. 18 After evaluation, treatment typically includes a physical examination, initial wound care with irrigation, wound exploration, and finally wound closure. In the presence of infection, antibiotics are the standard of care, and the choice of antibiotic may be dependent on results of tests. In cases in which sting-induced anaphylaxis occurs, epinephrine is generally considered the first-line therapy. Notably, despite consensus regarding the effectiveness of epinephrine, it has been found to be underused with preference for antihistamines and corticosteroids.18,19 This underutilization is the result of numerous patient and physician barriers, including high costs and lack of availability. 19 Particularly relevant to our study, the increasing cost and therefore lack of access to epinephrine may result in an increase in ED visits related to bites and stings. It is important to note, however, that current guidelines recommend ED assessment after administration of epinephrine in a community setting, which therefore may also affect the prevalence of bites and stings seen in the ED.
Given the large number of patients included in the NEDS (approximately 31 million ED visits each year), this database is considered to be representative of the US population. 20 Additionally, the NEDS is stratified on a variety of hospital characteristics (geographic region, trauma center designation, urban–rural location, teaching status, and hospital ownership). The objective of this stratified sample is to represent a microcosm of US hospital-owned EDs. Using the survey-specific analysis tools in Stata, we were able to account for the complex survey design of the NEDS and the potential for sampling bias to report national estimates of arthropod bites.
Despite these strengths, results of the admit study should be interpreted in light of important limitations. First, NEDS data may be subject to coder error and individual coding variations by both the individuals entering the codes and medical reviewers. We are also not able to ascertain from the coding the rate at which patients re-presented with arthropod-related injuries. Additionally, we know that most arthropod bites and stings go unreported, so the analytic sample here is biased toward more severe cases. In short, there are likely significant differences between individuals who seek treatment for bites at the ED and those who self-treat. In addition, 16 states do not partner with the NEDS, and it is possible that the prevalence in those states may significantly differ from that in other states. The sampling design and large number of patients included in the NEDS, however, allow for national prevalence estimates of arthropod bites. Furthermore, the NEDS data are essentially cross-sectional and therefore limit our ability to draw any causal inferences. Despite these limitations, the admit study provides useful updated surveillance regarding the prevalence of, recent trends in, and correlates of arthropod bites and stings in the US population.
Conclusion
Present study findings indicate increases in ED visits for arthropod bites and stings over the study period, with stings from bees, hornets, and wasps being the most common. We also found that those seeking treatment have lower levels of income and insurance coverage. Over our study period, we observed a substantial increase in costs (US $1000 per treated episode). Given the ubiquity of arthropod bites and stings and resulting suffering and expense, ongoing attention to the prevalence, correlates, and situational habitat determinants are needed to better implement educational awareness and medical intervention policies and practices.
Footnotes
Author Contributions
Study concept and design (MGV, KJH); acquisition of the data (KJH); analysis of the data (MGV, KJH, JTC); drafting of the manuscript (MGV, KJH, CPSW, JTC); critical revision of the manuscript (MGV, KJH, CPSW, JTC); approval of final manuscript (MGV, KJH, CPSW, JTC).
Financial/Material Support
None.
Disclosures
None.