
Abstract
Objective
We sought to obtain the first effective sweep widths (ESWs) ever measured for an air-scent search dog unit to compare their performance to historical data from human searchers and to initially test the validity of atmospheric convection as a limiting factor in air-scent search.
Methods
We used GPS tracks and waypoints to measure lateral hit and miss distances for the dog teams during blinded, randomized training tasks during a 6-year period, calculating ESW using the crossover method. During the tasks we collected weather data for determining convection. We used nonparametric statistics and least-square regression to compare the dog ESW data with historical human data and weather conditions.
Results
The mean value of ESW for the 4 teams under all conditions was 95 m (95% CI, 44 to 145). The dog teams’ performance was statistically superior to human visual searchers in detecting search subjects in low-visibility colors, but not subjects in high-visibility colors. A nonparametric correlation test of ESW vs convection gave P < .05, suggesting that convection may be an operationally significant factor in air-scent dog performance.
Conclusions
The ESW methodology is applicable to air-scent dog teams, potentially allowing search managers to make decisions in applying resources operationally, as well as improving accuracy of planning calculations. In addition, the methods described appear to be capable, given more widely representative data, of making valid statistical comparisons between different search modalities and weather and other factors.
Introduction
The typical lost-person search must use limited resources in a triaged manner, applying search efforts to segments of the potential search area that the search management team estimates are most likely to contain the search subject. (A search segment is a subarea of a larger search assigned to a single modality to search in a single task.) Search efforts throughout the duration of an incident may leave some segments unsearched, in an attempt to maximize the overall probability of success (POS) for the search effort using Bayesian logic.1,2
Standard-of-practice methods for search-and-rescue (SAR) management attempt to optimize overall POS via the following equation1,2:

POC, the probability of containment, is the probability that the subject is present in a given segment of the overall search area. POD, or probability of detection, is the probability that the search modality used in that segment will detect the subject under the given relevant environmental and other conditions.1,2 The POC × POD calculation is performed for every search segment, then summed to find the overall POS for the entire search area.
A major weak link in the overall POS chain is determination of POD. Most ground searches in North America continue to rely on estimated PODs from search team leaders, a method that is subject to great inaccuracy.3,4 To address this problem, Frost, Koester, and others have adapted the effective sweep width (ESW) methodology from earlier military practice to ground SAR (GSAR) use.3,4 The method produces a distance-scaled parameter, ESW, which multiplied by search effort (sum of the distance moved through the search segment by each search modality used) and divided by the size of the area searched gives a coverage value (C). Coverage, in turn, allows calculation of objective PODs via a negative exponential function. 2
The ESW methodology promises a significant advancement in determination of accurate PODs for gauging the efficacy of previous search efforts and for planning future search efforts to maximize overall POS. However, its adoption has been slow. Among a number of reasons may be that most search incidents are brought to a conclusion rapidly, and so do not require formal overall POS-based search planning. Another is that to date no sweep-width data have been obtained for air-scent dog teams, a major search resource in many parts of the United States.
In this study, we obtain sweep-width values for 4 air-scent dog-and-handler teams in western Pennsylvania, comparing their performance with data from our earlier study of human searchers in some of the same terrain. 5 We demonstrate how seasons and subject clothing color change the relative strengths of these 2 important search modalities, shedding light on resource utilization in reflex searches as well as those that have not yet progressed to mathematical planning. 6 We also suggest how local atmospheric convection conditions may affect air-scent dog performance.
Unlike the possibly better-known trailing dogs that follow scent on the ground, air-scent dog teams find search subjects by detecting airborne scent from downwind of the subject. The idea is for the handler to move the dog, who is operating off-leash, across the wind, such that the dog detects the subject and moves in to find him or her, then signals the handler (Figure 1). A number of tactics may be used to achieve a crosswind path: straight-line grids starting at the downwind edge of a more or less level area; moving along with contour lines to take advantage of daytime updrafts or nighttime downdrafts; or a search beginning with the perimeter of the area, subsequently bisecting it based on the handler’s subjective opinion of whether and where the dog is detecting scent. 7 Our methods are applicable to any of these tactics. In this study, we allowed the handlers to choose their own path and tactics based on local wind and terrain as they do in actual searches, so that the results would be operationally relevant.
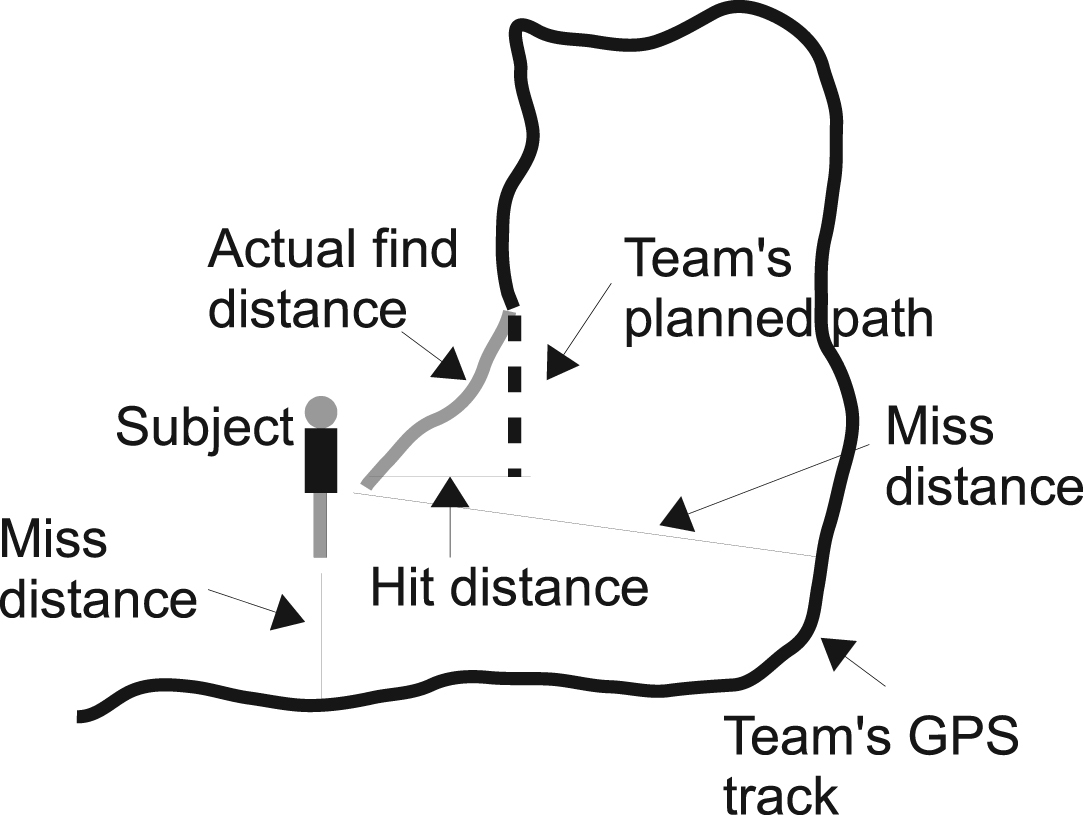
Schematic representation of air-scent task/scoring detection opportunities. Note path of team is arbitrary, for illustration only.
A robust literature supports the idea that turbulence is a major limiting factor in olfactory search in a number of species and media, being the major source of dilution of scent signals at the scale of macroscopic organisms. 8 –10 Convective turbulence—turbulence caused by the sun heating the ground, with the air in contact with the ground warming and subsequently rising, thus breaking up plumes of scent or other atmospheric contaminants—is a major contributor to atmospheric turbulence in daytime conditions such as those in which we measured air-scent dog performance. Previously, Graham 11 used field calculation methods developed for the US Forest Service12,13 to measure the effect of convection on air-scent dog performance at fixed detection distances. Although this report suggested that convection was a major limiting factor in air-scent dog performance, it did not include statistical analysis and did not appear in a peer-reviewed journal. Because these tables are in operational use in some quarters and the literature strongly supports that convection will be important, we designed our data collection to include the weather observations necessary to make an initial test of Graham’s hypothesis.
Methods
The GSAR model for determining ESW, in which a relatively large number of searchers walk through an arbitrary course set by the course designers, is not practical for air-scent SAR dog teams: It would not allow the handlers to use tactics to work the terrain and wind for scent transport, possibly degrading the dog’s search efficacy. It would require an unwieldy number of human search subjects, as unlike human searchers, dogs cannot be realistically tested against mannequins of similar size and shape to humans. Acquiring enough operational air-scent dog teams to obtain useful results in a single experiment is likely to be a major challenge. The limited weather sampled in a single experiment would likely result in limited application for the results.
We addressed these issues by returning to the earlier methodology 14 in which the known position of the search object (in our case, a live human) is compared with the measured track of the detector—in the earlier study, aircraft tracked via microwave radar; in ours, the track of the handler was measured by GPS (see Figure 1). We calculated all ESWs via the crossover method.1,2
We collected data at 107 daytime tasks recorded at regularly scheduled training sessions during a period from June 27, 2004, to March 27, 2010, thus sampling year-round weather conditions, and at a number of sites in our response area. Two handlers alternated in handling Pip, an intact female English shepherd born in 1999, and Sophia, a neutered female German shepherd born in 2005, on a series of training tasks. Note that both handlers began the study with nearly identical training and operational histories, having been operational for 12 years apiece at the initial data collection.
When measured in the study Pip and Sophia were operational by the then-current internal standards of the Allegheny Mountain Rescue Group (AMRG) (no longer available online, but roughly corresponding to National Incident Management System (NIMS) Type II nondiscriminating air-scent dog team 15 ). Each was in addition certified with external testing organizations, including the Pennsylvania Department of Conservation and Natural Resources (both dogs; standards no longer available online, but roughly corresponding to NIMS Type IV nondiscriminating air-scent search dog team) and the National Association for Search and Rescue 16 (Pip only, NIMS Type III). Each dog-and-handler team also worked together on multiple real SAR missions.
We collected data as an addendum to the unit’s normal training program. The dog and handler were both blinded as to the subject’s location, and the Universal Transverse Mercator (UTM) coordinates were randomized within the assigned search segment using the random-number generator of a Casio FX-260 solar calculator (Casio America, Inc, Dover, NJ). Note that it was possible to place the subject within the uncertainty of the GPS fix (approximately 10 m) of the randomized position in every case.
We conducted the tasks at 33 separate locations in western Pennsylvania, including state game lands, state forests, state, county, and local parks, and some private lands (with owners’ permission). These sites were chosen as part of our regular training program, and sampled woods, fields, brush, strip mines and other waste sites, and other typical environments in the Allegheny Plateau and Allegheny Mountains of western Pennsylvania. One of these sites was State Game Lands 203, the location of our previous GSAR sweep-width experiments. 5 We undertook 9 tasks (8.4%) at that location.
We determined convection conditions using the tables of Weber et al. 17 Briefly, given a wind speed in Beaufort scale, insolation (the effect of cloud cover on light reaching the ground), and vertical sun angle, one can categorize convective turbulence via an integer- or letter-based system: 1 or A to denote maximal daytime convection through 4 or D, denoting minimal daytime convection. Convection categories of 5 through 7 can be observed at night, but lie outside the scope of the current investigation.
Either the handler or a teammate recorded wind and cloud conditions during tasks, using the field-based method of Lavdas developed for the US Forest Service,12,13 and Beaufort wind scale using the standard Beaufort tables. We calculated all convection categories after the field data were collected by determining the sun angle with the US Naval Observatory’s web-based calculator, 18 insolation class from Lavdas’s tables,12,13 and subsequent convection category via the tables of Weber et al. 17 To determine average insolation and sun angle across tasks or detection opportunities, we converted the category-based measurements required to use the convection tables to numbers (high insolation = 1, medium = 2, low = 3; sun angle <15 degrees = 1, 15 to <35 degrees = 2, 35 to 60 degrees = 3, >60 degrees = 4). A reference table incorporating results from Weber’s tables 17 as well as Lavdas’s method for identifying insolation, 13 is shown in the Table to illustrate how convection is calculated. 11 ,13,17,18 Note that there is no equation for determining convection categories; such tables originate with the original research by Pasquill 19 for determining dilution of pollutants owing to convection.
Daytime convection class matrix a
Read insolation category first; then sun angle; then use wind speed in Beaufort units to read across to numerical convection category.
To compare convection vs ESW values, we used the numeric system for grading convection conditions rather than the letter-based method—the daytime convection conditions were, then, 1 through 4 rather than A through D. This allowed us to place convection conditions on the x-axis of a graph with each dog-and-handler team’s ESW value for each of these 4 conditions on the y-axis. In condition 1 we did not have enough data to obtain a crossover point for 3 of the 4 dog-and-handler teams; similarly, in categories 3 and 4 we lacked data for 1 of the 4 teams. Thus we obtained 1 point for category 1, 4 for category 2, and 3 each for categories 3 and 4.
We recorded location coordinates and movement tracks with a Garmin eTrex, GPSMAP 60CS, or GPSMAP 60CSX GPS unit, using MapSource 3.02/Topo US 100K topographic maps on the GPS unit (from Garmin International, Olathe, KS) and Maptech Terrain Navigator or Terrain Navigator Pro (various versions, MyTopo, Billings, MT) for the desktop computer.
We determined detection opportunities (DOs, hits plus misses) using the lateral (ie, shortest) distance between the handler’s path either for misses (when the team passed the subject without a find) or detections (when the dog found the subject) and the subject’s position subsequently recorded by the handler. We measured lateral distances from the track to the subject manually, after all data were collected, on a printout of the task via Maptech, using the program’s UTM coordinates as the distance scale.
Note that in no case was a hit distance counted if it did not include the full suite of “refind” behaviors: finding the subject, returning to the handler, the dog giving the handler her trained signal, and then leading the handler back to the subject. To avoid truncating find distances, we set the minimal size for the included search areas at 4 hectares. Search problems intentionally of smaller size, involving linear tasks, unblinded problems, night tasks, or for target scents other than live human (eg, human remains detection training), all regular parts of our training program, were not included in the study.
In 12 tasks, the handler made a visual find on the subject before the dog made a find (11.1%, although note subjects usually wore medium- to low-visibility colors). We elected to measure the dog-and-handler team as a unit, because this made it unnecessary to make difficult calls as to what constituted a “dog” vs “handler” find (eg, if the dog’s movement toward the subject caused the handler to look in that direction). Comparisons with human visual sweep-width data, we reasoned, would provide a measure of the net value the dog added to the search task.
Of the 108 search subjects, the team assigned to the task achieved 103 finds (95.3%). When the team searched the area and did not make a find, the handler “called” the problem; in these cases only “miss” data obtained before the handler ended the task were included in the study. The problem was then unblinded, and the handler moved the dog toward the subject to allow the dog to make a find and meet training goals.
We used the data from these tasks to derive 103 find distances and 229 miss distances, for a total DO figure of 332. However, the number of miss distances is somewhat arbitrary, as we could have scored farther misses based on the teams’ GPS tracks. We cut the misses off at slightly higher than 230 m, the lateral distance of the longest-range find we observed. Note that this by definition will not affect the final ESW values, as adding any number of misses above the longest find distance or finds below the shortest miss distance to a crossover graph will not move the location of the crossover point used to determine ESW.1,2
Data were discarded for the following reasons: handler inadvertently cued of subject’s location by other than the dog or visually spotting the subject during the task, 1 task (0.9% of study tasks); subject placed outside assigned search segment, 1 task (0.9%); finds on incidental subjects (bystanders whose locations before the find could by definition not be accounted for), 2 tasks (1.9%); and area proved to be smaller than 4 hectares upon mapping, 1 task (0.9%). In 2 tasks the handler failed to completely log weather conditions (1.9%); these data were excluded from the analysis of sweep-width under various convection conditions, but were included in the other comparisons, which did not require weather measurements.
We used GraphPad Prism version 5.04 for Windows (GraphPad Software, San Diego, CA) to perform our statistical testing and to generate graphs. All tests were 2-tailed.
Institutional Review Board
As an operational SAR team, AMRG has no institutional review board or process. However, participants in this study (or their guardians, if minors) signed safety release forms explaining the risks of outdoor activities. These are observational data collected during standard operational training exercises, conducted in accordance with local, state, and federal animal welfare legislation, and in adherence with the imperatives of operational safety.
Results
From June 27, 2004, to March 27, 2010, we carried out 107 daytime air-scent search tasks for 108 subjects (1 task involved 2 subjects). The tasks had a mean segment area of 11.5 ± 4.4 hectares and a duration of 42 ± 34 minutes (both margins of error expressed as SD).
At the 105 tasks for which we recorded complete weather observations, we observed a mean wind speed of 1.71 ± 0.93 Beaufort units (rounding to 2, which corresponds to a speed of 6 to 12 km/h), insolation of 1.91 ± 0.87 (rounding to 2, or medium insolation); and vertical sun angle of 2.60 ± 0.92 (rounding to slightly over the dividing line between 15 to <35 degrees and 35 to 60 degrees—see Table). The mean of the individual tasks’ convection category was 2.89 ± 0.97, rounding to 3 (again on a scale of 1, strongest, to 4, weakest, convection).
Note, however, that each task did not contribute an equal number of DOs to the ESW determination. In some tasks, there were many more miss distances than others; 2 tasks did not contribute hit distances. Recalculating these factors weighting for number of DOs contributed by each task results in mean wind speed of 1.71 ± 0.83 Beaufort, insolation of 1.83 ± 0.84, sun angle of 2.68 ± 0.86 degrees, and mean convection by DO of 2.80 ± 0.93.
In the study tasks we experienced 4 refind failures, in which the dog found the subject but the handler was not aware of it, a failure rate of 3.7%. As reported above, the other type of failure—simply not finding the subject—occurred at a rate of 4.6%. Note, however, that there was no overlap between the two: in every case of refind failure, the dog returned the subject later in the task and signaled the handler, leading to a complete refind.
We used the crossover method1,2 to obtain an ESW value combining the data for the 4 dog-and-handler teams under all conditions (Figure 2, although note we truncated the x-axis to make the crossover point clearer, placing 100 DOs off the right edge of the graph). This proved to be 97 m. We also, as in our earlier report, 5 calculated ESW individually for each dog-and-handler team, which resulted in a median value of 93 m, with a minimum of 60 m and a maximum of 133 m. The mean value of this measurement was 95 ± 32 m (standard deviation), with a 95% CI of 44 to 145 m. Note that individual ESWs were used in the following analyses, as the single value produced by the all-team crossover graph would not allow statistical comparison.
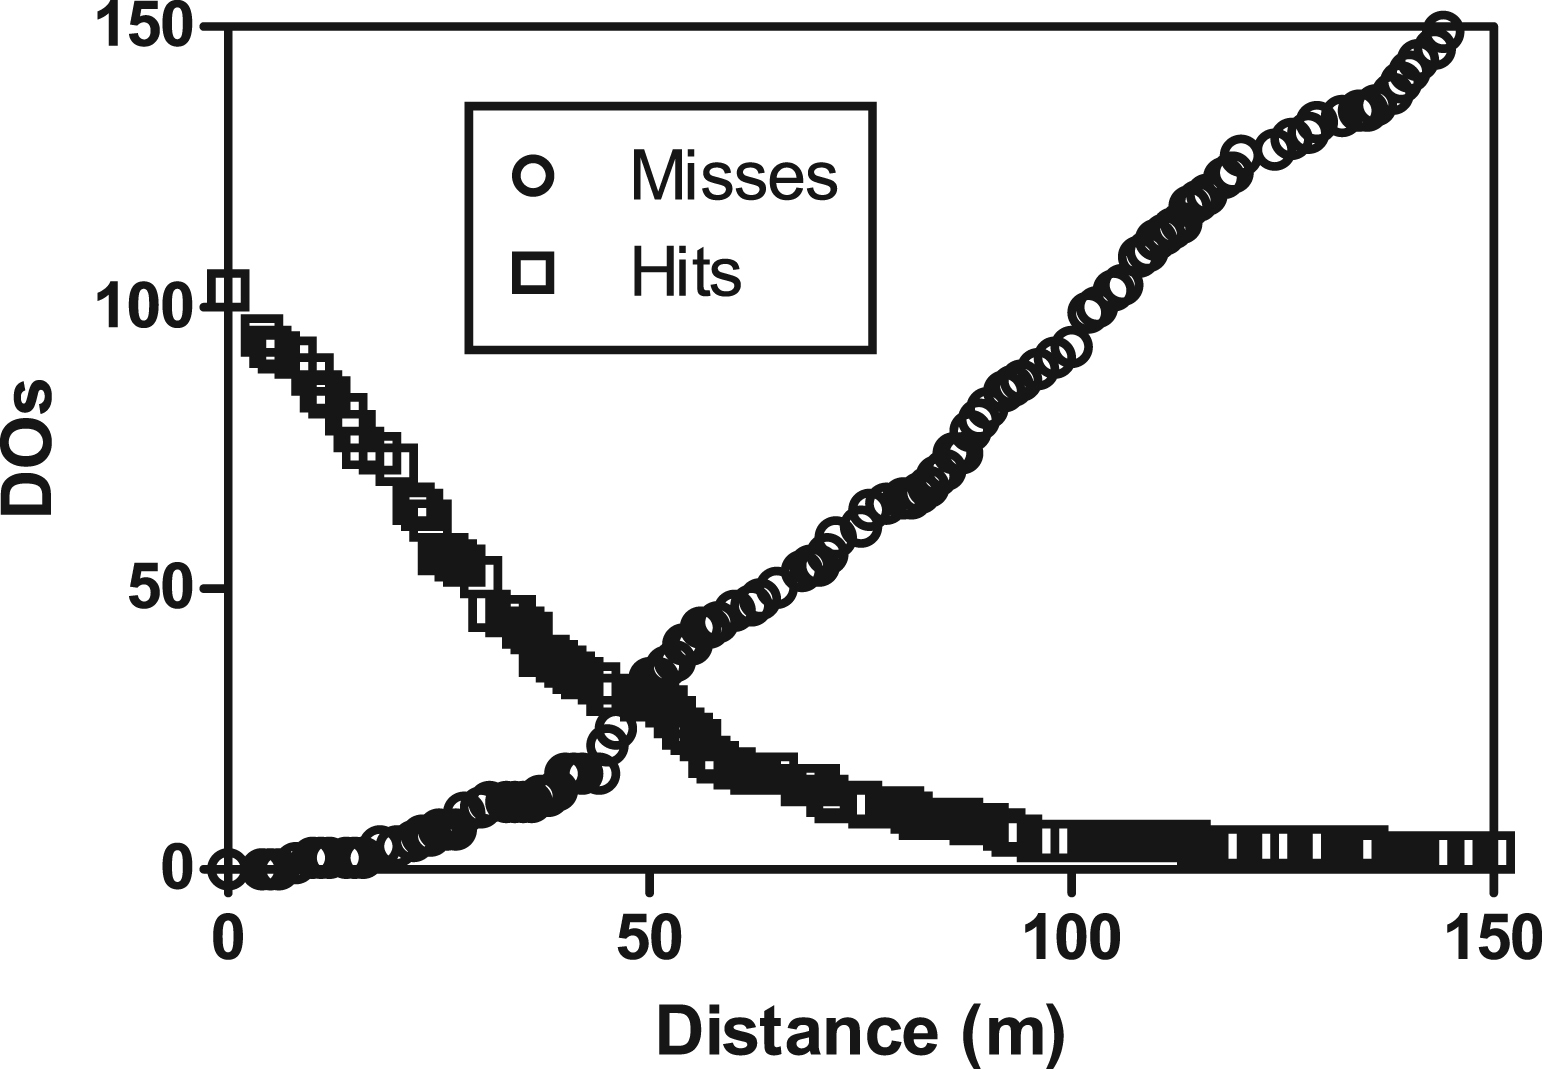
Crossover graph for all air-scent dog teams, all conditions. DOs, detection opportunities. Distance on x-axis at crossover point is half of effective sweep width.
Comparison of Dog Teams With Human Searchers
We compared the ESW value from each dog-and-handler combination for a historical control comparison with the ESWs for human searchers we previously derived. 5 Because the earlier data were separated by both season and the color of the search object (a white mannequin with a blaze orange vest was the “high visibility” search object in the earlier human study, an olive green mannequin was “low visibility”), we compared the dog-and-handler teams with individual human searchers in the same season. In each case we had insufficient data to attain a crossover for 1 of the 4 dog teams in each of the summer and winter comparisons.
The median values from the previous study serving as historical controls were 42.75 m for humans detecting high-visibility subjects in summer, 14 m for humans/low-visibility/summer, 84 m humans/high-visibility/winter, and 34 m humans/low-visibility/winter. Data from the current study produced a median value of 117 m for dog-and-handler teams searching for live human subjects in the summer, 98 m in the winter (Figure 3). A nonparametric ANOVA test showed a significant difference between these groups (Kruskal-Wallis test, P < .0001). A Dunn’s multiple comparison post-test suggested that the dog teams had significantly higher median ESWs than humans searching for low-visibility subjects in both seasons (P < .001 summer, P < .01 winter), but not for high-visibility subjects in either season. Also not significant was the difference between the dog-and-handler teams in summer vs winter.
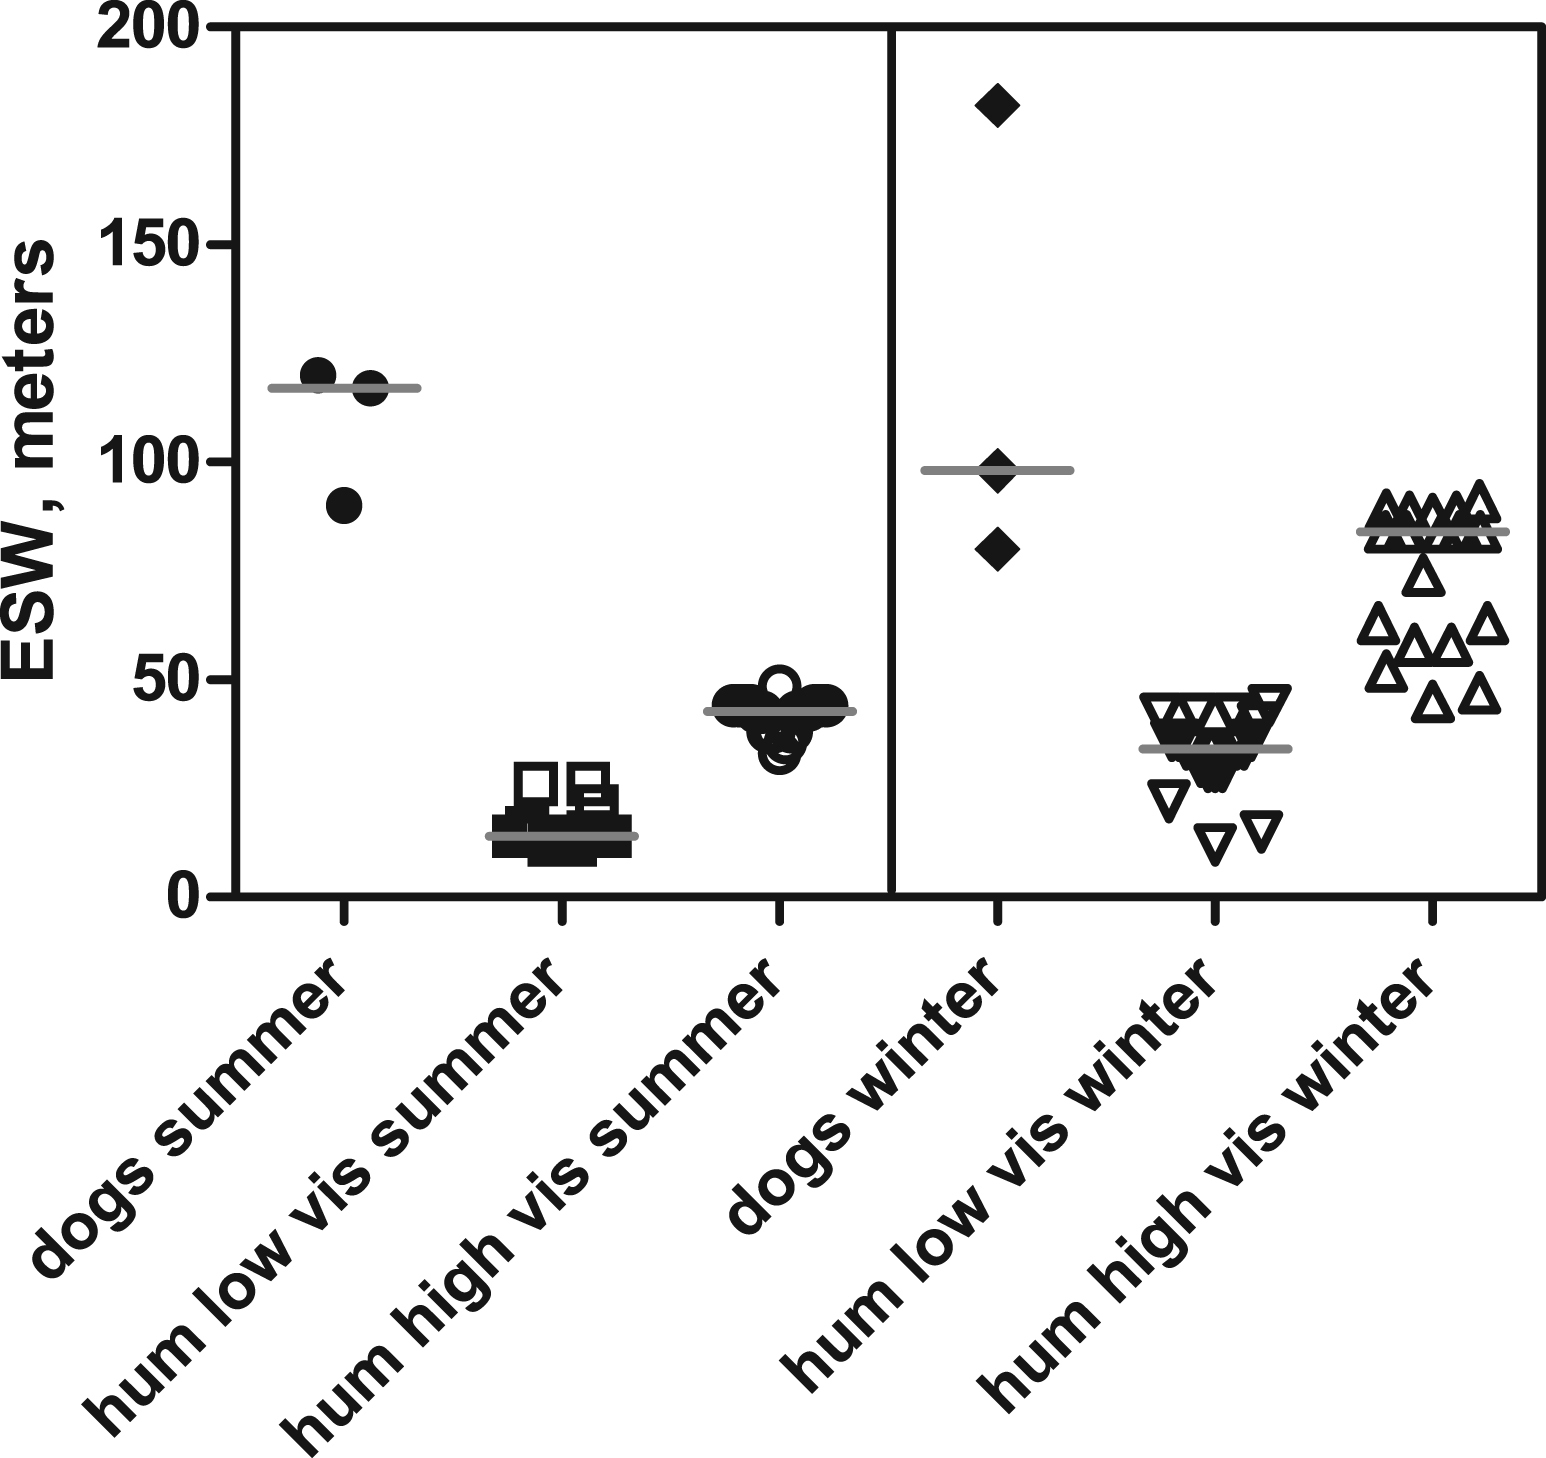
Comparison of dog effective sweep width (ESW) values in summer and winter vs historical ESWs for human (hum) searchers as previously reported by the authors. High vis, humans searching for adult human mannequins in high-visibility colors; low-vis, humans searching for mannequins in low-visibility colors. Points represent individual human searchers for the season/color categories, individual dog-and-handler teams by season for the dogs categories. Horizontal gray bars are the medians for each group.
Convection Effects on Dog-Team Esw Values
The individual ESW values calculated for each dog-and-handler team at different convection conditions are shown in Figure 4. Despite the variance between the teams visible within each convection category, there is a significant correlation (Spearman ρ = .6466) between convection and ESW (P = .0368). This suggests that convection may indeed be an operationally relevant limiting factor to air-scent dog efficacy.
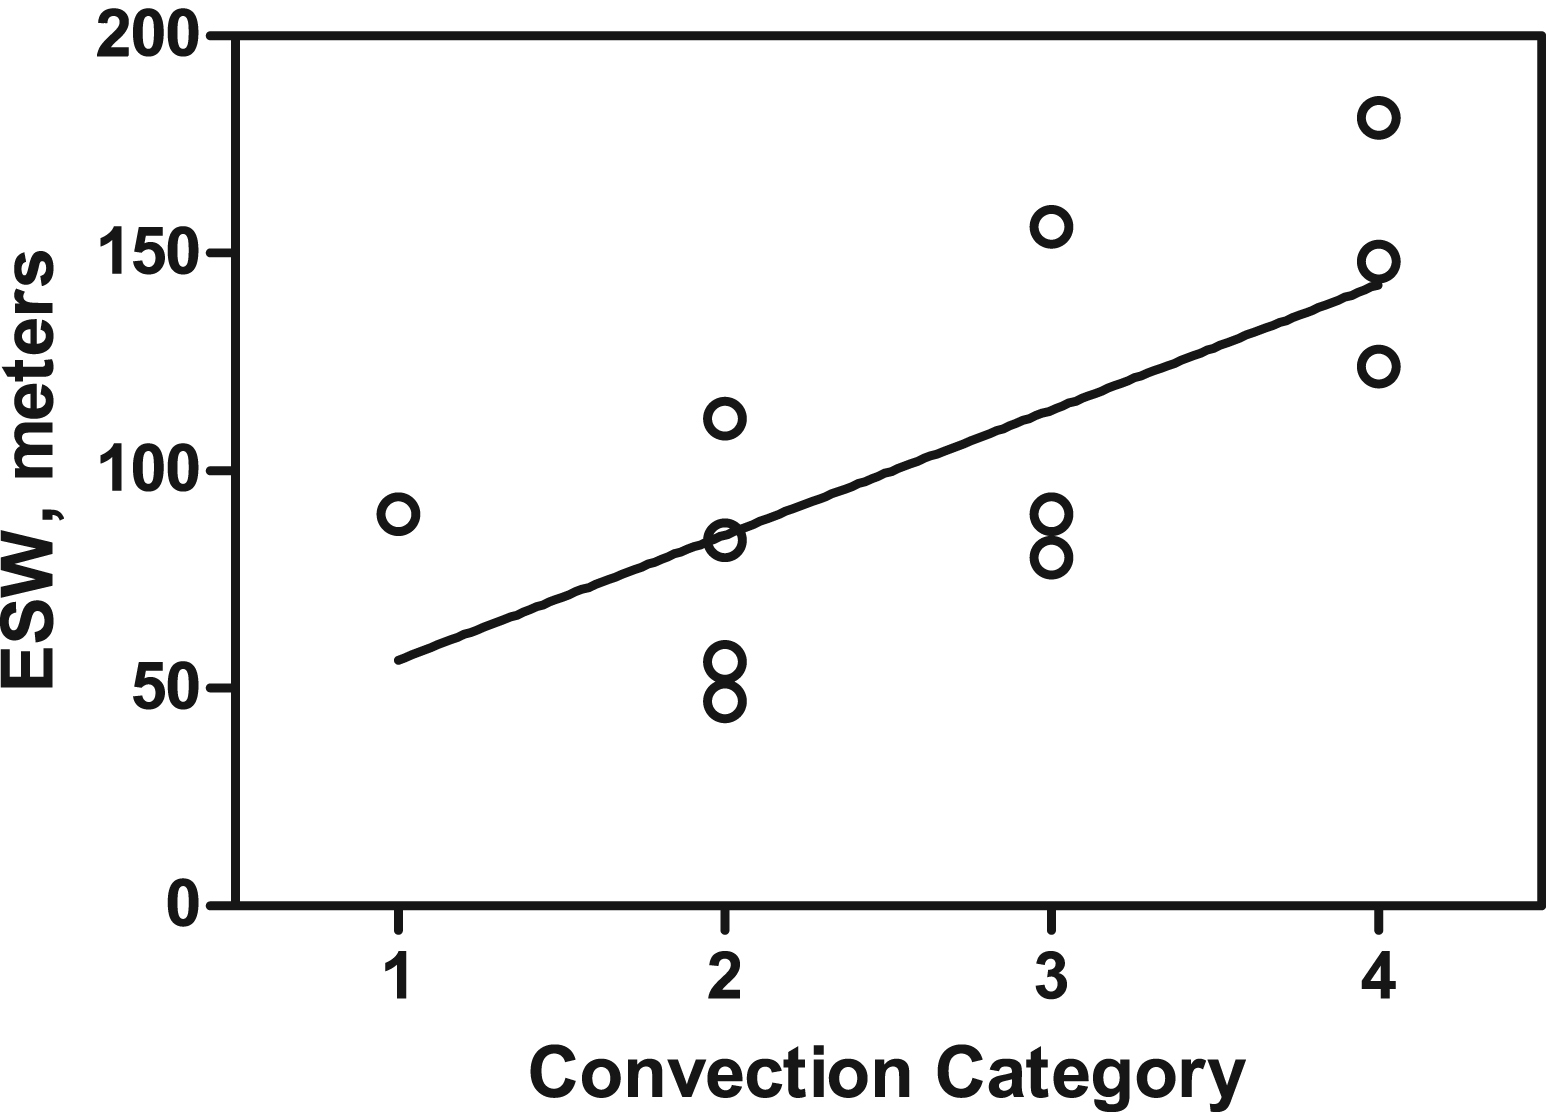
Correlation between effective sweep width (ESW) and convection categories. Points represent individual ESWs determined by crossover for each team in each convection category. Line shown is least-squares linear fit.
Figure 4 also includes the line resulting from a least-squares fit of the relationship between convection category and ESW. The fit produced the following parameters: Y-intercept was 28 m (95% CI, –39 to 94 m); slope was 29 m/convection category (95% CI, 5.7 to 52 m/convection category). The R 2 of the fit was .4695.
A replicates F test for lack of fit provided P = .4678, indicating no evidence of an inadequate model; a D’Agostino and Pearson omnibus K2 test for normality of residuals provided P = .1247, offering no evidence of nonnormality.
Discussion
In this report we demonstrate the first application of the ESW methodology to air-scent dog teams. Our results suggest strongly that operational sweep widths can be derived for air-scent dog teams. Our results provide the first glimpse at what these ESW values are likely to be, given the weather conditions and terrains typical during a 6-year period in our response area.
Our results offer some immediate lessons for search managers and dog handlers alike. Subject to the limitations described below, the significant differences between our air-scent teams and human searchers in finding low-visibility subjects year-round suggests that air-scent teams may offer an operationally significant advantage in searching for search subjects in such colors, or for whom clothing color cannot be reliably established.
The nonparametrically derived correlation between convection category and ESW reported above represents a model-free indicator that stronger atmospheric convection associates with lower ESW values, and may prove to be a factor in determining operational ESW values. Undoubtedly it cannot yet be considered representative across the entire air-scent dog community, both because of the small size of our data set and the lack of heterogeneity among the dog-and-handler teams we tested. However, the weight of the prior literature on the effect of turbulence on olfactory search in other species provides support to the operational importance of convective turbulence. 8 –10
The linear fit of convection category with ESW, by comparison, is far more speculative, as it relies on a linear relationship that was not predicted by previous research. This relationship could prove to be nonlinear on further research, and so should be interpreted with caution. If it does prove to be robust, the curve in Figure 4 could hold promise in making meaningful comparisons between dog-and-handler teams, different training methods, etc. in tasks that take place in different convection conditions.
Limitations
Our methods and the size of our study impose a number of limitations on our results. Clearly, it is not possible to make global pronouncements on the national and international air-scent dog community’s performance based on data from only 4 teams, and those with virtually identical training and operational experience. Nevertheless, we have demonstrated that ESW figures can be derived for air-scent dog teams.
Because of the small size and therefore limited statistical power of our study, we elected not to test a number of potentially important factors, including frictional turbulence caused by vegetation and terrain features, humidity, temperature, differences based on training and tactical doctrine, and more. We focused on comparisons with humans in different seasons and subjects wearing different color clothing, as well as convective turbulence, because previous studies had suggested they would be important. 3 –5,8–10,19 The fact that we recorded results at a number of training tasks in year-round ambient weather conditions and terrains would tend to average out the environmental factors. However, some or all of these additional factors may prove to be important, thus decreasing the correlation between convective turbulence and ESW seen in Figure 4 and making our results less valid applied outside our region of the country.
The limitations of historical controls, such as we used in the comparison with human searchers, in fully duplicating experimental conditions are well known, but briefly, the fact that the geographic areas sampled in the earlier human experiments were more limited than (if overlapping with) those used in the current study is a potential source of bias. So is the fact that the human searchers were looking for mannequins while the dogs were looking for humans.
Our color-based comparisons were not complete, as we did not systemically investigate or control for high- and low-visibility clothing in our dog-search subjects. However, our usual practice is to place subjects in medium- to low-visibility colors, and offer camouflage jackets, netting, etc. to avoid visual detections by the handler, particularly when subjects are wearing high-visibility colors. This would tend to handicap the dog teams compared with humans searching for high-visibility subjects, and thus might make the dogs’ real performance compared with humans better than that reported above for high-visibility subjects. Another factor that would tend to underestimate the dogs’ advantage is the fact that these tasks did not, unlike the human sweep-width experiments, take place on a set, marked course. The dog-team results therefore reflect realistic problems with and distractions offered by navigation and other field team leadership tasks.
Conclusions
Our data indicate that the ESW methodology is applicable to air-scent dog teams. This potentially allows search managers to make decisions in applying resources operationally, as well as improving accuracy of planning calculations. The methods described appear to be capable of making statistical comparisons between different search modalities and weather and other factors. In particular, our results suggest an advantage to dog teams in searching for subjects wearing low-visibility colors, and that atmospheric convection may limit dog efficacy in an operationally significant way.
Footnotes
Acknowledgments
The authors would like to thank AMRG’s dog handlers and other members, members of other SAR teams, and other volunteers who have served as practice subjects for our dogs and as dog team members. Their most profound thanks go to the dogs of AMRG whose work, directly or indirectly, contributed to this study Cinders, Sophia, Moe, Friday, Rosalyn, Pip, Mel, and particularly Lilly, who made us look good long before we had any possible claim to it. Thanks go to GraphPad for donating its Prism software to AMRG. Finally, we thank R.J. Koester and C.R. Twardy for many invaluable consultations on methodology.