
Abstract
Objective
To describe clinical chemistry and weight changes after short-term food or sleep deprivation or multiple deprivations during civilian survival training.
Methods
Data from one baseline-controlled two-period crossover study designed to compare sleep deprivation for up to 50 hours with food deprivation for up to 66 hours (n = 12) and data from regular multiple-deprivations survival training comparing participants (n = 33) with nondeprived instructors (n = 10).
Results
Food deprivation was associated with decreased body weight, blood glucose, serum triglycerides, sodium, chloride, and urine pH, and there were increases in blood and urine ketones and serum free fatty acids. Sleep deprivation was associated with a minor decrease in hemoglobin and erythrocyte particle count and volume fraction and an increase in leukocytes.
Conclusions
The clinical chemistry and body weight changes associated with food deprivation were qualitatively similar to those observed in fasting obese patients but developed quicker in the survival training setting. Sleep deprivation had few effects on the clinical chemistry profile except for hematological variables. Physicians evaluating clinical chemistry data from patients subjected to short-term food or sleep deprivation should take the physiological state into account in their assessment.
Introduction
Training to handle prolonged emergency or survival situations is carried out in civilian and military contexts. During such training the participants are usually subjected to simultaneous deprivation of many basic needs such as food, water, rest, sleep, and company. Although there are reports published on some clinical chemistry changes during such multiple deprivation (MD) training, no attempts have been made to disentangle different factors. In this study we compare the impact of sleep deprivation (SD) with food deprivation (FD) on a range of clinical chemistry variables and body weight and compare the outcome of each on a smaller number of variables measured during civilian MD survival training. Effects on cognitive function, 1 cholesterol synthesis regulation, 2 and hepcidine-25 levels 3 have been reported in detail previously. The implications for evaluation of clinical chemistry data are discussed.
Materials and Methods
Subjects
The study was approved by the ethics review board at the Karolinska Institute, and the subjects were given oral and written information before giving their written informed consent to participate.
Sleep deprivation and food deprivation data
Five women and 7 men, healthy, nonsmokers (further demographic information is given in Table 1) participated in an experiment run as a part of a 9-day course arranged by the Swedish Survival Guild together with the Swedish Civilian Defence League. The subjects have been actively engaged in survival training for 1 to 18 years.
Demographics of the study populations a
BMI, body mass index; FD, food deprivation; MD, multiple deprivations; SD, sleep deprivation.
Results are shown for the FD and SD subjects from the crossover designed experiment and the control and MD subjects of the observational data. Age and height were not recorded for the latter group. Results are reported as mean ± standard deviation, with range given in parentheses.
Multiple deprivations data
Twenty-five men and 8 women participated as part of a 1-week summer survival course arranged by the Swedish Survival Guild 2007–2009. Ten instructors (1 woman) served as control subjects (Table 1).
Study Design
The FD/SD part used a crossover design allocating 6 randomly assigned subjects to each of 2 cohorts stratified for sex: 1) SD first and FD second—“group SF” (2 women, 4 men), and 2) FD first and SD second—“group FS” (3 women, 3 men; Table 2). Urine was collected in 24-hour portions. Body weight was measured before breakfast at the same time each morning after voiding of the bladder and with standardized clothing. Clinical chemistry sampling (except urine) was started 1 hour after breakfast (when allowed). Capillary glucose and 3-hydroxybutyrate (Precision Xtra Plus, Abbott Diabetes Care, Maidenhead, Berkshire, UK) were analyzed on site, and this was also the case for urine pH (indicator paper), ketones (Ketostix, Bayer, Basel, Switzerland), density (refractometry, Digit012, Medline, Chalgrove, Oxfordshire, UK), and volume (weight, not corrected for density). Remaining clinical chemistry analyses were carried out at a hospital laboratory (Karolinska University Hospital, Huddinge, Sweden) and in the research laboratories of the Department of Internal Medicine at Karolinska University Hospital and the Toxicology Laboratory at AstraZeneca R&D, Gärtuna, Sweden.
Overview of the crossover design in the experimental part
FS, food deprivation followed by sleep deprivation; SF, sleep deprivation followed by food deprivation.
The MD part used a parallel group design with participants (up to n = 33) as MD subjects and instructors (n = 10) as controls. Body weight was measured, and urine and capillary blood samples were analyzed before and then daily during the 3-day applied MD part of the course. Multiple deprivation participants where encouraged to find as many edibles as possible during the outdoor period by collecting roots, berries, leaves, and pine needles and by fishing (the latter generally gives very little contribution to the food intake). The instructors, acting as control subjects, ate normally during these days.
Statistics
Data are presented as arithmetic or geometric means with corresponding SEM, depending on the distribution of the data (symmetric and skewed upward, respectively). Hypothesis testing (P < .05) was carried out by repeated-measures analysis of variance followed by paired Student's t test without correction for multiplicity. The first day was used as the control level except when other time points are explicitly stated. (All statistical calculations were made in Excel 2007; Microsoft, Redmond, WA).
Results
Body weight was subject to a carryover effect in the crossover design. Therefore, data are shown both for each subgroup (FD before SD and SD before FD, respectively) in the experimental groups (Figure 1A) and also as the change from the previous day (present day minus previous day; Figure 1B). There was a drop of 0.5 to 1 kg, or 0.7% to 1.5% body weight, during the first day of outdoor living in both MD and controls (Figure 1C) and also in the subgroup starting with SD (Figure 1A). Body weight decreased by approximately 1 kg/d or 1.5% during FD and MD conditions. Intake of 500 kcal during 24 hours reduced the weight loss by about 50% compared with the last day of total FD. There was little effect of SD on body weight. On the first day of recovery after FD the subjects gained 2% of initial body weight or slightly more than 1 kg.
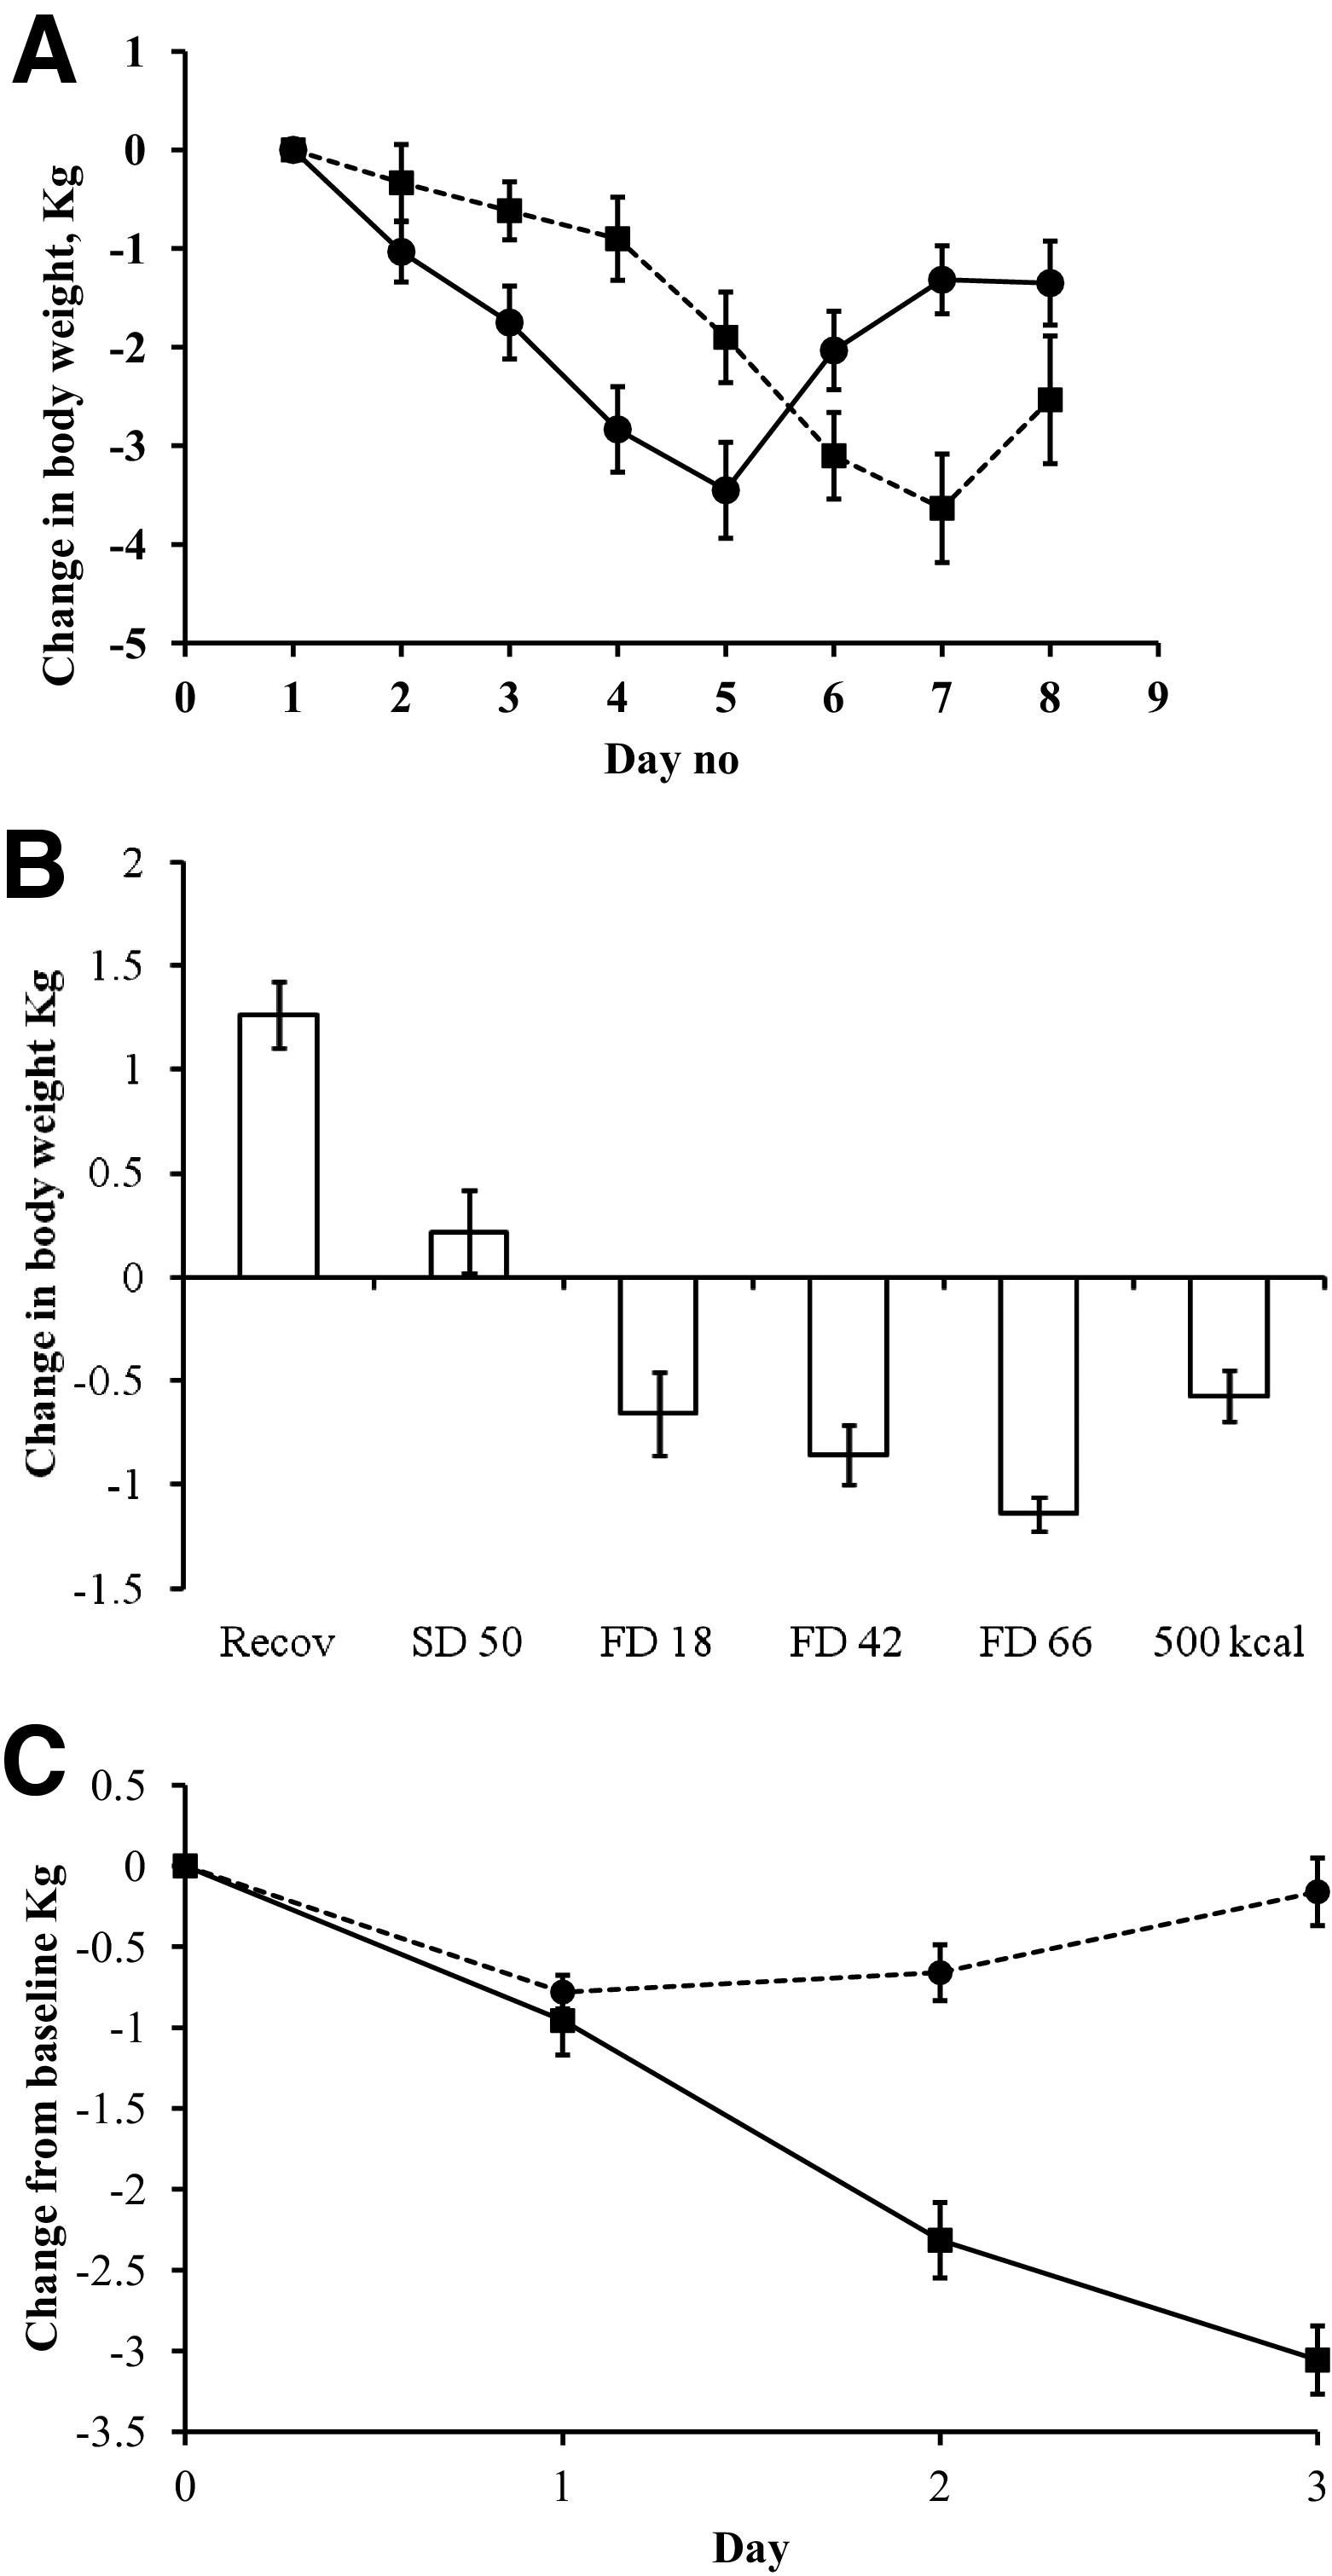
Mean (±SEM) change in body weight (kg). A, Food deprivation (FD) and sleep deprivation (SD) data. Each crossover arm is shown separately owing to the carryover (solid line, FD first, ie, group FS; hatched line, SD first, ie, group SF). Day number refers to the calendar day of the experiment. B, FD and SD data analyzed as change from previous day. Recov is the day after the 500 kcal intake day. C, Multiple deprivation data (solid line, participants; hatched line, control subjects).
Urine volume at baseline and during FD and SD varied up to 12-fold between subjects (mean, 1811 mL/24 h; range, 400–4950 mL/24 h). There was no overall significant effect of SD and FD on urine density, but volume was increased during SD. There was no correlation (r = 0.1) between change in body weight and the urine volume.
The relation between urine volume and density is shown in Figure 2. Using a power equation, the relationship is volume = 35.2 × (density – 1)–0.852. This equation was used to estimate urine volume in the observational study from urine density in morning spot samples to investigate the relationship to change in body weight. There was no significant correlation between change in body weight and urine volume in the observational data (r = 0.11).
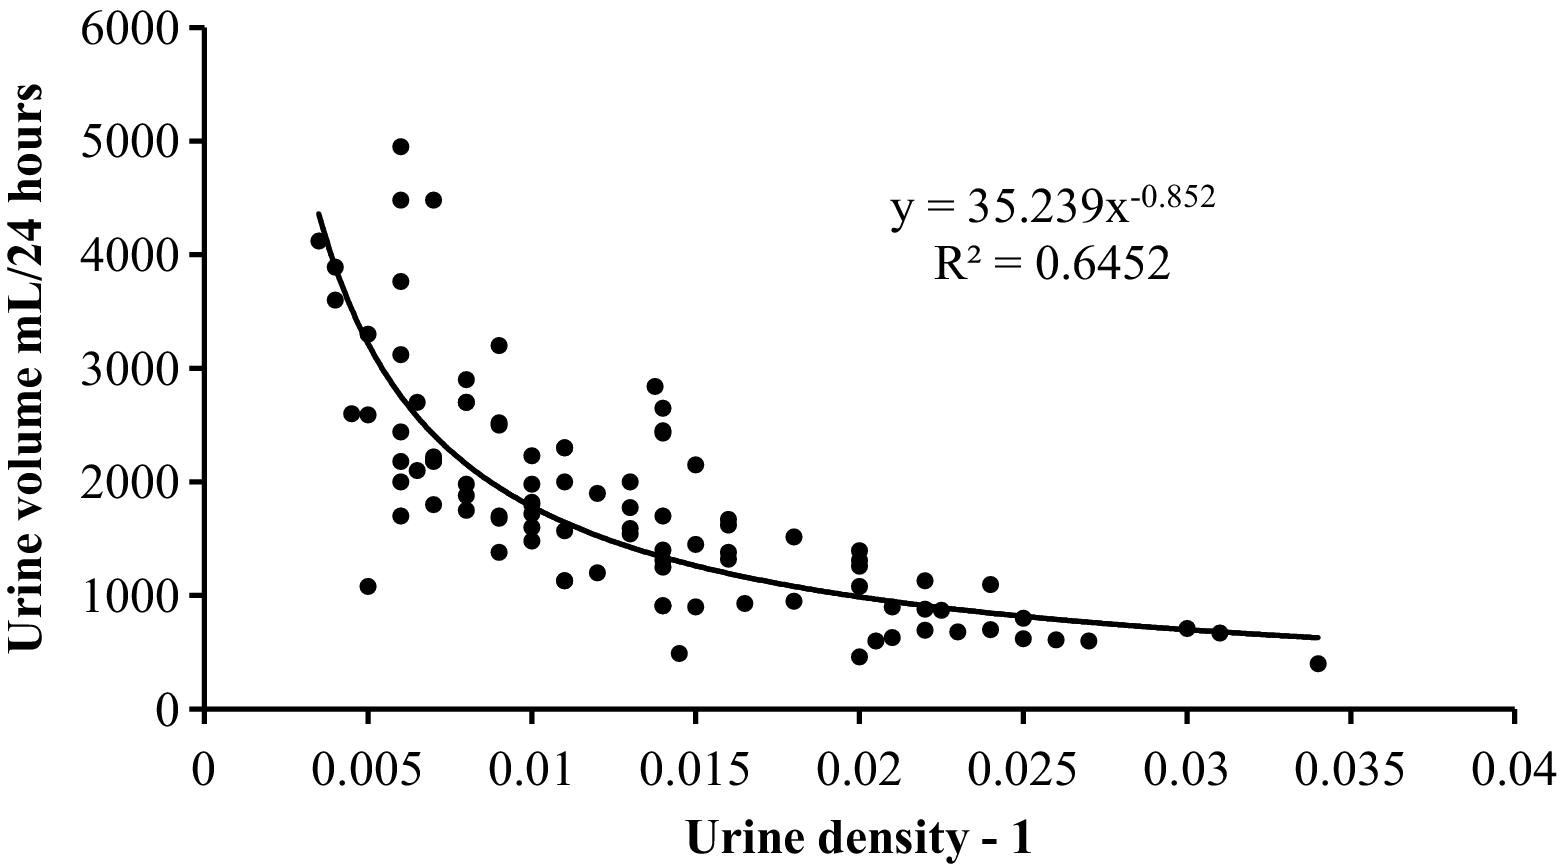
Urine volume as a function of urine density minus 1 from the food deprivation and sleep deprivation data.
In the experimental study serum sodium and chloride were both reduced to a small but significant extent during FD (Table 3). Sodium and chloride absolute levels as well as change from the day before FD were significantly correlated (r = 0.79 and r = 0.62, respectively). There was also an overall effect on serum potassium as a result of a difference between SD and FD, but neither condition differed from the control level. There was a slight reduction in serum chloride after 26 hours of SD, but no other statistically significant effect of SD on sodium and chloride was found. Serum creatinine was slightly but significantly increased during FD (Table 3).
Summary statistics for clinical chemistry variables a
B, blood; Control, baseline control day; EVF, erythrocyte volume fraction; FD18, FD42, FD66, food deprivation for 18, 42, and 66 hours, respectively; 500 kcal, intake of 500 kcal during the preceding 24 hours; SD26, SD50, sleep deprivation for 26 and 50 hours, respectively; S/P, serum/plasma; U, urine. F ratio and P values refer to repeated measures analysis of variance.
Results are presented as mean ± SEM.
Indicates difference compared with baseline using paired Student's t test with P < .05 not corrected for multiplicity.
There was a small but statistically significant reduction in blood glucose after 50 hours of SD (Table 3). The levels remained, however, at typical nonfasting levels.
Blood glucose decreased progressively after FD up to 66 hours. The lowest individual values were 1.9 and 2.1 mM. After MD, blood glucose declined to approximately 4 mM (Figure 3A). Capillary 3-hydroxybutyrate levels increased slightly after 18 hours of FD and reached 2.5 and 3.5 mM at 42 and 66 hours, respectively (Table 3). Triglyceride serum levels were decreased by FD (Figure 4A), whereas free fatty acids were increased (Figure 4B). In the urine there was a time lag in acetoacetate levels compared with capillary 3-hydroxybutyrate, reflecting that urine samples were collected for 24 hours and there was a close agreement between observational (Figure 3B) and experimental data (Table 3). Urinary pH decreased by up to 1 unit (Table 3). The excretion of urea in the urine declined the first day of FD but increased subsequently (Table 3). Intake of 500 kcal during 24 hours restored glucose back to baseline, reduced 3-hydroxybutyrate levels to 0.5 mM, and reduced urea excretion. Similar results were obtained for serum urea and also for serum creatinine except that this variable showed no decline during the first day of FD (Table 3).
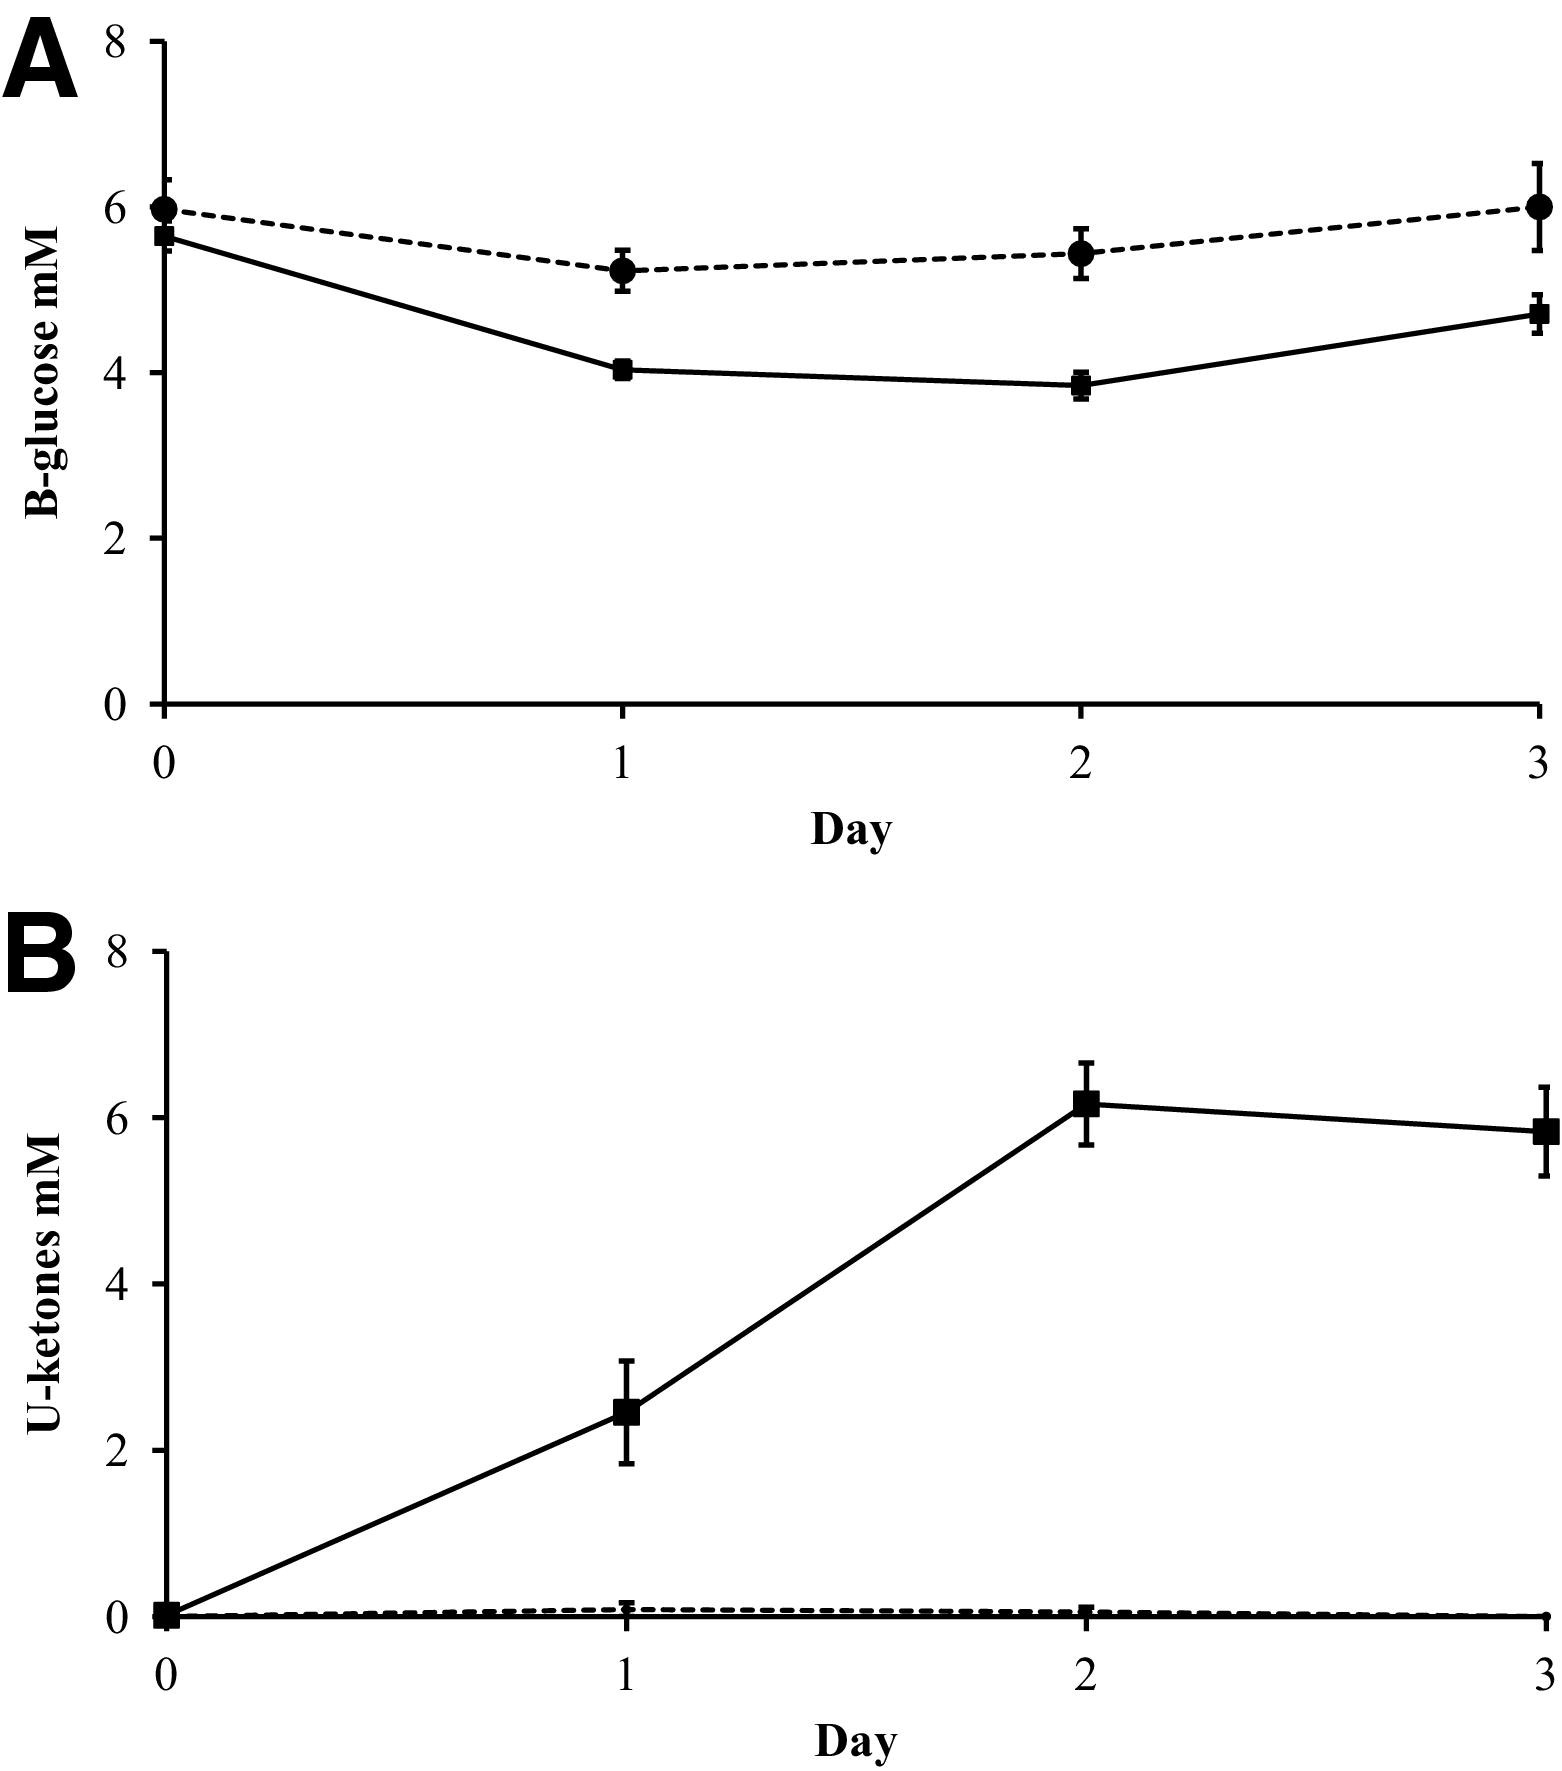
Effects of multiple deprivations on mean (±SEM) capillary glucose (A) and urinary ketones (B) measured as acetoacetate (solid line, participants; hatched line, control subjects).
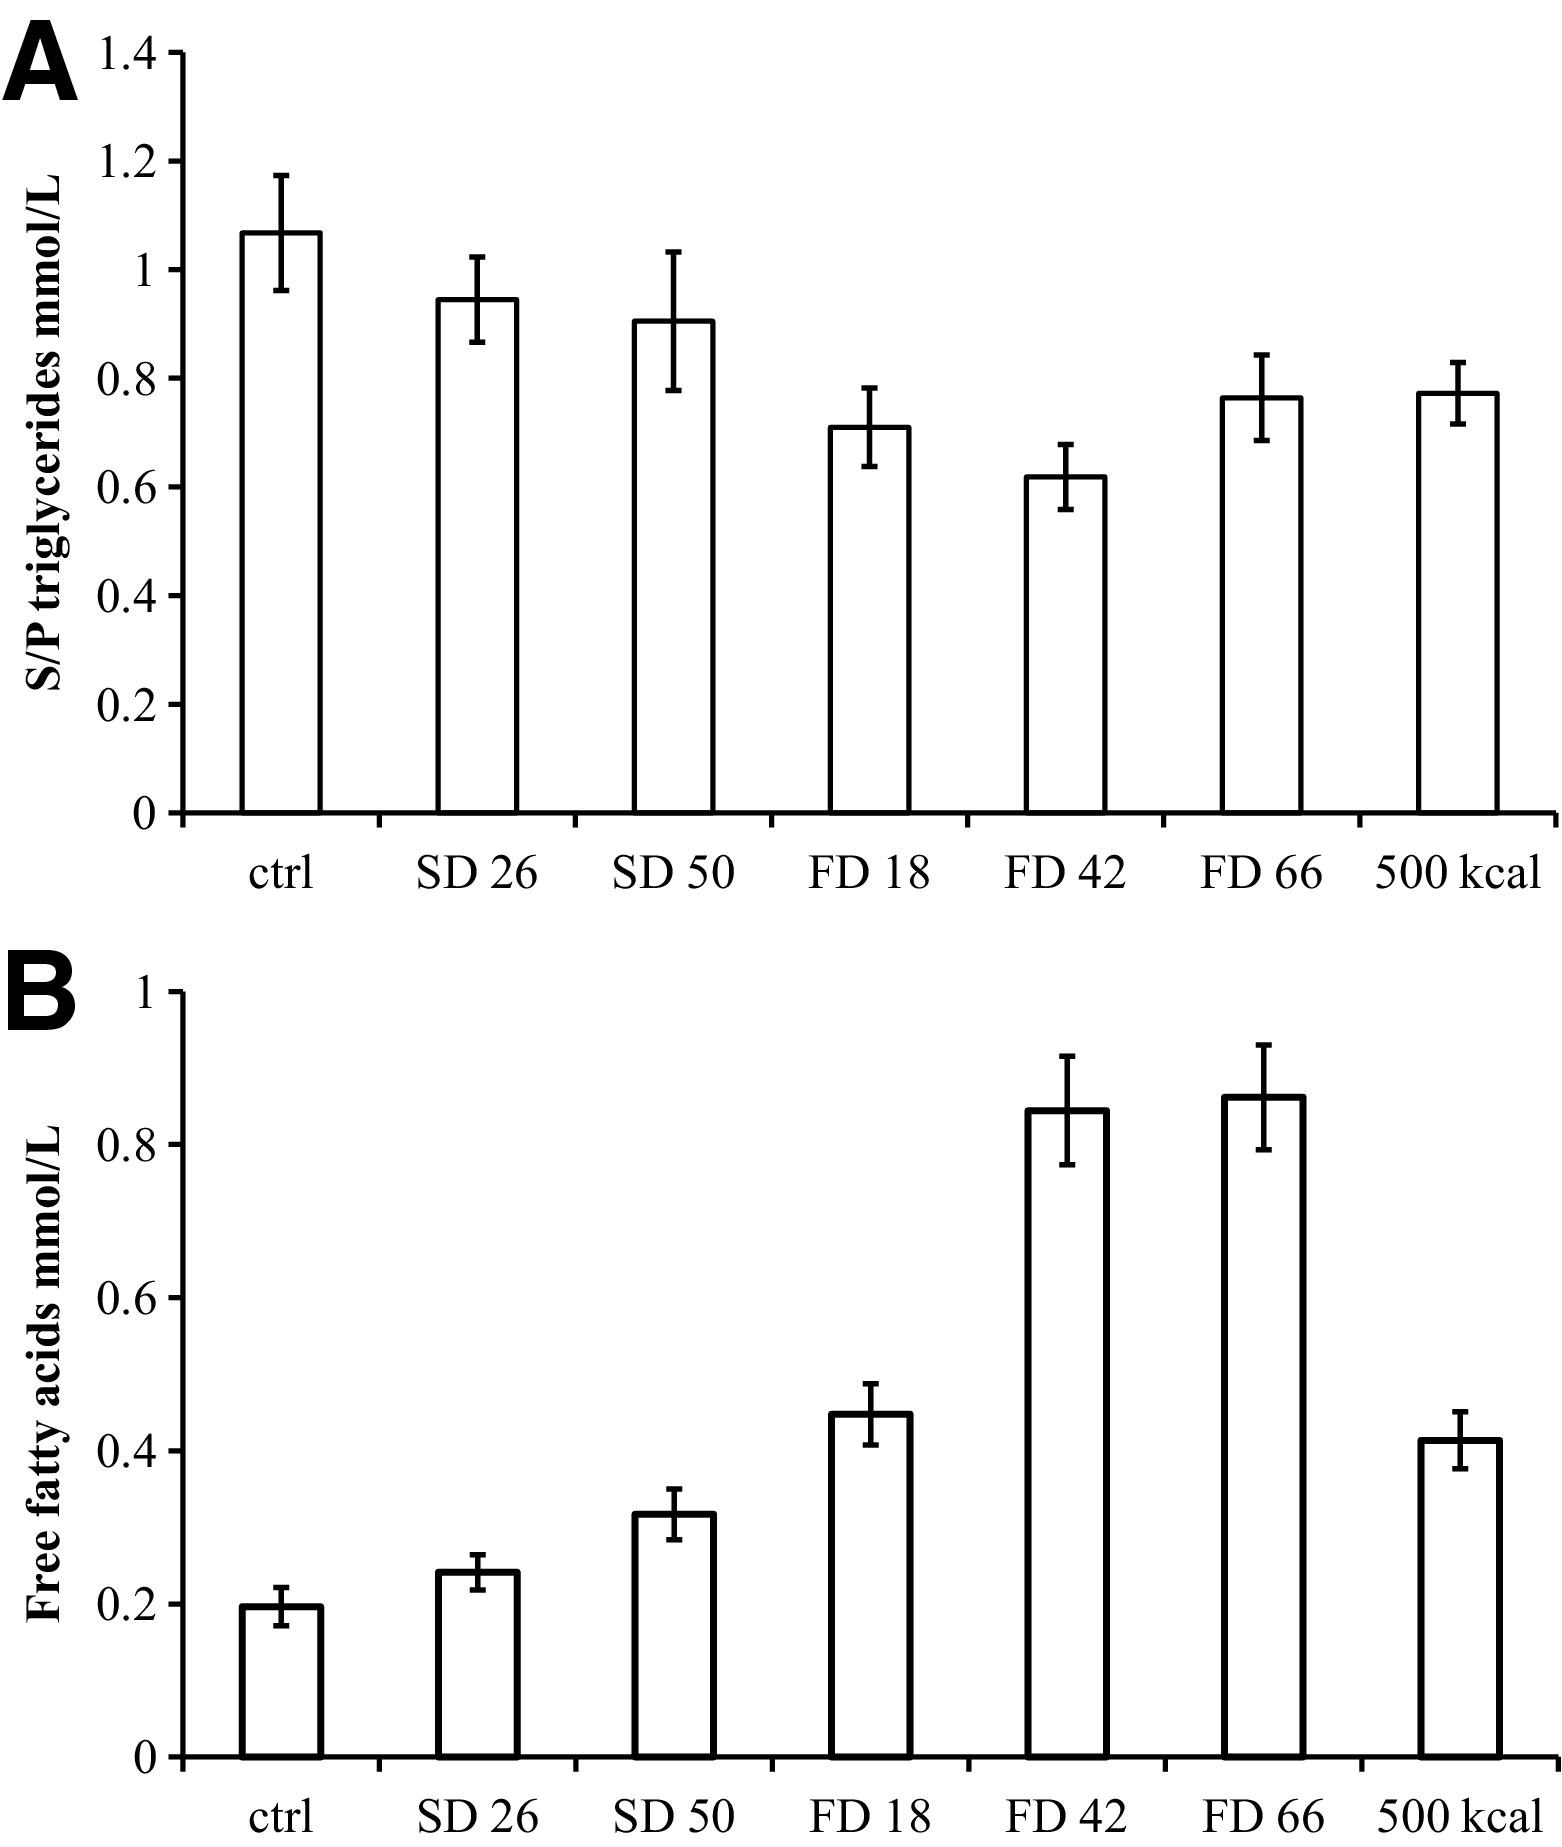
Effects of food deprivation (FD) and sleep deprivation (SD) on mean (±SEM) serum (S/P) triglycerides (A) and serum free fatty acids (B).
Food deprivation had little or no effect on hematological variables. There was an increase in leukocytes and a decrease in hemoglobin, erythrocyte volume fraction, and particle count after SD. There were no systematic effects on thrombocytes by FD or SD, but a small but statistically significant increase was observed after 18 hours of FD (Table 3).
Discussion
Body weight declined by about 1 kg/d or 1.5% of body weight during FD and MD, where there is a lack of food. Sleep deprivation was not associated with weight loss. The observed weight loss is similar to that reported from winter survival studies 4 but slightly more rapid than reported from clinical controlled starvation in obese subjects 5 and is likely caused by the higher degree of physical activity in subjects undergoing survival training. The rapid gain of weight of 1 kg after 1 day of recovery is probably explained partly by filling of the gastrointestinal tract and partly by building up of glycogen stores.
There was no correlation between urine production and change in body weight, suggesting that within the observed variation in urine production (400–4950 mL/24 h), factors other than fluid intake determine changes in body weight. Also, the lack of change in hemoglobin and erythrocyte volume fraction suggests that the subjects were neither overhydrated nor dehydrated.6,7
The slight reduction in plasma sodium and chloride observed during FD may be related to the lack of electrolyte intake during FD.
The clinical chemistry changes observed after FD are consistent with the sequence of events described during starvation, i.e., initially a loss of carbohydrate stores accompanied by an increase in gluconeogenesis and production of ketone bodies. The changes observed in, eg, ketone bodies occurred more rapidly in the present study than in fasting obese subjects. 5 Probably both the larger energy expenditure during survival training and the fact that the participants were metabolically healthy may contribute to this difference. It is noteworthy that 1 subject had a blood glucose of 1.9 mM and 2 subjects, 2.1 mM after 66 hours of FD, which under clinical circumstances would be considered a medical emergency in a diabetic. The cognitive effects and hypoglycemia symptoms of FD have been described previously. 1
Urea plasma levels and urinary excretion are dependent on food intake. The observed reduction in excretion during the second day of FD and reduced plasma levels after 18 hours of FD are consistent with a reduced food intake. The increase again in urea excretion and plasma levels after continued FD is likely to be the result of amino acid utilization for gluconeogenesis. The drop in urea excretion and plasma levels after the intake of 500 kcal reflects the reduced need for using amino acids in gluconeogenesis to maintain glucose levels. Thus, the present data are in accordance with previous results suggesting that a small to moderate intake of carbohydrates may prevent protein breakdown. 4 ,8,9 Interestingly, Sapir et al 8 found that as little as 15 g of carbohydrates (i.e., about 60 kcal) reduced ammonium excretion by 50%, suggesting that much less carbohydrates are needed to reduce amino acid utilization for glucose production.
The only effects of SD observed in this study were a minor reduction in indices of erythrocyte concentration and an increase in leukocytes. It is likely that an increase in granulocytes is responsible for the increase in leukocytes. 10 It is less clear why there should be a reduction in erythrocyte concentration indices. One explanation may be that the subjects consumed more water during SD (urine volume was significantly increased), and it is well known that volume load dilutes blood.6,7 Further data are needed to provide an answer to this question.
It is concluded that civilian survival training results in a range of changes in clinical chemistry as described in this and other papers.2,3 Lack of food appears to have more consequences on routine clinical chemistry variables than lack of sleep. Physicians evaluating clinical chemistry data from patients subjected to short-term food or sleep deprivation should take the physiological state into account in their assessment.
Financial Disclosures
Lars Ståhle was an employee of AstraZeneca R&D during the study and is a shareholder of AstraZeneca and Medivir. Anders Samuelsson was an employee of AstraZeneca R&D during the study. Mats Rudling, Ewa Ljungdahl Ståhle, Elisabeth Granström, Sven Isaksson, and Harry Sepp have no interests to declare.
The contributions to this study by Lars Ståhle and Anders Samuelsson are unrelated to their employment at AstraZeneca.
Footnotes
Acknowledgments
The participants of the study contributed in many ways to the study and are hereby thanked first and foremost. Financial support has been provided by the Swedish Civilian Defence League, Karolinska Institute, and Abbott Sweden (analysis kits for capillary glucose and ketones were generously provided). The study was run at the training ground of the Swedish Home Guard School in Vällinge, Sweden, and the practical help provided was invaluable. Research Nurse Marta Stenberg at Clinical Pharmacology, Karolinska Institute, Huddinge, Sweden, helped out with many practical aspects of sample handling.