
Abstract
Sample preparation is the most time-consuming part of the analytical method for powder for oral suspension (POS) assay, purity, and preservative analysis, as this involves multiple dilution and filtration steps. The Tablet Processing Workstation (TPW) was used to automate the sample preparation of a POS formulation. Although the TPW is typically used to automate the preparation of solid oral dosage forms and powders, it contains all of the necessary components to perform POS sample preparation. The TPW exhibited acceptable repeatability in testing 3 lots using 10 replicate preparations per lot. Acceptable linearity of the drug and preservative in the presence of excipients was demonstrated over the range corresponding to 50–150% of intent. Accuracy showed suitable recoveries for all points evaluated. TPW results were shown to correlate to results obtained with the manual method. The TPW method was used to prepare samples in support of manufacturing scale-up efforts. With the efficiencies gained using the TPW, it was possible to analyze a large number of samples generated during process development activities for the POS formulation with minimal human intervention. The extensive data enabled trending of the manufacturing development runs and helped to identify optimization strategies for the process.
Introduction
A powder for oral suspension (POS) formulation is being developed for patients with difficultly swallowing tablets. During small-scale development (25 kg), the powder formulation was found to have properties indicating a high probability of segregation of the active pharmaceutical ingredient (API) during processing. Segregation occurs when particles of similar properties (e.g., particle size) concentrate in different locations because of multiple handling steps during manufacture. Common segregation mechanisms such as sifting and fluidization have been described in the literature. 1 Segregation of API and/or excipient during manufacture (e.g., blending and bottling) is undesirable as it can lead to unacceptable product containing low and/or high drug content or low and/or high preservative content. Because of this segregation potential, it was determined that commercial scale development batches would require sampling every 5 min during the bottling run to obtain data for process understanding and to monitor for any segregation of the API and preservative.
As the batch was sampled throughout the large-scale manufacturing run (100–200 kg sale) and multiple runs were performed, a large number of samples required analysis for API and preservative content to determine sample homogeneity during the manufacturing runs. Spectroscopic Process Analytical Technology (PAT) methods were shown to be effective at monitoring blend uniformity during the blending step but not for individual bottles during the bottling operation.
Sample preparation and extraction of the API from dosage forms is often the most time-consuming portion of the sample analysis process. The manual sample preparation method for this POS product involves reconstituting the POS by adding a fixed quantity of diluent to the bottle and shaking to form a homogenous suspension. An aliquot is then taken and filtered for HPLC analysis to determine the potency of the preservative and purity of the sample. A second aliquot is also taken to make a subdilution. An aliquot of this subdiluted solution is taken and filtered for HPLC analysis to determine the potency of the active ingredient. Manual filtration of the POS suspension is challenging, as it is difficult to push the suspension through the filter because of the presence of suspending agent, which causes the suspension to be extremely viscous.
The Tablet Processing Workstation (TPW) is an automated benchtop robotic system designed to prepare solid samples such as tablets, capsules, blends, and granulations. Papers are available in the literature describing its use in preparing tablets, 2 –6 capsules, 7 and medicated animal feed. 8 The TPW consists of the following components: a sample rack that allows queuing of up to 100 samples, a robot arm, a homogenization station to disperse and extract samples, a dilution station, a vortexer, an in-line filtration system, and an injection valve to allow injection of samples onto an HPLC system. The TPW contains all the necessary components to perform POS sample preparation: a robust filter station, a vortexer for mixing, and the ability to perform serial dilutions with gravimetric delivery confirmation. The evaluation and use of the TPW for preparation of POS samples to support manufacturing scale-up is discussed. The results obtained enabled the project team to identify issues with the manufacturing process.
Experimental
Reagents and Solvents
Acetonitrile, methanol, triethylamine (TEA), and phosphoric acid were HPLC grade (J.T. Baker; Phillipsburg, NJ). Trifluoroacetic acid (TFA) was also HPLC grade (Pierce; Rockford, IL). All other chemicals were of pharmaceutical or analytical grade. Purified water (Millipore Milli-Q) was used for all the solution preparation. The diluent consisted of a mixture of 50 mM TEA at pH 3.0, methanol, and acetonitrile (58:25:17, v/v/v).
Samples and Standards
POS (product) and API reference standard manufactured by Pfizer was used for all the development work. The formulation consists of API, sweeteners, flavoring agent, whitener, preservative, buffering agents, glidant, and suspending agent.
Instrumentation and Methods
Comparison of the manual and TPW sample preparation
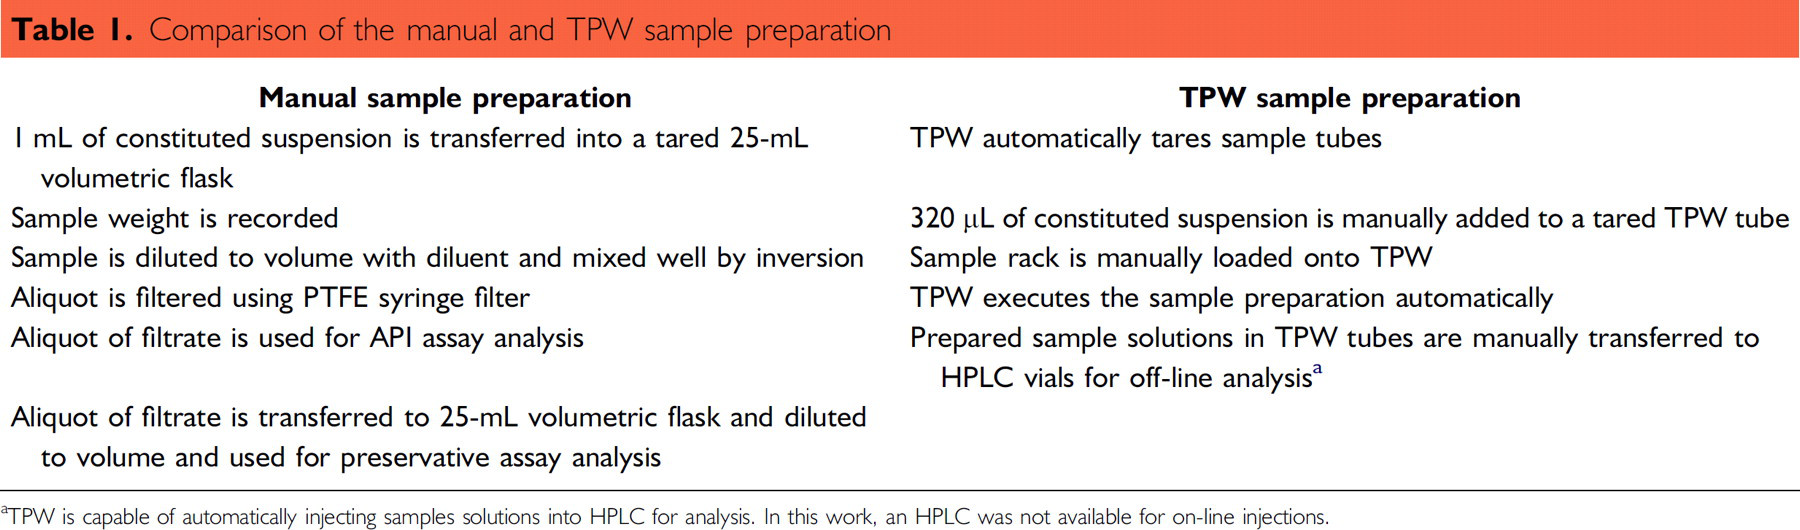
TPW is capable of automatically injecting samples solutions into HPLC for analysis. In this work, an HPLC was not available for on-line injections.
This solution was used for preservative (off-line HPLC injection) analysis. A 1:25 dilution was also performed on this sample by the TPW by diluting 320 μL to 8.0 mL with diluent. The solution was vortexed at speed 2 for 10 s. This sample was used for off-line assay analysis. A cleanup step was then executed to prepare the system for the next sample by washing the filter path two times with 3 mL of diluent. The total preparation time was approximately 15 min per sample.
Sample aliquots for preservative assay analysis were analyzed by HPLC with UV detection. Analyses were conducted using an HP-1100 system (Agilent; Palo Alto, CA). The mobile phase consisted of 0.1% TFA in water and 0.1% TFA in acetonitrile. The initial elution was 80% mobile phase A (0.1% TFA in water) and 20% mobile phase B (0.1% TFA in acetonitrile). The elution was altered gradually for the first 8 min to 50% mobile phase A. The initial eluent composition was restored in 0.1 min and maintained for additional 4.9 min to re-equilibrate the column. The flow rate was 0.6 mL/min, the injection volume 10 μL, the column temperature 40 °C, and the detection wavelength 230 nm. A Zorbax SB-C18 Solvent Saver Plus column (Agilent; Palo Alto, CA), 3.0 mm × 100 mm, and 1.8 μm was used throughout the experiments. Standard solutions were prepared with mobile phase for external quantitation. The nominal concentration of preservative was 0.040 mg/mL.
TPW Sample Preparation Method Development
TPW method conditions were chosen to match the validated manual method as closely as possible. Dilution volumes were selected to maximize the amount of sample used while maintaining the same dilution ratios as the manual method. The maximum allowable volume in the tube was limited to 8 mL by the TPW software. Because of the large amount of suspended particles in the sample, filtration was the most challenging part of the method development. Several different types of filters were evaluated and conditions were adjusted to optimize sample throughput.
Results and Discussion
TPW Method Development
Most of the method development work for the TPW focused on the filtration step. After prewetting the filter with a few milliliters, it was necessary to obtain sufficient filtrate (∼3 mL) for the potency dilution step and still have enough volume left over to fill an HPLC vial for the off-line preservative analysis.
As shown in Table 2, several filters were evaluated. Clogging of the membrane and high or medium back pressure prevented the required amount of sample to be collected. Glass fiber filters with a larger pore size (1 μm) did not have the high or medium back pressure issue, but the filter allowed some of the suspended particles to pass through the membrane.
Filter selection results
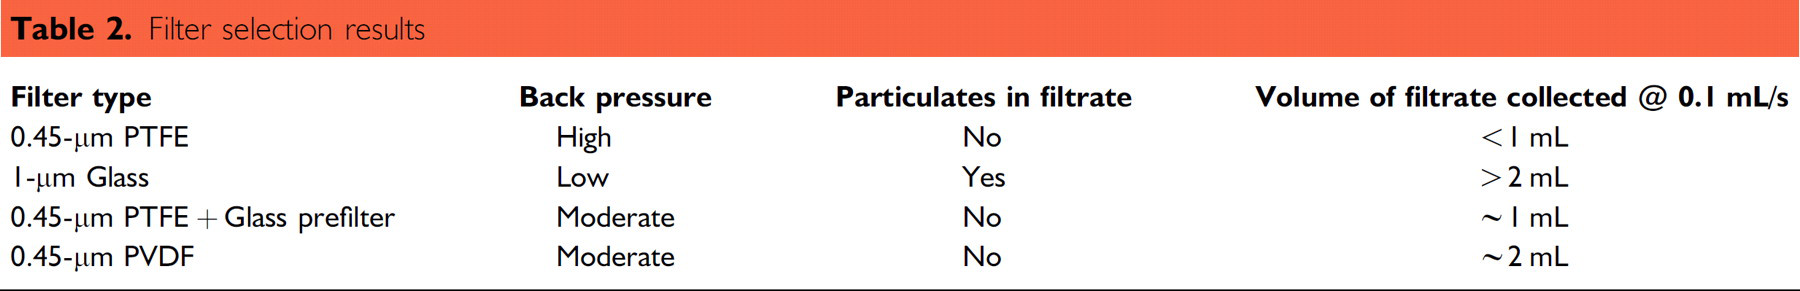
In addition to membrane type, an important factor that affects sample throughput when filtering is the rate of filtration. On the TPW, this was initially set at its default value of 0.1 mL/s. Lowering this rate decreases the amount of back pressure on the filter. The minimum rate allowed by the system is 0.01 mL/s. It was found that a value of 0.02 mL/s when using the PVDF filter provided a sufficient amount of filtrate for the analysis.
Sample evaporation of solutions in the sample test tubes can bias results when using volatile solvents with the TPW with off-line HPLC analysis. For the POS, which uses a diluent consisting approximately 40% organic, this problem was overcome by limiting the time that sample solutions were left in the instrument before analysis and by using evaporation resistant caps.
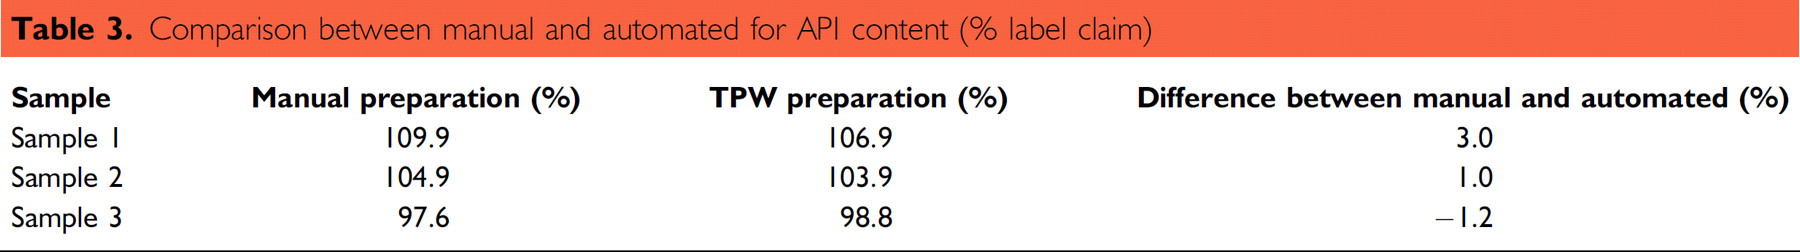
Manual vs TPW
Comparison between manual and automated for API content (% label claim)
These data indicate that the API peak area is linear over the concentration range of 0.008–0.024 mg API/mL in the presence of excipients and using the chromatographic parameters described in the test procedure. The
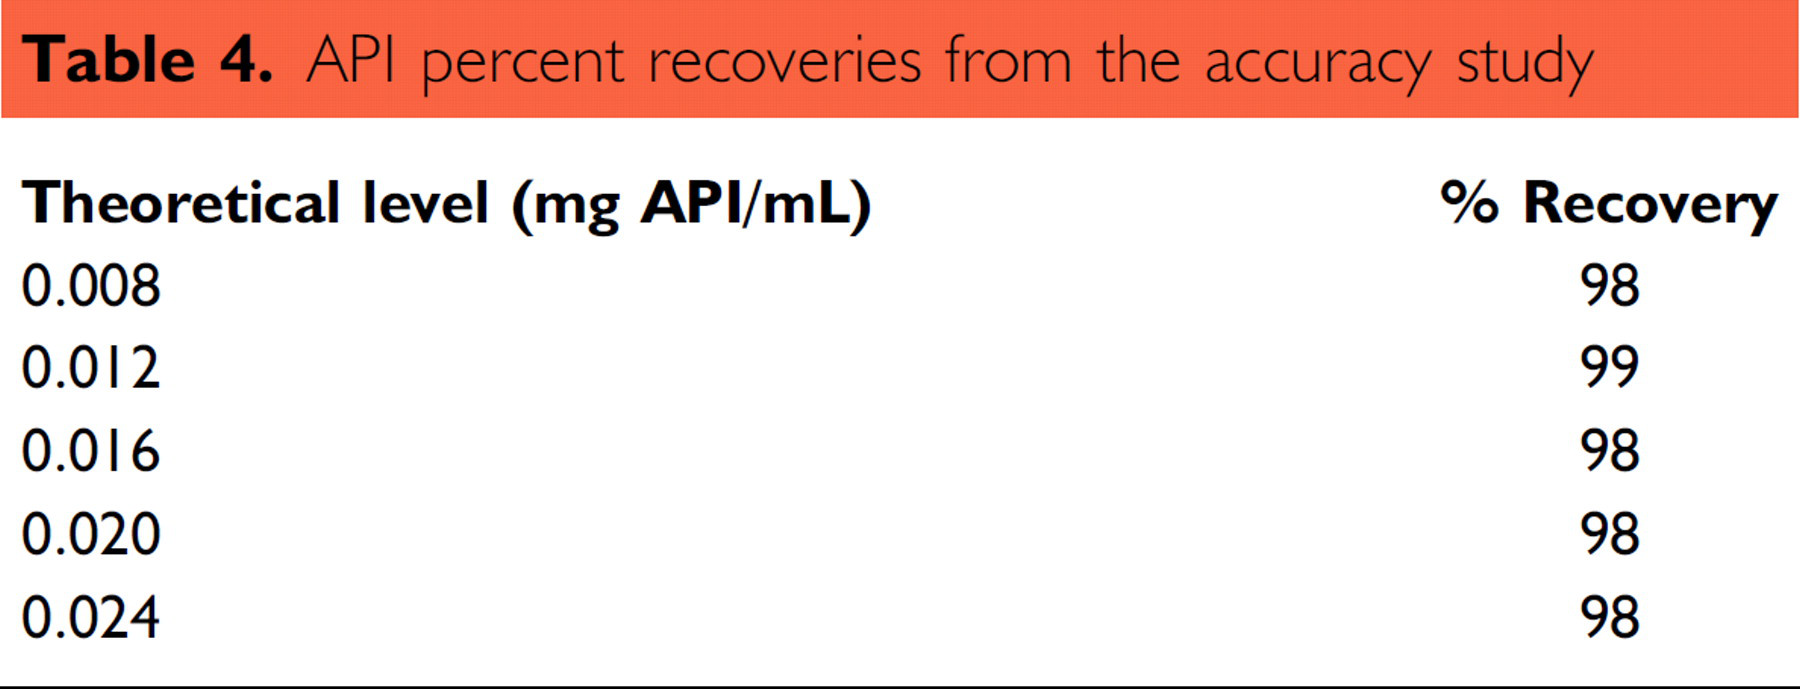
Samples from the linearity at 50%, 75%, 100%, 125%, and 150% of the nominal assay concentration were used for accuracy evaluation. Recovery of API was determined for each sample through comparison of the response factors to that of a working standard prepared at the intended concentration (0.02 mg API/mL). Results are shown in Table 4. The data demonstrate full recovery of API over the range of 50–150% (0.008–0.024 mg API/mL) of the nominal assay concentration. The percent recoveries were considered acceptable (e.g., within 97–103%).
API percent recoveries from the accuracy study
These data indicate that the preservative peak area is linear over the concentration range of 0.02–0.06 mg preservative/mL in the presence of excipients and API using the chromatographic parameters described in the test procedure. The
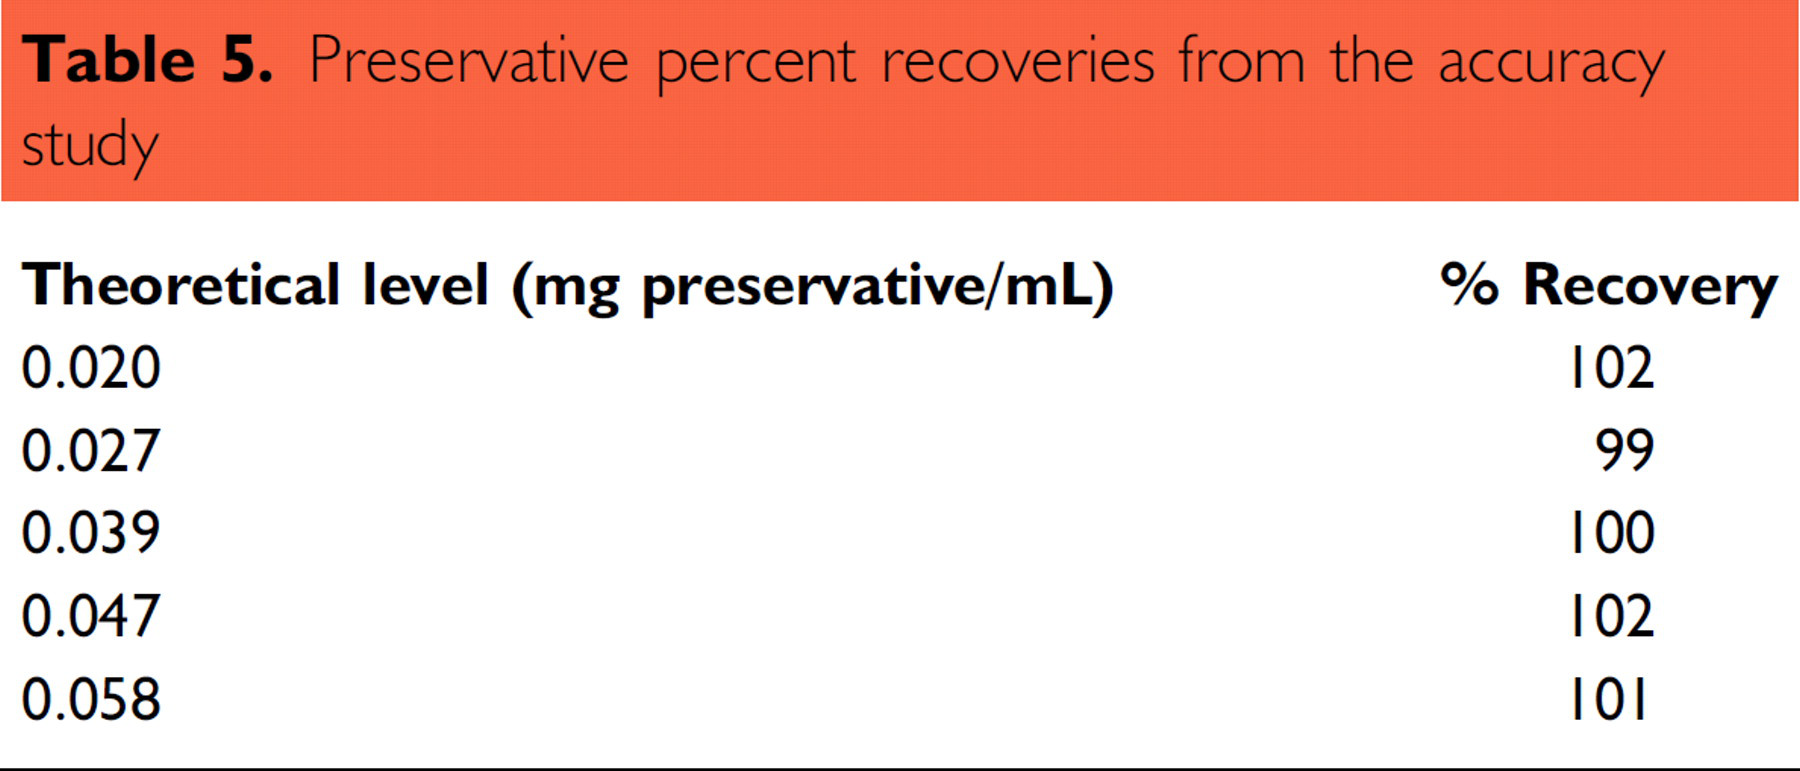
Samples from the linearity at 50%, 70%, 100%, 120%, and 150% of the nominal assay concentration were used for accuracy evaluation. Recovery of preservative was determined for each sample through comparison of the response factors to that of a working standard prepared at the intended concentration (0.04 mg preservative/mL). Results are shown in Table 5. The data demonstrate full recovery of preservative over the range of 50–150% (0.02–0.06 mg preservative/mL) of the nominal concentration. The percent recoveries were considered acceptable (e.g., within 97–103%).
Preservative percent recoveries from the accuracy study
Application to Process Development
Manufacturing campaignswere performed forthe POSprocess development. Often for POS manufacturing uniformity issues may arise late in the batch process. Typically only samples at the beginning, middle, and end of a manufacturing run are analyzed. Because the TPW minimizes manpower, the team was able to analyze samples throughout the entire bottling operation. With the additional information, the project team was able to gain more understanding of the manufacturing process.
The results of the first process development batch are presented in Figure 1. Results indicated that the batch was within the proposed specification for API and preservative (90–110%) from time 0 to 180 min. After 180 min, the values for both the API and preservative were variable and the API content spiked over 140% of the intended concentration at the end of the run. These results indicated that segregation of the API had occurred. The results for the next batch are summarized in Figure 2 and show a different trend. In this batch, the hopper was prefilled before the bottling process, so sampling did not start until 40 min. In addition, an agitator blade was added to the fill hopper in an attempt to reduce segregation. On the basis of the results of these studies, additional changes to the manufacturing process may be made and additional development runs will be performed. The TPW sample preparation will be used on the samples generated in these additional manufacturing runs to determine if the manufacturing changes correct the problems previously observed.
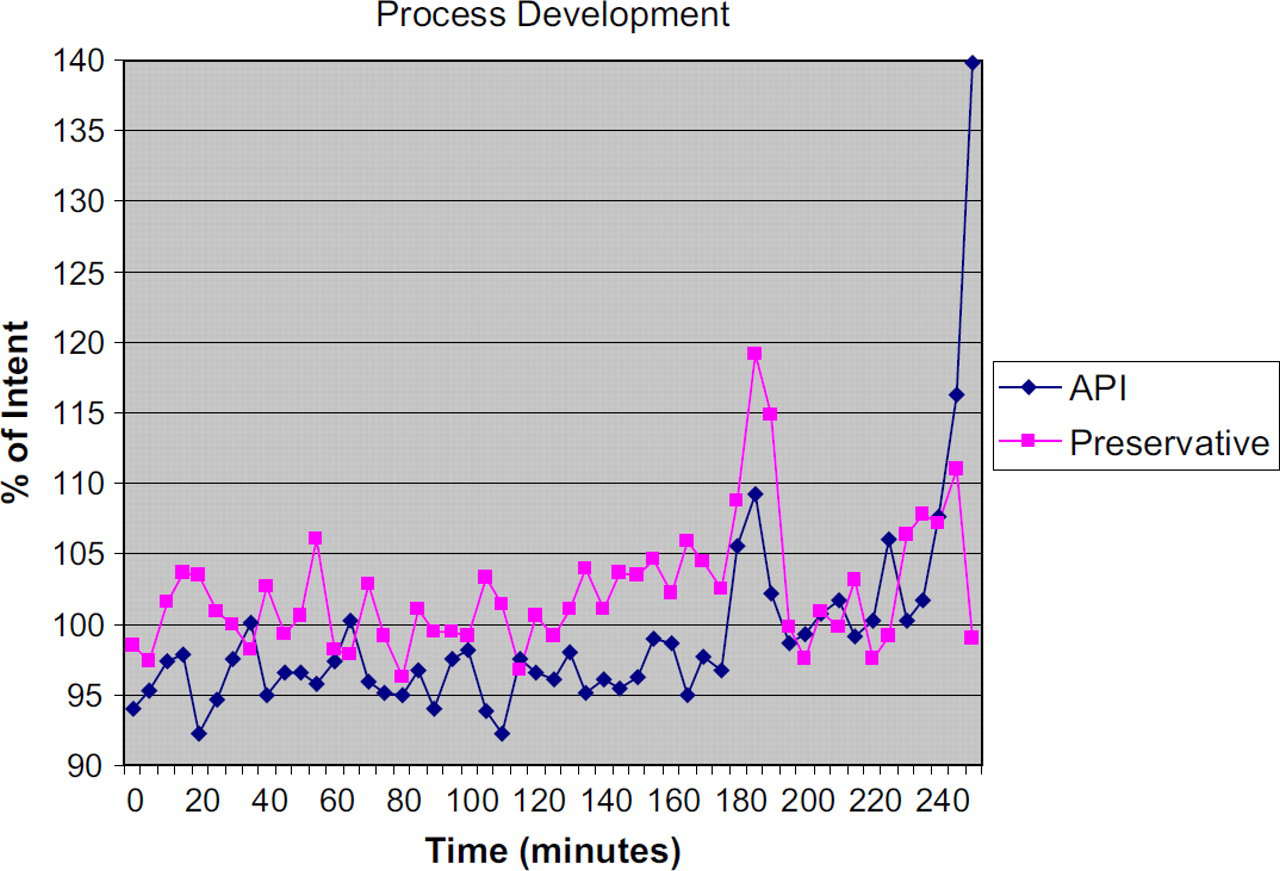
Results from a process development batch.
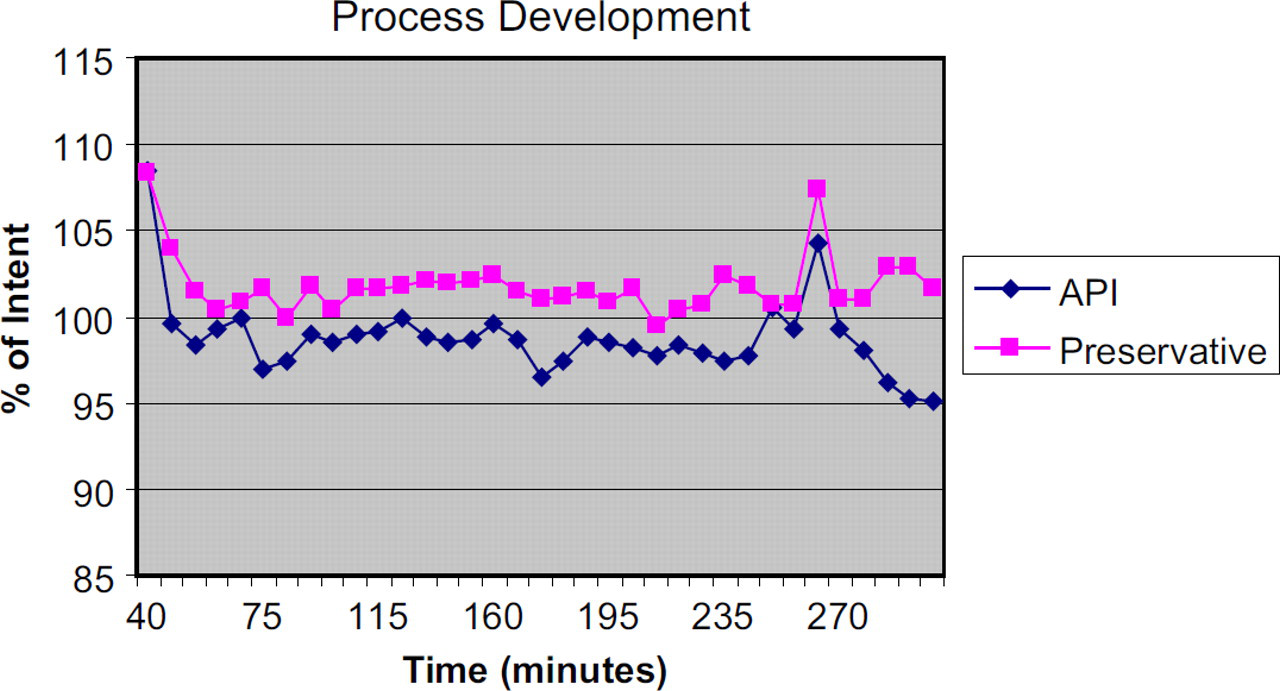
Results for another process development batch.
Conclusion
In this work, the TPW was successfully applied to automated dilution and filtration of a POS dosage form for API potency and preservative analysis. The methodology was evaluated for linearity, precision, and accuracy of API and preservative to establish the suitability of the sample preparation. The automation of the sample preparation process using the TPW increases precision by improving the mechanical consistency of all the steps in the sample preparation and minimizing human intervention.
The biggest advantage of automating sample preparation was the reduction in manpower required to perform sample preparation. For the POS, the manual preparation of one sample takes approximately 8 min. Nevertheless, to provide trending during scale-up activities a minimum of 100 samples were evaluated per manufacturing campaign, which translates to approximately 13 h of analyst time. Although the TPW takes longer to prepare an individual sample (∼15 min) because of the multiple weighings and rinses involved, it eliminates most of the analyst hands-on labor to prepare the samples. The automation offers considerable savings in manpower because only approximately 1 h was required for the set up of the instruments. The TPW can prepare samples 24 h a day with minimal human intervention, which dramatically increases efficiency and productivity.
The automated, unattended operation of the TPW allowed the analysis of significantly more in-process samples for POS than typically performed using manual sample preparation. This large data set provided process understanding and enabled quick determination and correction of the segregation problem encountered during scale-up of the POS bottling process. In addition to the work presented in this article, the TPW has been used to prepare POS samples to support stability studies and process development.
In this work, the sample solutions were analyzed off-line, but the TPW does have the capability to perform on-line HPLC injections after each sample is prepared. This capability can lead to additional efficiencies and overcome a potential source of error with the TPW. For example, sample evaporation of solutions in the TPW sample test tubes can bias results when using volatile solvents with off-line HPLC analysis. To mitigate this potential problem for this body of work, the time that sample solutions were left in the instrument before analysis was limited and evaporation resistant caps were used with the TPW sample tubes.
This work has demonstrated that along with its core functionality of solid dosage form extraction, the TPW provides a versatile and efficient sample preparation platform for automated sample dilution and filtration.
Acknowledgment
The authors would like to thank our colleagues Kimber Barnett and Matt Santangelo for their contribution to this project.