
Abstract
Formalin-fixed, paraffin-embedded (FFPE) tissue specimens represent a potentially valuable resource for protein biomarker investigations. In this study, proteins were extracted by a heat-induced antigen retrieval technique combined with a retrieval solution containing 2% SDS from FFPE tissues of normal nasopharyngeal epithelial tissues (NNET) and three histological types of nasopharyngeal carcinoma (NPC) with diverse differentiation degrees. Then two-dimensional liquid chromatography-tandem mass spectrometry coupled with isobaric tags for relative and absolute quantification (iTRAQ) labeling was employed to quantitatively identify the differentially expressed proteins among the types of NPC FFPE tissues. Our study resulted in the identification of 730 unique proteins, the distributions of subcellular localizations and molecular functions of which were similar to those of the proteomic database of human NPC and NNET that we had set up based on the frozen tissues. Additionally, the relative expression levels of cathepsin D, keratin8, SFN, and stathmin1 identified and quantified in this report were consistent with the immunohistochemistry results acquired in our previous study. In conclusion, we have developed an effective approach to identifying protein changes in FFPE NPC tissues utilizing iTRAQ technology in conjunction with an economical and easily accessible sample preparation method.
Keywords
I
FFPE tissue blocks are routinely prepared during the pathology characterization worldwide, stored at ambient temperature, and associated with clinical data, including patient treatment regimens and outcomes. Moreover, such vast archival material covers almost every conceivable condition, including rare diseases. Apart from its traditional use in histological evaluation and research in immunohistochemistry (IHC) for previously known proteins (Ramos-Vara 2005), the potential of FFPE tissue collections as an alternative to fresh-frozen tissues for biomarker discovery has come into realization (Hood et al. 2006; Nirmalan et al. 2008). Efforts and achievements have been made in unlocking proteins from formaldehyde-induced extensive protein/DNA/RNA crosslinking and in mining the FFPE tissue proteome by mass spectrometry (MS) (Ikeda et al. 1998; Crockett et al. 2005; Palmer-Toy et al. 2005; Shi et al. 2006; Fowler et al. 2007, 2008; Ronci et al. 2008; Xu et al. 2008). Additionally, comparisons of proteomic analysis of paired frozen and FFPE tissue specimens were reported (Hood et al. 2005; Guo et al. 2007). In a recent study, a 92% overlap of protein identifications between frozen and FFPE tissues was presented, and the difference in peptide characteristics between frozen and FFPE proteomes was reported to have little effect on the proteins identified (Sprung et al. 2009). The evidence for the equivalence of proteome inventories from FFPE and frozen tissue specimens supports FFPE tissue proteomics as a promising tool for retrospective biomarker discovery research.
We have set up a proteomic dataset of human normal nasopharyngeal epithelial tissues (NNET) and NPC (http://www.xyproteomics.org/en) based on our cumulative proteomic studies of the frozen tissues. NPC tissues utilized in our previous proteomic study, which included NPC proteome mapping and comparative proteomics, were mainly restricted to a single NPC tissue type, such as a low-differentiated or undifferentiated NPC that was available in frozen form (Li et al. 2007; Cheng et al. 2008a, b; Li et al. 2009; Peng et al. 2009). However, NPC is categorized into three histopathological types based on the degree of differentiation according to the World Health Organization (WHO) classification: type I is keratinizing squamous cell carcinoma, type II is non-keratinizing carcinoma, and type III is undifferentiated carcinoma, among which type I is especially rare in frozen form although available in FFPE form.
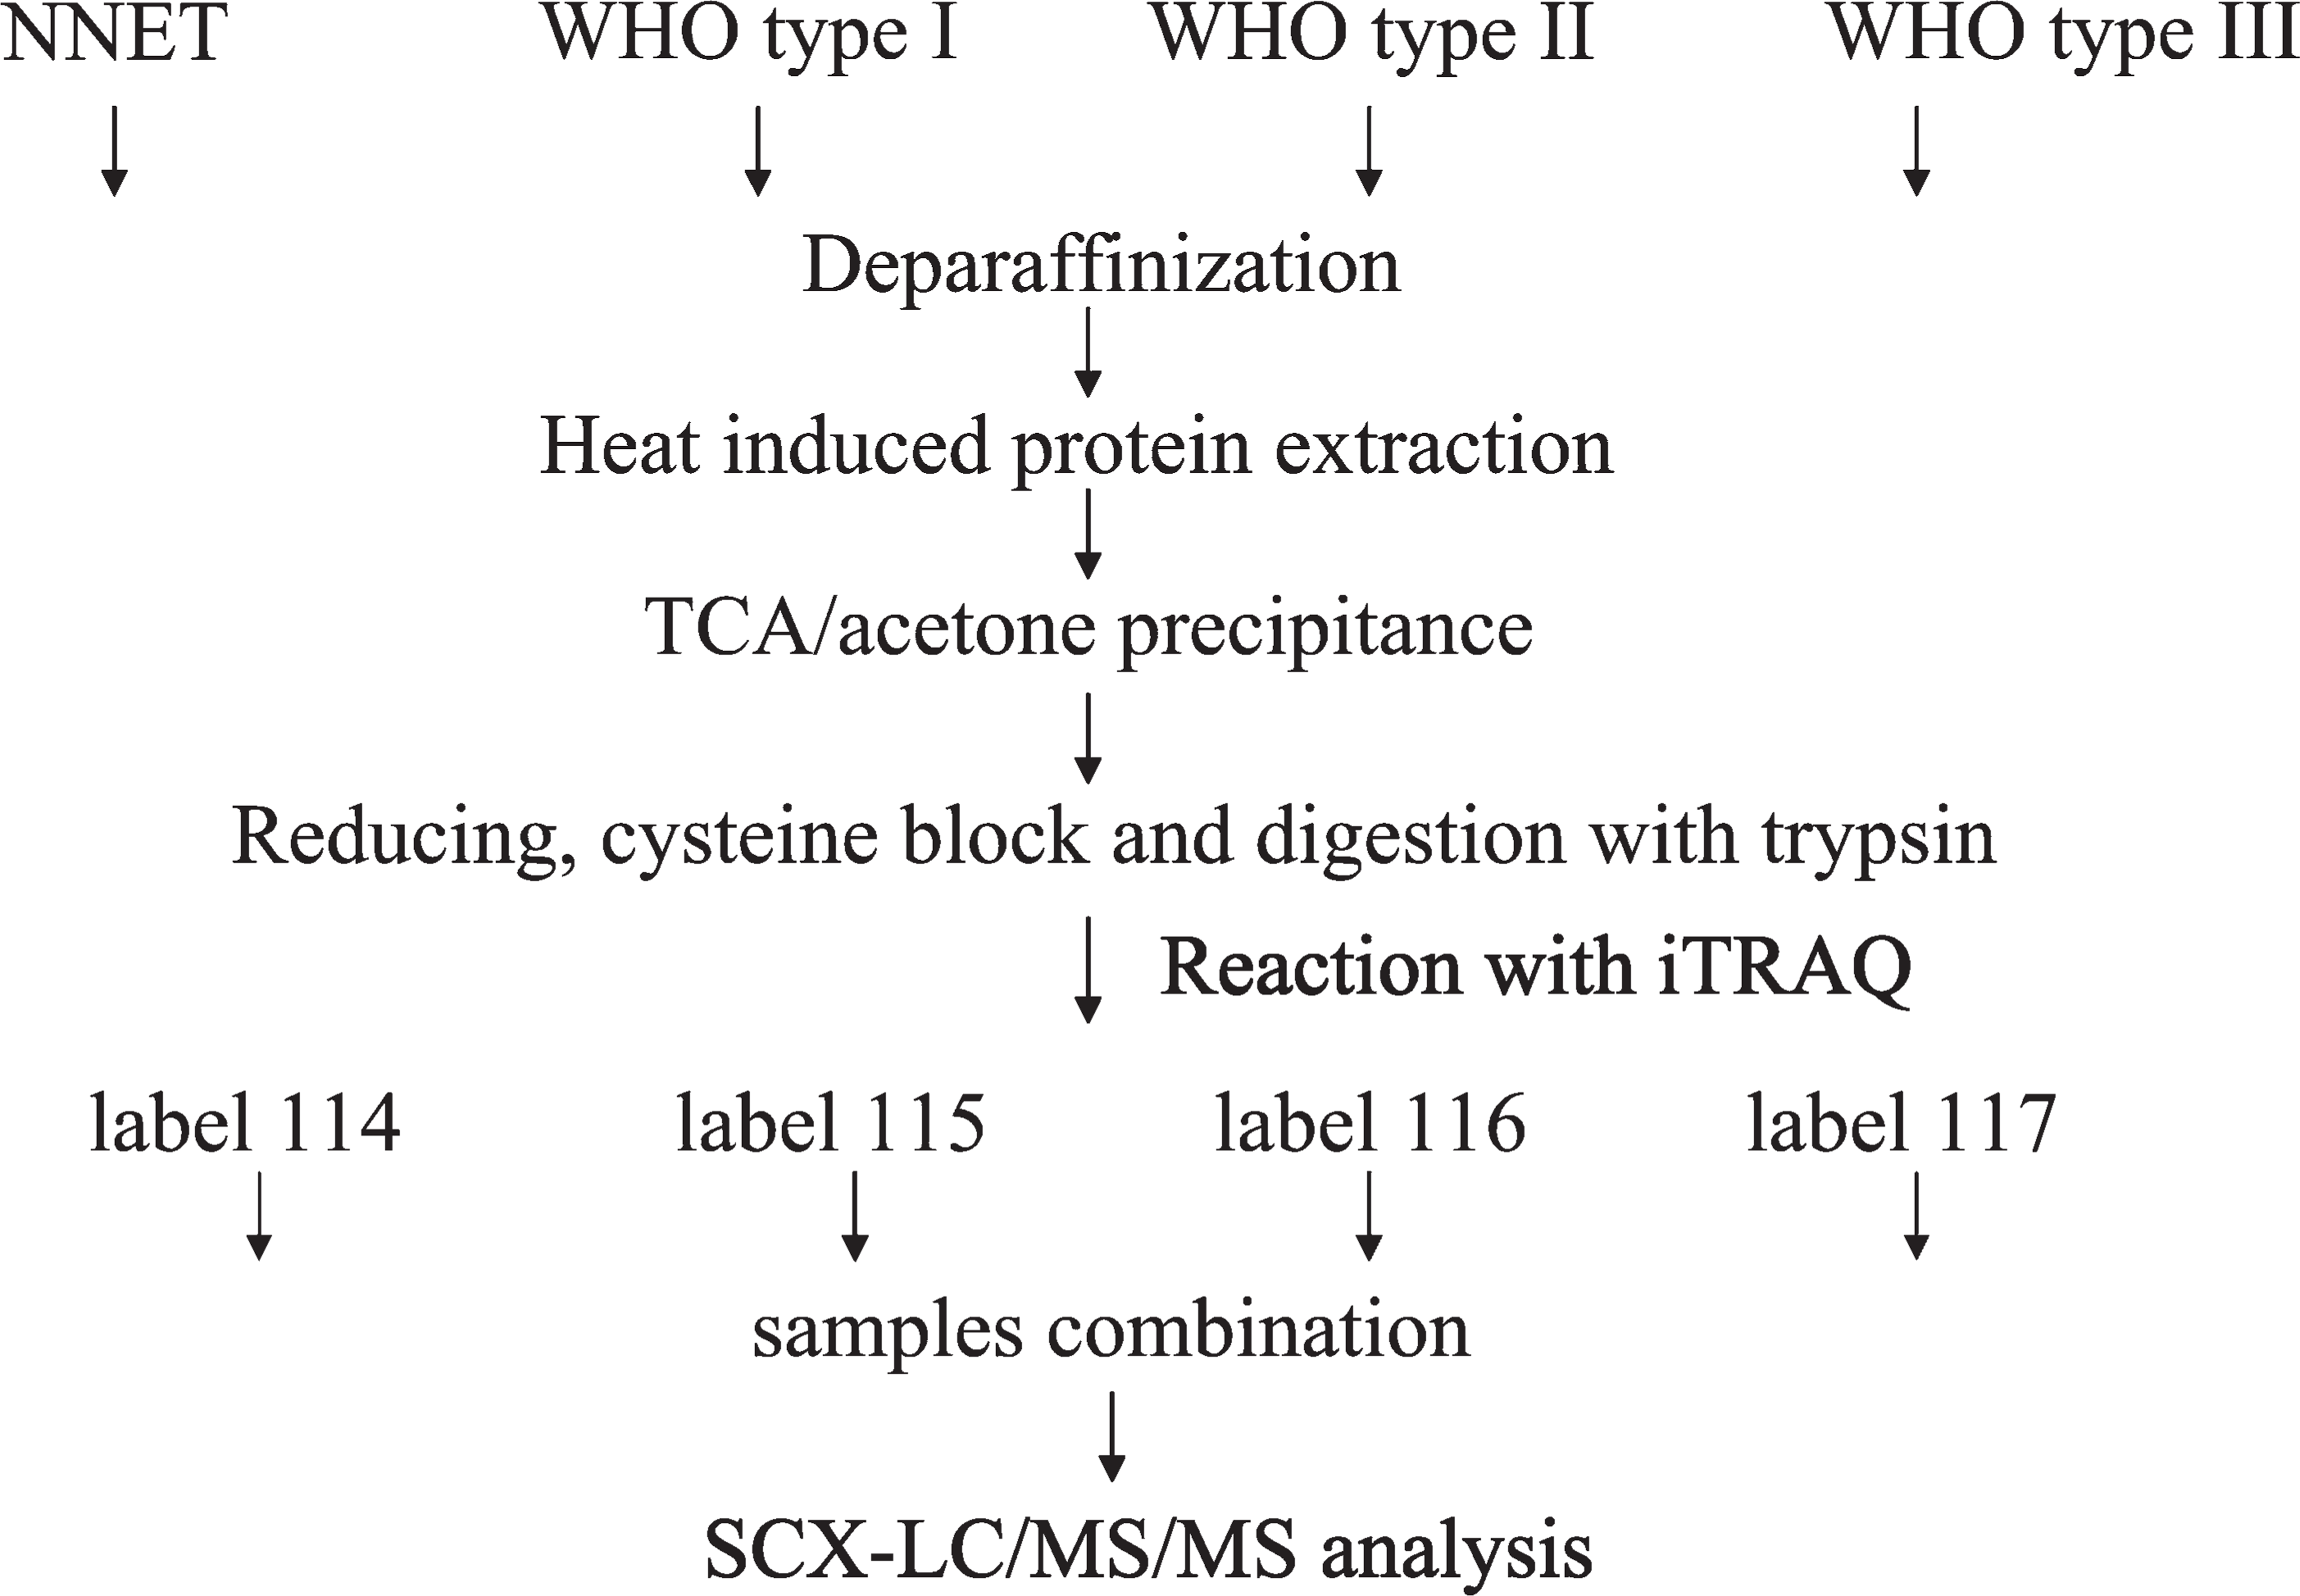
Strategy for isobaric tags for relative and absolute quantification (iTRAQ)-coupled two-dimensional liquid chromatography-tandem mass spectrometry (2D LC-MS/MS) analysis of normal nasopharyngeal epithelial tissues (NNET) and nasopharyngeal carcinoma formalin-fixed, paraffin-embedded (NPC FFPE) tissues. SCX, strong cation exchange; WHO, World Health Organization; TCA, trichloroacetic acid.
In the present report, we combined an easily accessible extraction buffer and heat-induced antigen retrieval (HIAR) technique to retrieve proteins from FFPE tissue specimens of NNET and the three histopathological types of NPC, followed by isobaric tags for relative and absolute quantification (iTRAQ)-coupled two-dimensional liquid chromatography-tandem mass spectrometry (2D LC-MS/MS) to undertake a high-throughput proteomic study to identify and quantify proteins differentially expressed among the three types of NPC tissues (Figure 1). This novel proteomics strategy resulted in 730 identified proteins, with a subcellular representation and function constitution highly similar to that of the proteins identified from the fresh NPC and NNET tissues. Among these proteins, the relative expression levels of cathepsin D (CTSD), keratin8 (KRT8), SFN (14-3-3 s), and stathmin1 (STMN1) were validated by IHC in primary NPC tissues with diverse differentiation degrees in our previous studies (Cheng et al. 2008a, b, c).
Materials and Methods
Reagents
Tris-base, SDS, and the 2-D Quantification Kit were purchased from Amersham Biosciences (Stockholm, Sweden). Octane and sequencing-grade modified trypsin were obtained from Sigma-Aldrich (St. Louis, MO). The iTRAQ Reagents Kit was acquired from Applied Biosystems (Foster City, CA). Acetonitrile (ACN) was from Fisher Scientific (Pittsburgh, PA). Formic acid (FA) was purchased from TEDIA (Fairfield, OH). KCl, KH2PO4, acetone, trichloroacetic acid (TCA), methanol, HCl, KCl, and KH2PO4 were obtained from Sinopharm Chemical Reagent Co., Ltd. (Shanghai, China). All buffers were prepared with Milli-Q water (Millipore; Billerica, MA).
Tissues
Forty cases of FFPE tissue specimens, including 10 cases of NNET and 10 cases of each differentiation type of primary NPC, including WHO type I, WHO type II, and WHO type III from 2003 to 2008 were retrieved from the Cancer Hospital of Hunan Province at the time of diagnosis before any therapy. The patients and healthy individuals signed informed consent forms for the study which was reviewed by the institutional review board. To minimize the contamination of stromal cells in the three histological types of NPC, hematoxylin-and-eosin–stained FFPE tissue sections matched for each FFPE block of NPC were judged and strictly screened to ensure that the sections continuously cut from each FFPE NPC block utilized in this study contained homogeneous cancer cells covering more than 80% of the complete section area.
Protein Extraction
Four unstained 7-μm-thick sections were cut from each FFPE block. The cut sections from the FFPE blocks of the same histopathological type were pooled into the same centrifuge tube so that there was a total of four tubes, for NPC types I, II, and III and NNET. FFPE sections were deparaffinized using octane, followed by the addition of methanol, vortexing, and centrifugation. Proteins were recovered from these FFPE tissues by following heat-induced retrieval conditions as described (Shi et al. 2006). Briefly, section pieces were treated with 20 mM Tris-HCl buffer (pH 7.0) containing 2% (w/v) SDS, followed by heating at 100C for 20 min and 60C for 2 hr in a water bath. After centrifugation at 12,000 × g at 4C for 30 min, the proteins were collected in the supernatant, quantified by the 2-D Quantification Kit, and stored at −80C until needed.
Protein Digestion and Labeling with iTRAQ Reagents
TCA-acetone precipitation was performed to purify the protein extracts (Jiang et al. 2004), with a minor modification. Briefly, a total of 100 μg of each sample was added with four times the volume of cold (-20C) acetone containing 12% (w/v) TCA, and the mixture was incubated overnight at −20C. Then the mixture was centrifuged at 12,000 × g at 4C for 30 min, the supernatant was removed without disturbing the visible pellet, and four times the sample volume of cold (-20C) acetone was added to the pellet. After incubation for 2 hr at −20C, with intermittent vibration and centrifugation as mentioned above, the supernatant was removed and the pellet was air dried. The protein pellets were then dissolved in the solution buffer, reduced, and blocked with cysteins, as described in the iTRAQ protocol. Each sample was digested with sequencing-grade modified trypsin with a protein-to-enzyme ratio of 20:1 at 37C overnight and then labeled with the iTRAQ tags as follows: NNET, iTRAQ 114 (IT114); WHO type I NPC, iTRAQ 115 (IT115); WHO type II, iTRAQ 116 (IT116); WHO type III, iTRAQ 117 (IT117). The labeled digests were then mixed and dried using a rotary vacuum concentrator (Christ RVC 2–25; Osterode am Harz, Germany).
Off-line 2D LC-MS/MS
The combined peptide mixture was fractionated by strong cation exchange (SCX) chromatography on a 20AD high-performance liquid chromatography (HPLC) system (Shimadzu; Kyoto, Japan) using a polysulfoethyl column (2.1 × 100 mm, 5 μm, 300 Å; The Nest Group, Southborough, MA). The mixed sample was diluted with the loading buffer (10 mM KH2PO4 in 25% ACN, pH 2.6) and loaded onto the column. Buffer A was identical in composition to the loading buffer, and buffer B was buffer A containing 350 mM KCl. Separation was performed using a linear binary gradient of 0–80% buffer B in buffer A at a flow rate of 200 μl/min for 60 min. The absorbance at 214 nm and 280 nm was monitored, and a total of 25 SCX fractions were collected along the gradient.
These fractions were dried down by the rotary vacuum concentrator, dissolved in buffer C (5% ACN, 0.1% FA) and analyzed on a QSTAR XL system (Applied Biosystems) interfaced with a 20AD HPLC system (Shimadzu). Peptides were separated on a Zorbax 300SB-C18 column (0.1 × 15 mm, 5 μm, 300 Å; Microm, Auburn, CA). The HPLC gradient was 5–35% buffer D (95% ACN, 0.1% FA) in buffer C at a flow rate of 0.3 μl/min for 70 min. Survey scans were acquired from m/z 400–1800 with up to four precursors selected for MS/MS from m/z 100–2000. Each SCX fraction was analyzed in duplicate.
Data Analysis
The MS/MS spectra were extracted and searched against the International Protein Index (IPI) database (version 3.45, HUMAN) using ProteinPilot software (version 3.0, revision 114732, Applied Biosystems). The following parameters were set in the searching: trypsin as enzyme, fixed modification of methylmethanethiosulfate-labeled cysteine, iTRAQ as sample type, no special factors, biological modification, thorough identification search. Other parameters, such as tryptic cleavage specificity, precursor ion mass accuracy, and fragment ion mass accuracy were built-in functions of ProteinPilot software, and the Paragon method was adopted. The raw peptide identification results from the Paragon Algorithm (Applied Biosystems) searches were further processed by the Pro Group Algorithm (Applied Biosystems) within the ProteinPilot software before final display.
Pro Group Algorithm reports two types of scores for each protein: unused ProtScore and total ProtScore. The unused ProtScore is a measurement of all the peptide evidence for a protein that is not better explained by a higher ranking protein, whereas the total ProtScore is a measurement of protein identification confidence taking into account all the peptide evidence for a protein. Identified proteins were grouped by the software to minimize redundancy, and unused ProtScore was used as a true indicator of the given protein or proteins within the group. The following criteria were required to consider a protein for further statistical analysis: unused ProtScore >1.3 with at least one peptide with 95% confidence per repetition; mean, standard deviation, and p values to estimate the statistical significance of the protein changes calculated by ProGroup. The candidate proteins were carefully examined in the Protein ID of the ProteinPilot software. False discovery rates (FDRs) for protein identifications were computated by the formula: FDR = (2 × reverse)/(forward + reverse). The relative expression of a peptide was calculated by dividing the iTRAQ reporter peak area observed at m/z 115.1, 116.1, and 117.1 by that observed at m/z 114.1. Protein expression ratios were computed based on the peak area ratios of the peptides accounting for the same protein. The bias correction algorithm was applied to correct for unequal mixing during the combination of the different labeled samples, based on the assumption that most proteins did not change in expression. All quant ratios (both the average ratio for proteins and the individual peptide ratios) were corrected for the bias. Protein quantification data with relative expression of >1.1 among iTRAQ 115, 116, and 117 in both repetitions were chosen for further study.
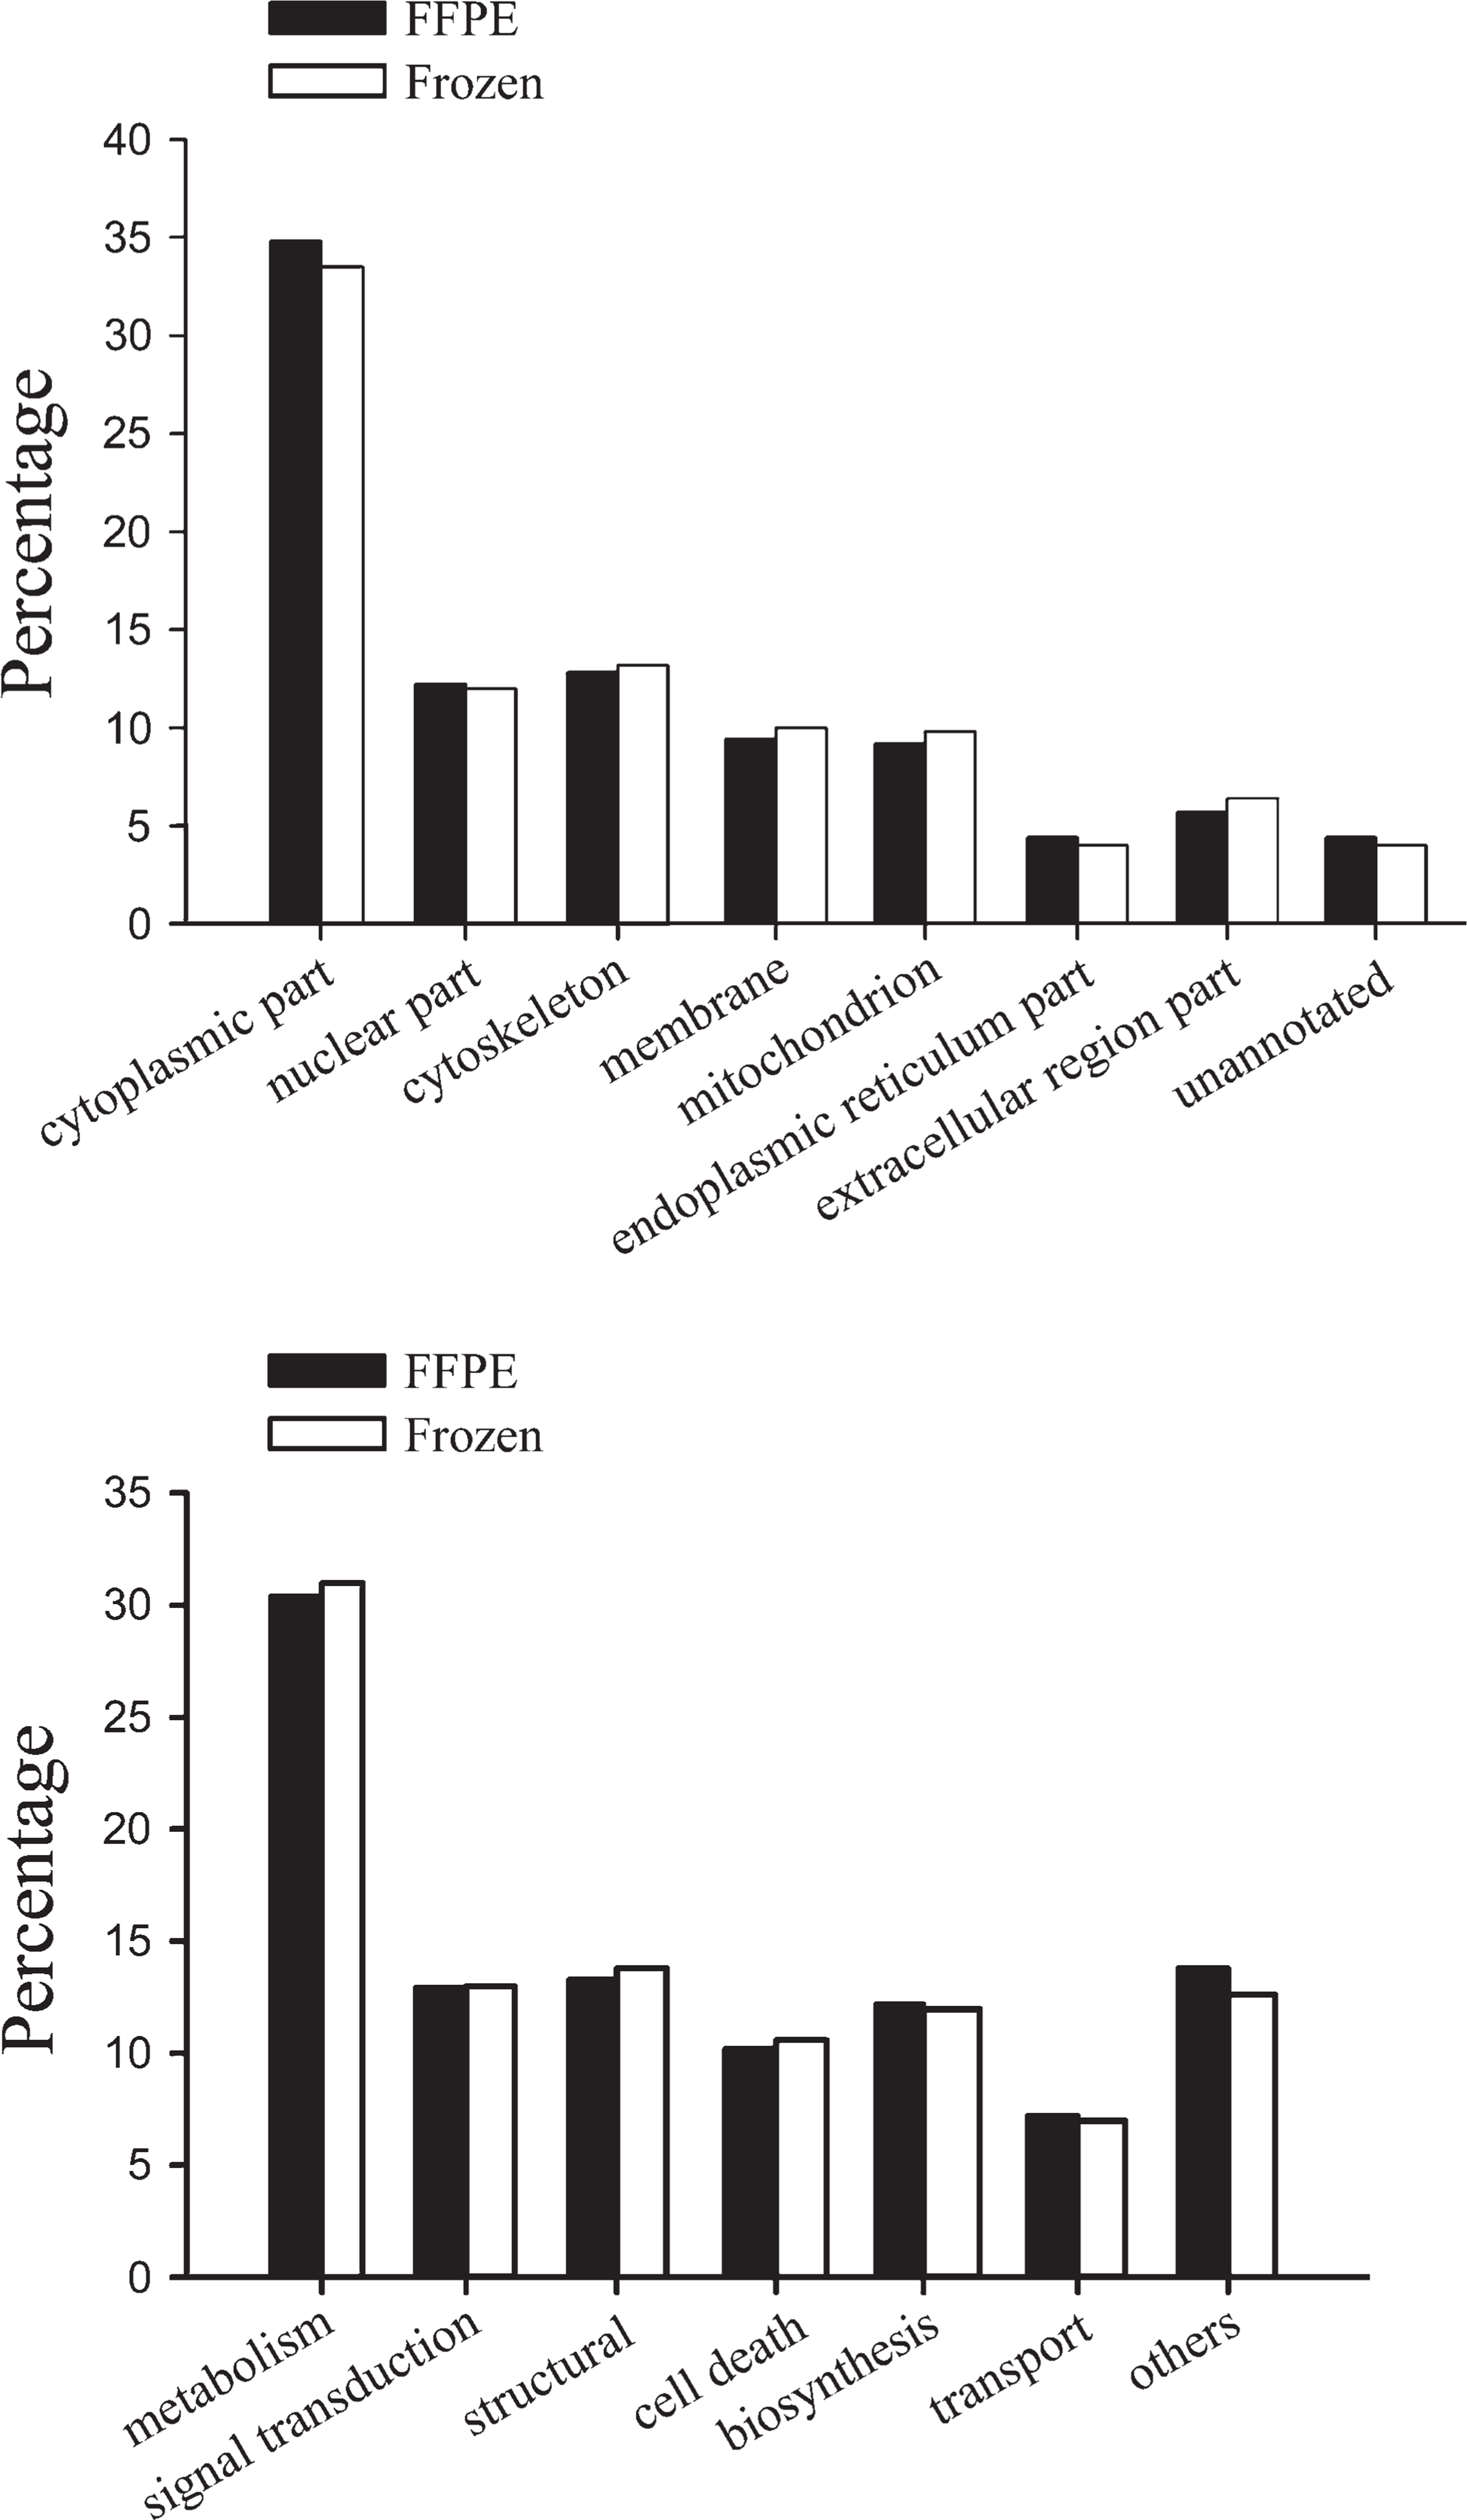
Annotated subcellular distribution (top panel) and molecular function distribution (bottom panel) of unique proteins identified from the two datasets of the frozen and FFPE tissues.
Summary statistics of proteomic result of International Protein Index data
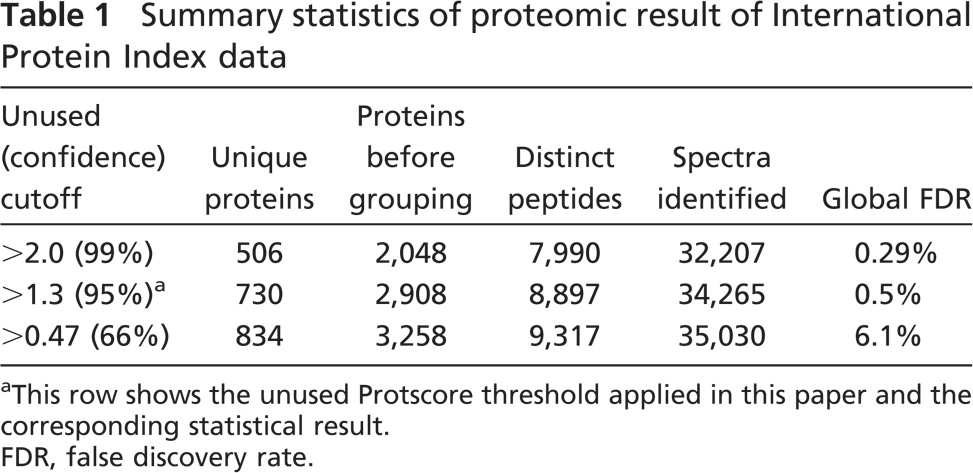
This row shows the unused Protscore threshold applied in this paper and the corresponding statistical result.
FDR, false discovery rate.
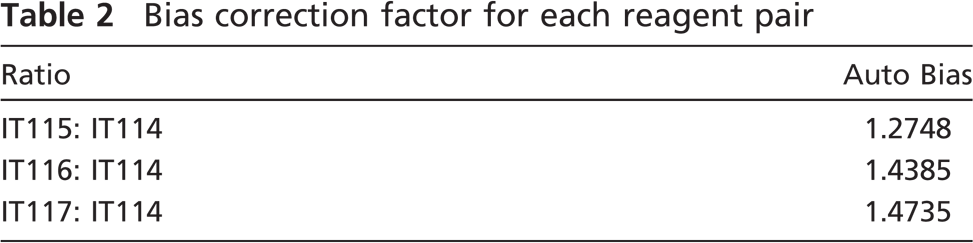
Bias correction factor for each reagent pair
List of the identification and quantification information of CTSD, KRT8, SFN, and STMN1 in the combined data
Unused, unused score; Total, total score; % Cov, sequence coverage (%); Peptides (95%), the total number of detected peptides (with 95% confidence); NNET labeled by iTRAQ 114; NPC WHO type I labeled by iTRAQ 115; NPC WHO type II labeled by iTRAQ 116; NPC WHO type III labeled by iTRAQ 117. CTSD, cathepsin D; KRT8, keratin8; SFN, 14-3-3 s; STMN1, stathmin1.
The molecular functions and subcellular localizations of the unique proteins identified in the study were classified using David Functional Annotation Tools (Dennis et al. 2003; Huang da et al. 2009).
Results
Data Summary and Bioinformatics Characterization
Data combination of the two MS repetitions resulted in the identification of 8897 distinct peptides corresponding to 730 unique proteins according to the parameter set as described above, of which 377 unique proteins were identified by at least two peptides and 528 unique proteins were quantified by the iTRAQ labels. The two MS repetitions shared an overlap of 74% of the total unique proteins of the combined data. Global FDR (unused Protscore threshold 1.3) of the combined data was 0.5% (Table 1). Bias correction was performed. By default, the correction assumed that the samples with the different forms of the label were combined in 1:1 ratios and calculated a bias correction factor (Auto Bias) for each reagent pair (Table 2). It shows that the quantificational variation among IT115, IT116, and IT117 was minimal. If the samples from each experimental condition were not combined in exactly equal amounts, the bias correction fixed this systematic error.
Our previous proteomic studies had set up a proteomic database of human fresh NPC and NNET, which could be accessed on our website (http://www.xyproteomics.org/en). The database was cumulated and originated from frozen NNET or NPC tissues utilizing two-dimensional gel electrophoresis (2-DE) combined with matrix-assisted laser desorption/ionization-time-of-flight mass spectrometry, 1D gel separation with quadruplole time-of-flight mass spectrometry, or 2D LC-MS/MS. We drew a total of 1087 unique proteins from the combined available database (acquired by applying total protein extraction methodology and any one of the three identification techniques above) of the frozen NNET and NPC tissue specimens (neither laser capture–microdissected) and compared the proteome inventories obtained from the FFPE and frozen tissue specimens. We found that the 730 proteins identified in this study were all contained in the previous database based on the frozen tissue specimens. The proteins that resulted from the frozen and FFPE tissues in the two datasets were categorized by David Functional Annotation Tools (Dennis et al. 2003; Huang da et al. 2009). The subcellular localization and molecular function groups of the unique proteins identified in the frozen and FFPE tissues were compared. Although the two compared proteomic datasets were not obtained in one synchronous experiment performance, the distribution of proteins among the subcellular compartments was similar between the FFPE and frozen tissue datasets, as was that among the molecular functions (Figure 2). The identified proteins from the FFPE specimens were found to have a broad range of molecular functions and arose from every cell compartment. We attribute the good performance in the unbiased spectrum of the proteins identifiable from the FFPE tissues to the combined effect of SDS extraction and HIAR in concert with 2D LC-MS/MS.
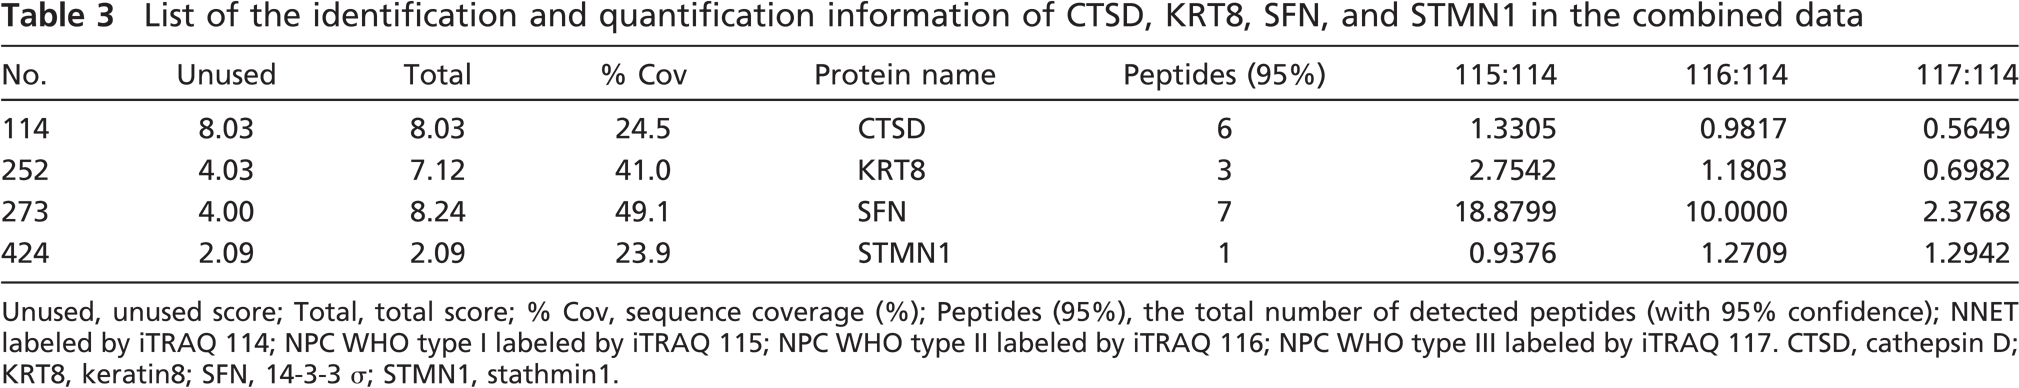
A representative MS/MS spectrum showing a peptide, ISVNNVLPVFDNLMQQK (top panel), from cathepsin D, with the representative quantitation information of the peptide (bottom panel). The ion assignments are as follows: NNET, iTRAQ 114; NPC WHO type I, iTRAQ 115; NPC WHO type II, iTRAQ 116; NPC WHO type III, iTRAQ 117.
Four Differentially Expressed Proteins in FFPE Tissues of NPC: CTSD, KRT8, SFN, and STMN1
In this study, CTSD, KRT8, SFN, and STMN1 were found in both MS repetitions and passed the unused Protscore threshold 1.3 with at least one peptide with 95% confidence per repetition. The identification and quantification data after combination are shown in Table 3. It is clear that among the three types of NPC, CTSD, KRT8, and SFN are downregulated from type I (well-differentiated) NPC to type III (poorly differentiated) NPC whereas STMN1 is upregulated in sequence. Although STMN1 was identified by one peptide, its identification and quantification information could be supported by the IHC results, suggesting that the limitation in the protein identifications by two or more peptides might lose some important information, especially for the experiments with a minority of technical replicates.
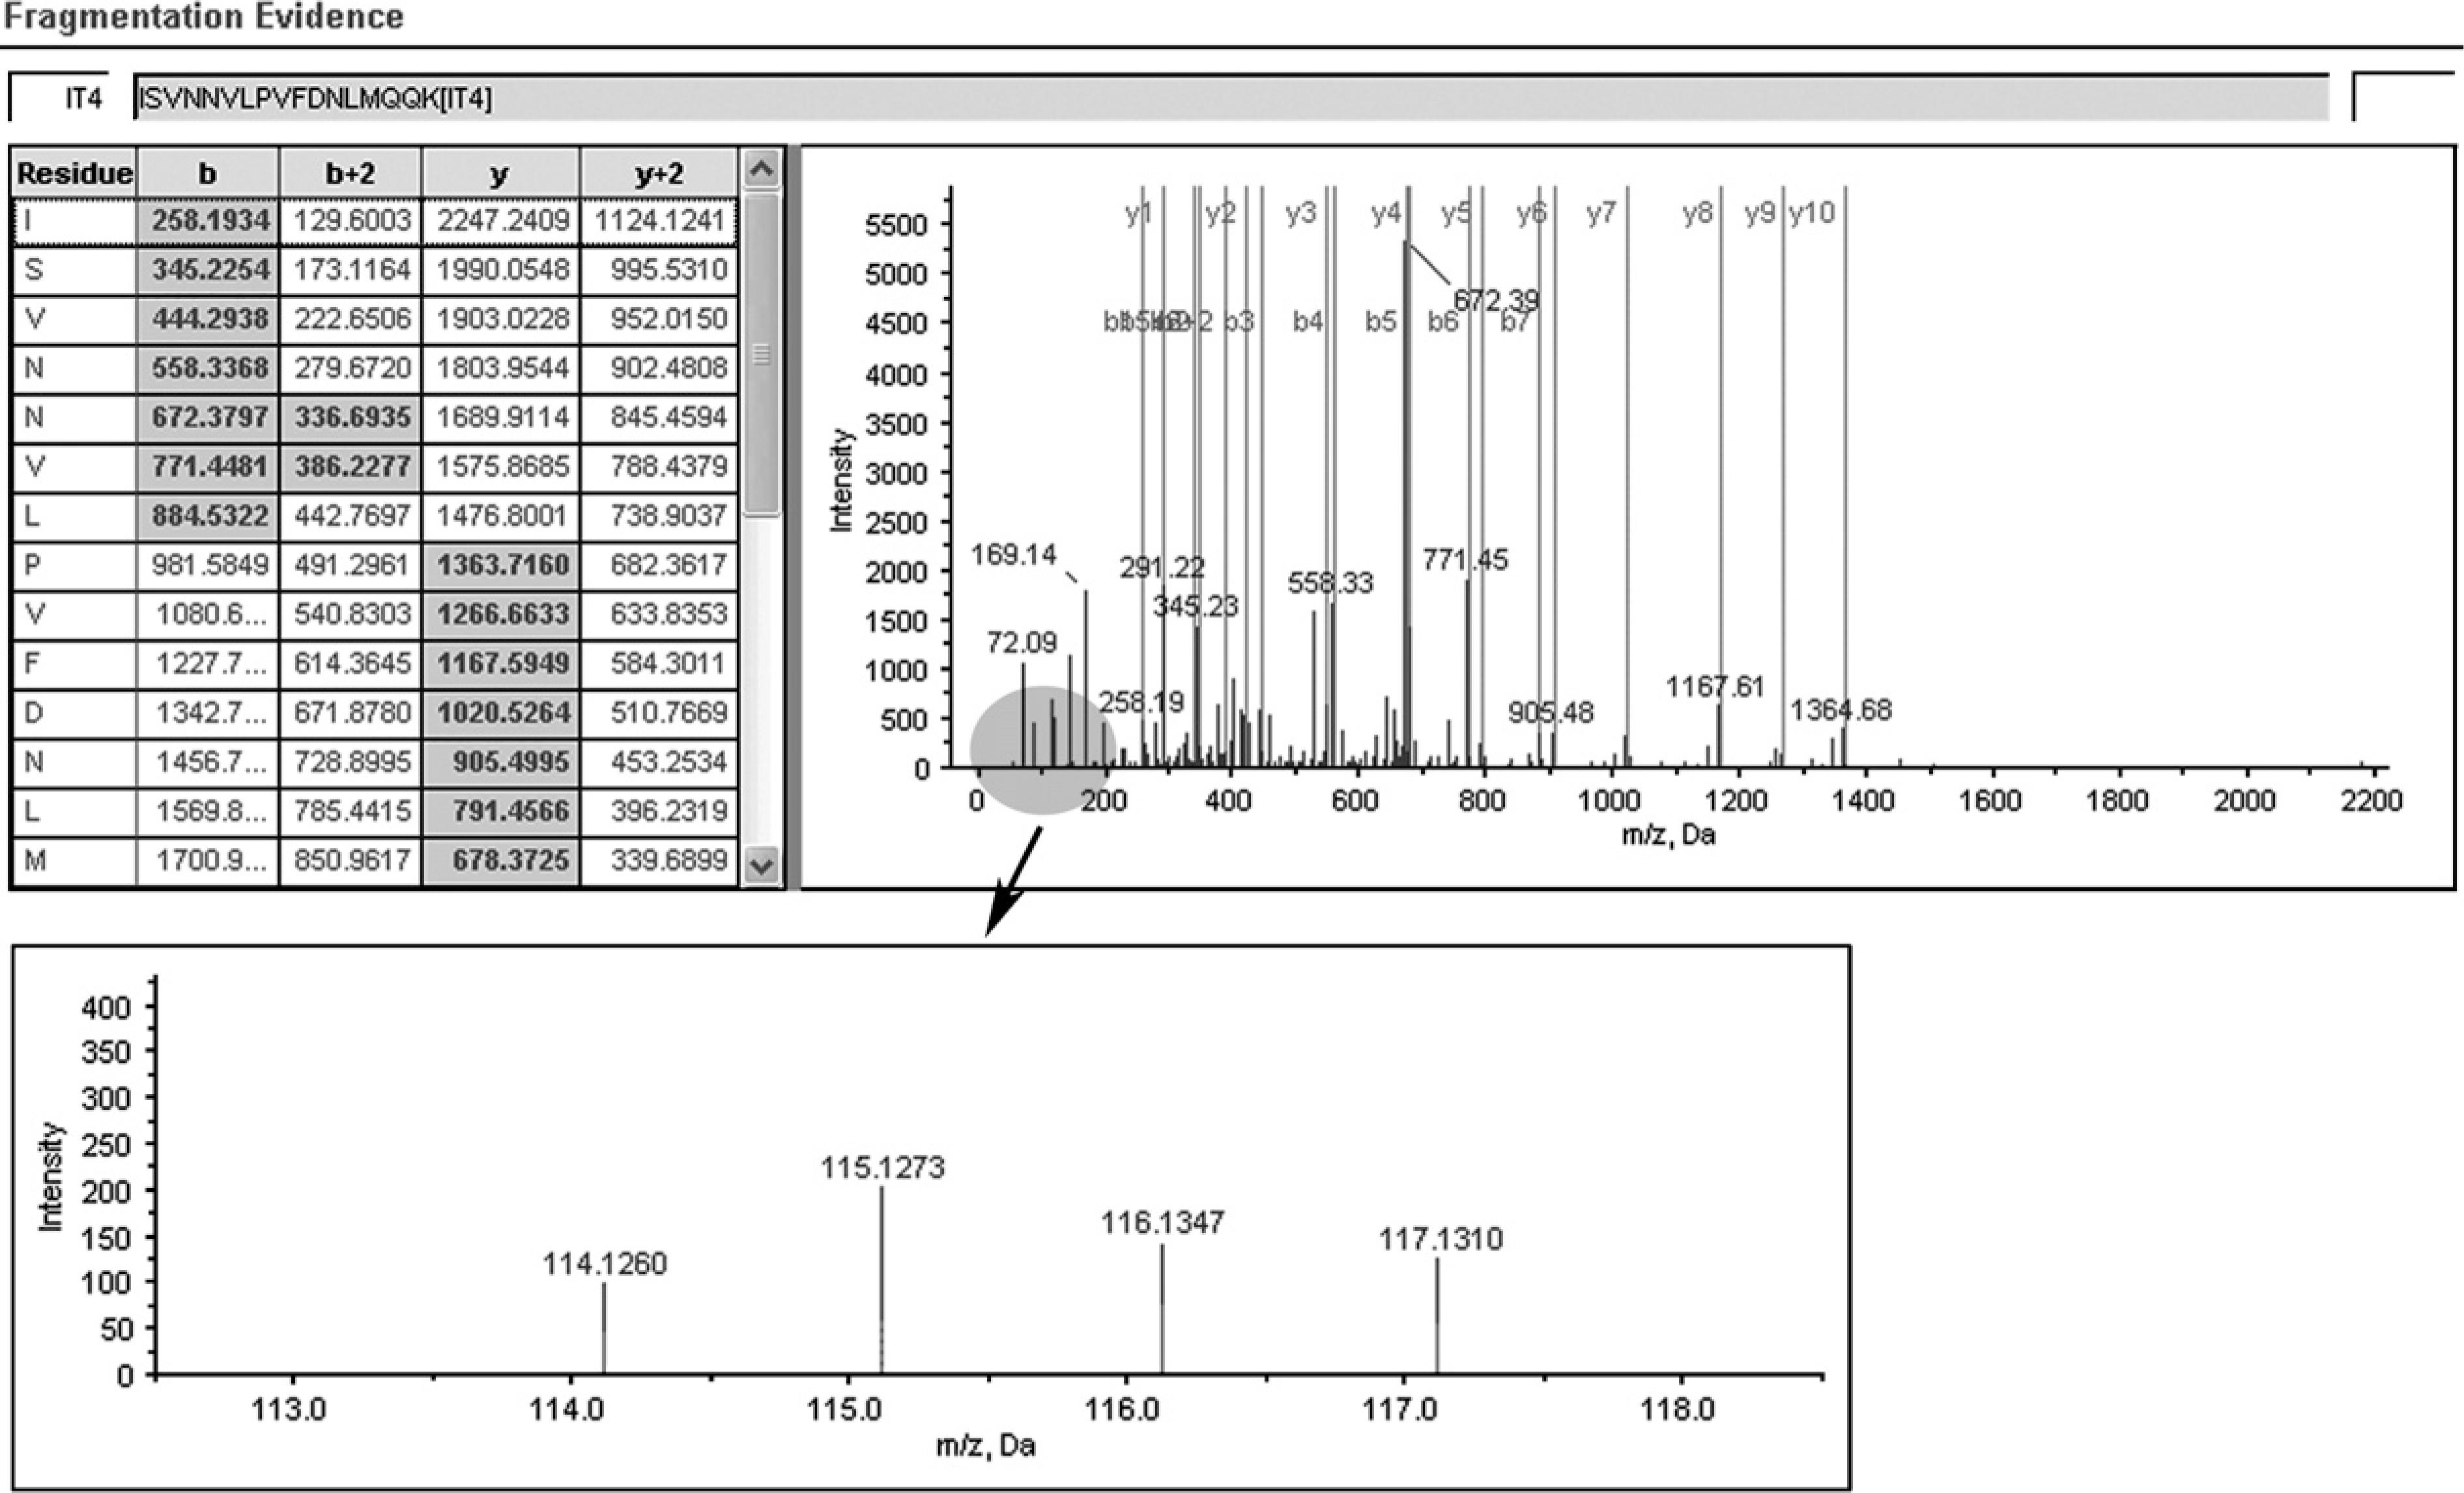
A representative MS/MS spectrum showing a peptide, LEGLTDEINFLR (top panel), from KRT8, with the representative quantitation information of the peptide (bottom panel). The ion assignments are as follows: NNET, iTRAQ 114; NPC WHO type I, iTRAQ 115; NPC WHO type II, iTRAQ 116; NPC WHO type III, iTRAQ 117.
In our previous research, 2-DE, combined with laser capture microdissection, was performed to identify novel NPC biomarkers by comparing frozen tissues of NNET and NPC. Moreover, the correlation of expression status of several proteins in primary NPC with clinicopathological factors, including histological grade, primary tumor stage, clinical stage, and recurrence, were evaluated (Cheng et al. 2008a, b, c). Of the identified differential proteins between NPC and NNET, CTSD, KRT8, SFN, and STMN1 were validated to be associated with the differentiation of NPC by standard IHC in NNET, NPC WHO type I, WHO type II, and WHO type III tissues. The statistical analysis of the IHC results that were scored based on the tissue differentiation and staining intensity was consistent with the quantification data of this study. Briefly, types I and II (well–moderately differentiated) NPC showed a more intense immunoreactivity of CTSD, SFN, and KRT8 than did type III (poorly differentiated) NPC, whereas types II and III (moderately–poorly differentiated) NPC showed a more intense immunoreactivity of STMN1 compared with type I (well-differentiated) NPC. Additionally, the expression levels of the proteins were detected by Western blot in NPC cell lines with diverse differential degrees, the results of which indicated that the proteins were related to the differentiation of NPC cell lines. In conclusion, our previous study demonstrated that the expression levels of the four proteins were associated with the differentiation of NPC and suggested that they were potential biomarkers for the differentiation and prognosis of NPC (Cheng et al. 2008a,b,c).
In this study, the four proteins were also identified quantitatively by iTRAQ-coupled 2D LC-MS/MS and showed the same differential expression among the three NPC histological types as validated previously by IHC (Figures 3–6), suggesting that the selected FFPE blocks of the three histological types of NPC contained the maximal homogeneous cancer cells (Figures 7B–7D) and that iTRAQ was an effective means for FFPE tissue-originated proteomic quantification. Of note, normal nasopharyngeal epithelial cells represented as little as 20% of NNET (Figure 7A), which was labeled by iTRAQ 114, and it was therefore used to standardize the comparison among the other three histological types of NPC.
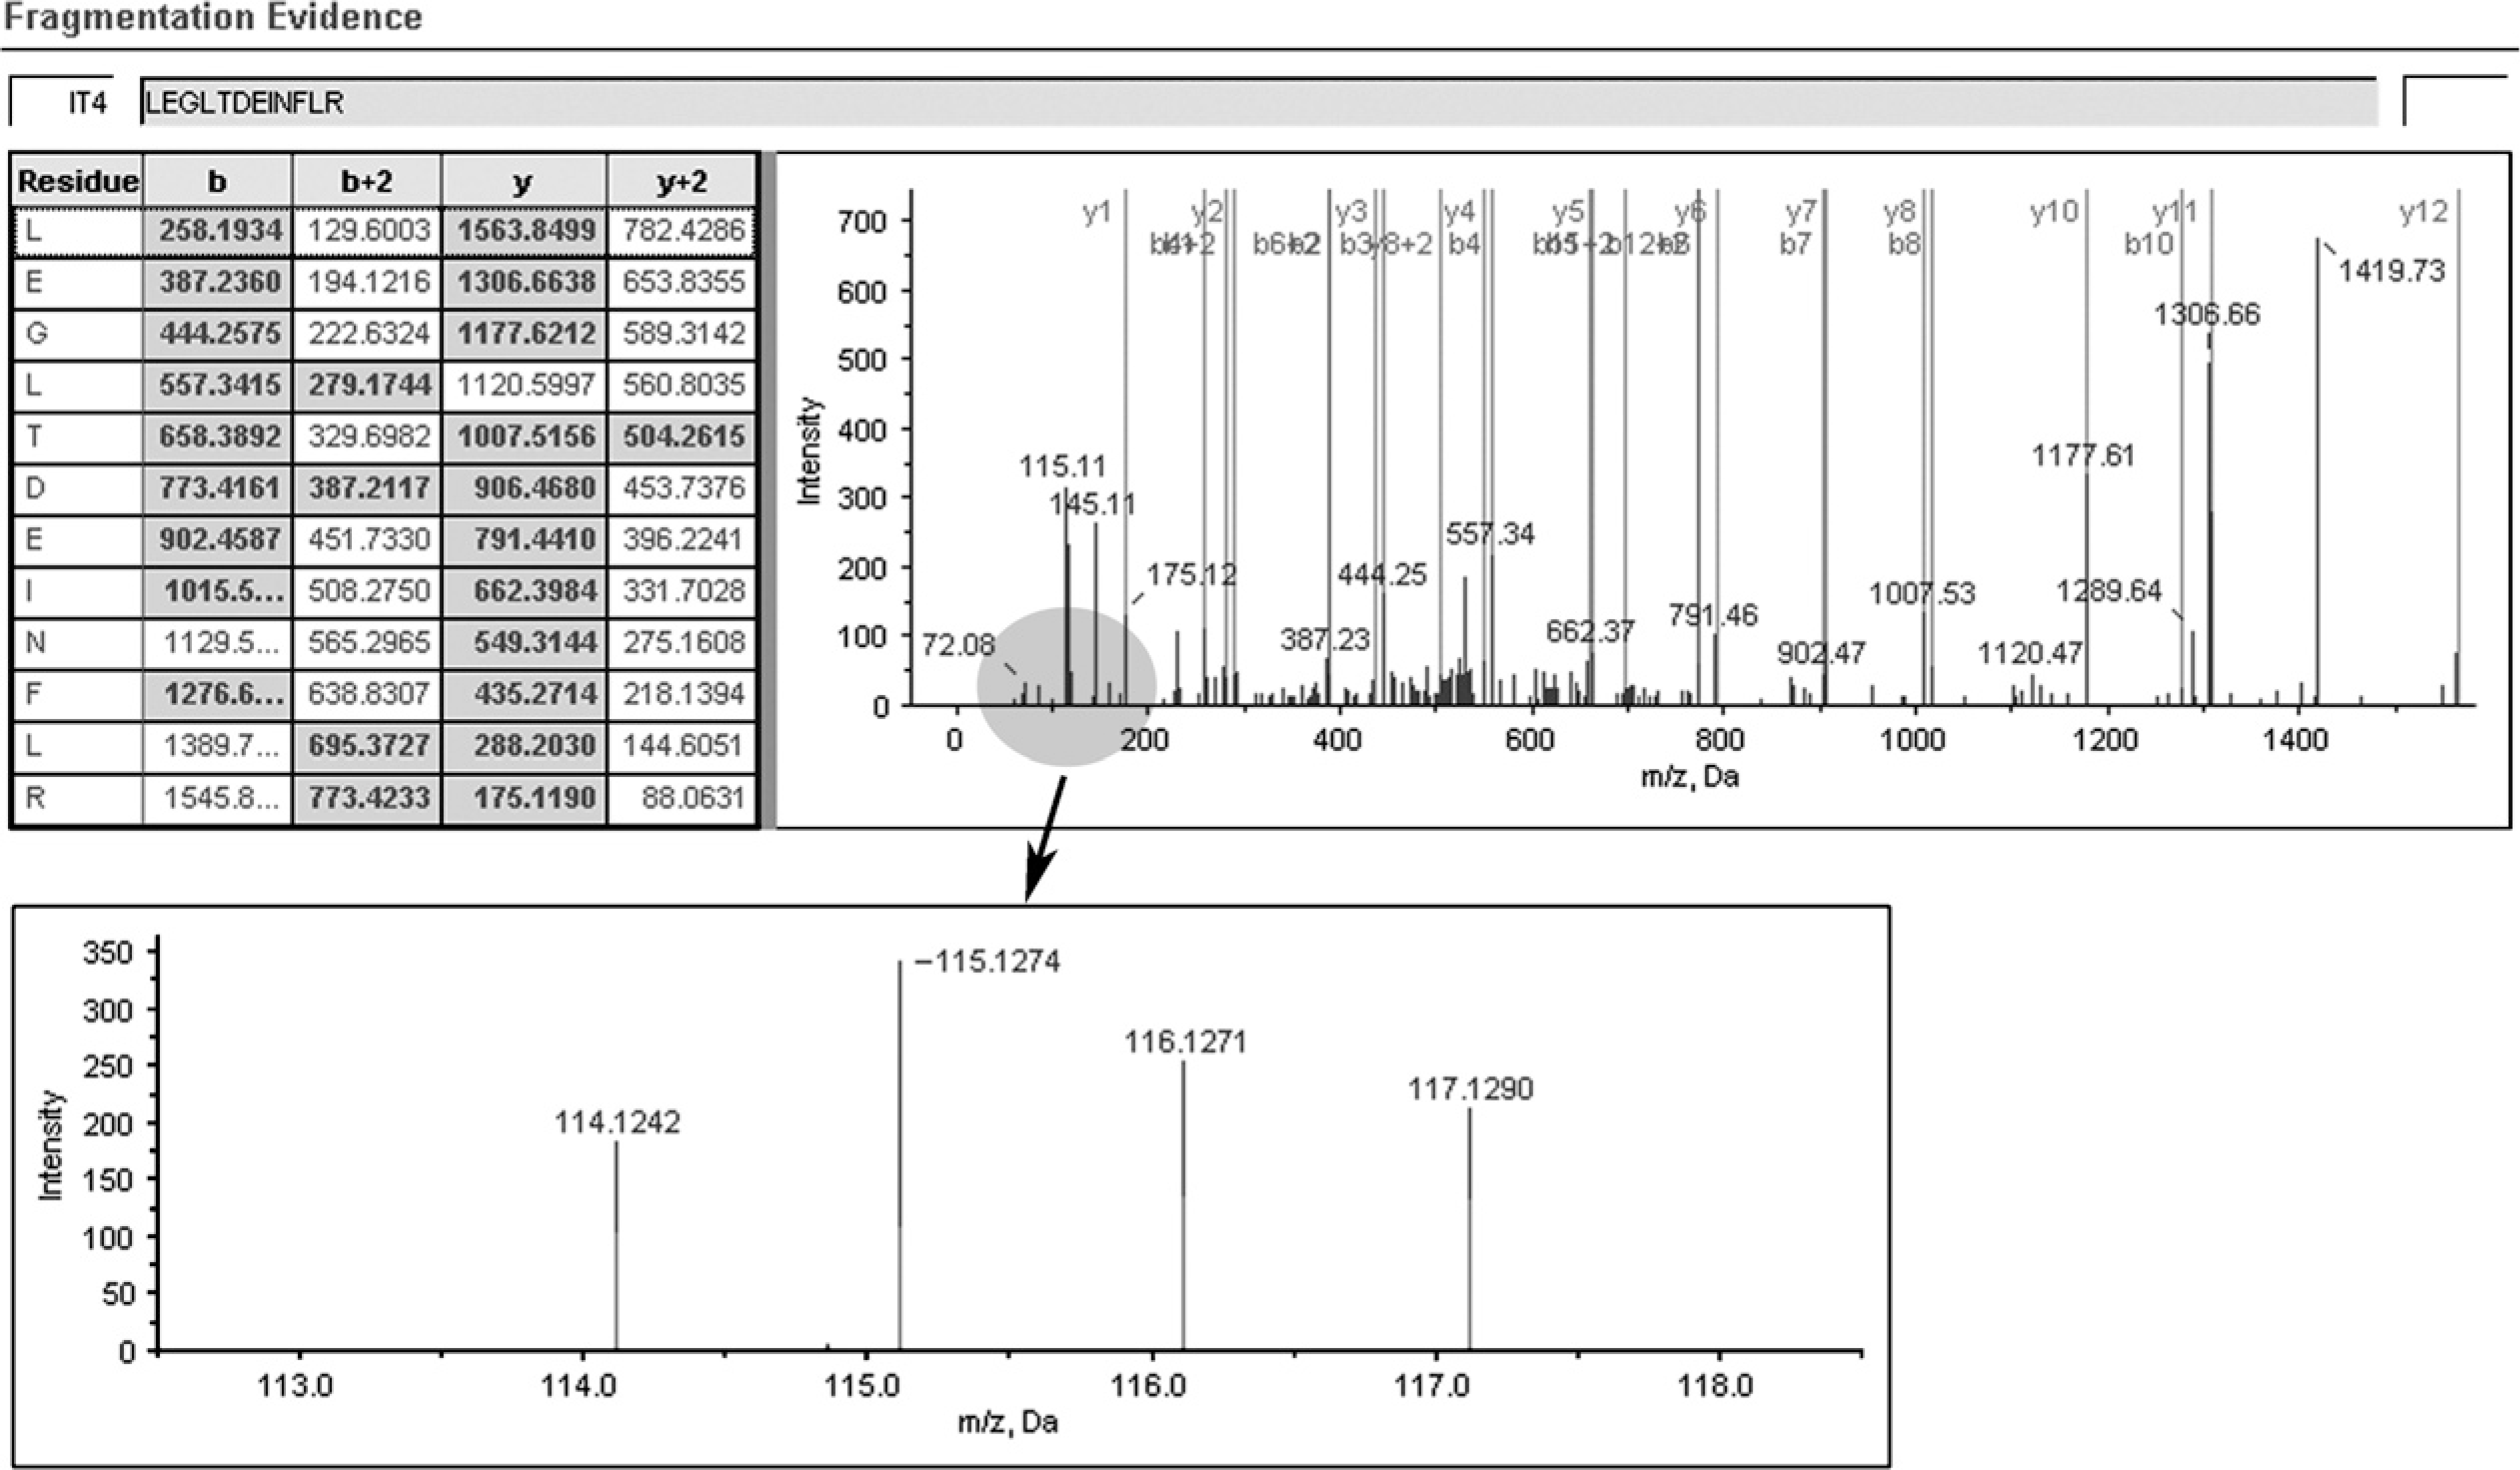
A representative MS/MS spectrum showing a peptide, TTFDEAMADLHTLSEDSYK (top panel) from SFN, with the representative quantitation information of the peptide (bottom panel). The ion assignments are as follows: NNET, iTRAQ 114; NPC WHO type I, iTRAQ 115; NPC WHO type II, iTRAQ 116; NPC WHO type III, iTRAQ 117.
Discussion
Recent work demonstrated the equivalence of shotgun proteome inventories obtained from FFPE and frozen tissue, in both numbers of proteins identified and identities of the proteome, and indicated the possibility of employing FFPE tissues as an alternative to frozen tissue for biomarker discovery (Sprung et al. 2009). The extensive storage of FFPE tissues offers a resource of various specimens and makes possible the retrospective screening for disease biomarkers. Our study shows that a simple SDS-containing buffer, along with the HIAR technique combined with iTRAQ-coupled 2D LC-MS/MS, is effective and efficient in multiple-comparative proteomic analysis of FFPE tissues of NPC. Some of the differentially expressed proteins identified in this study were validated in correlation with the histological differentiation in NPC by IHC in our previous study.
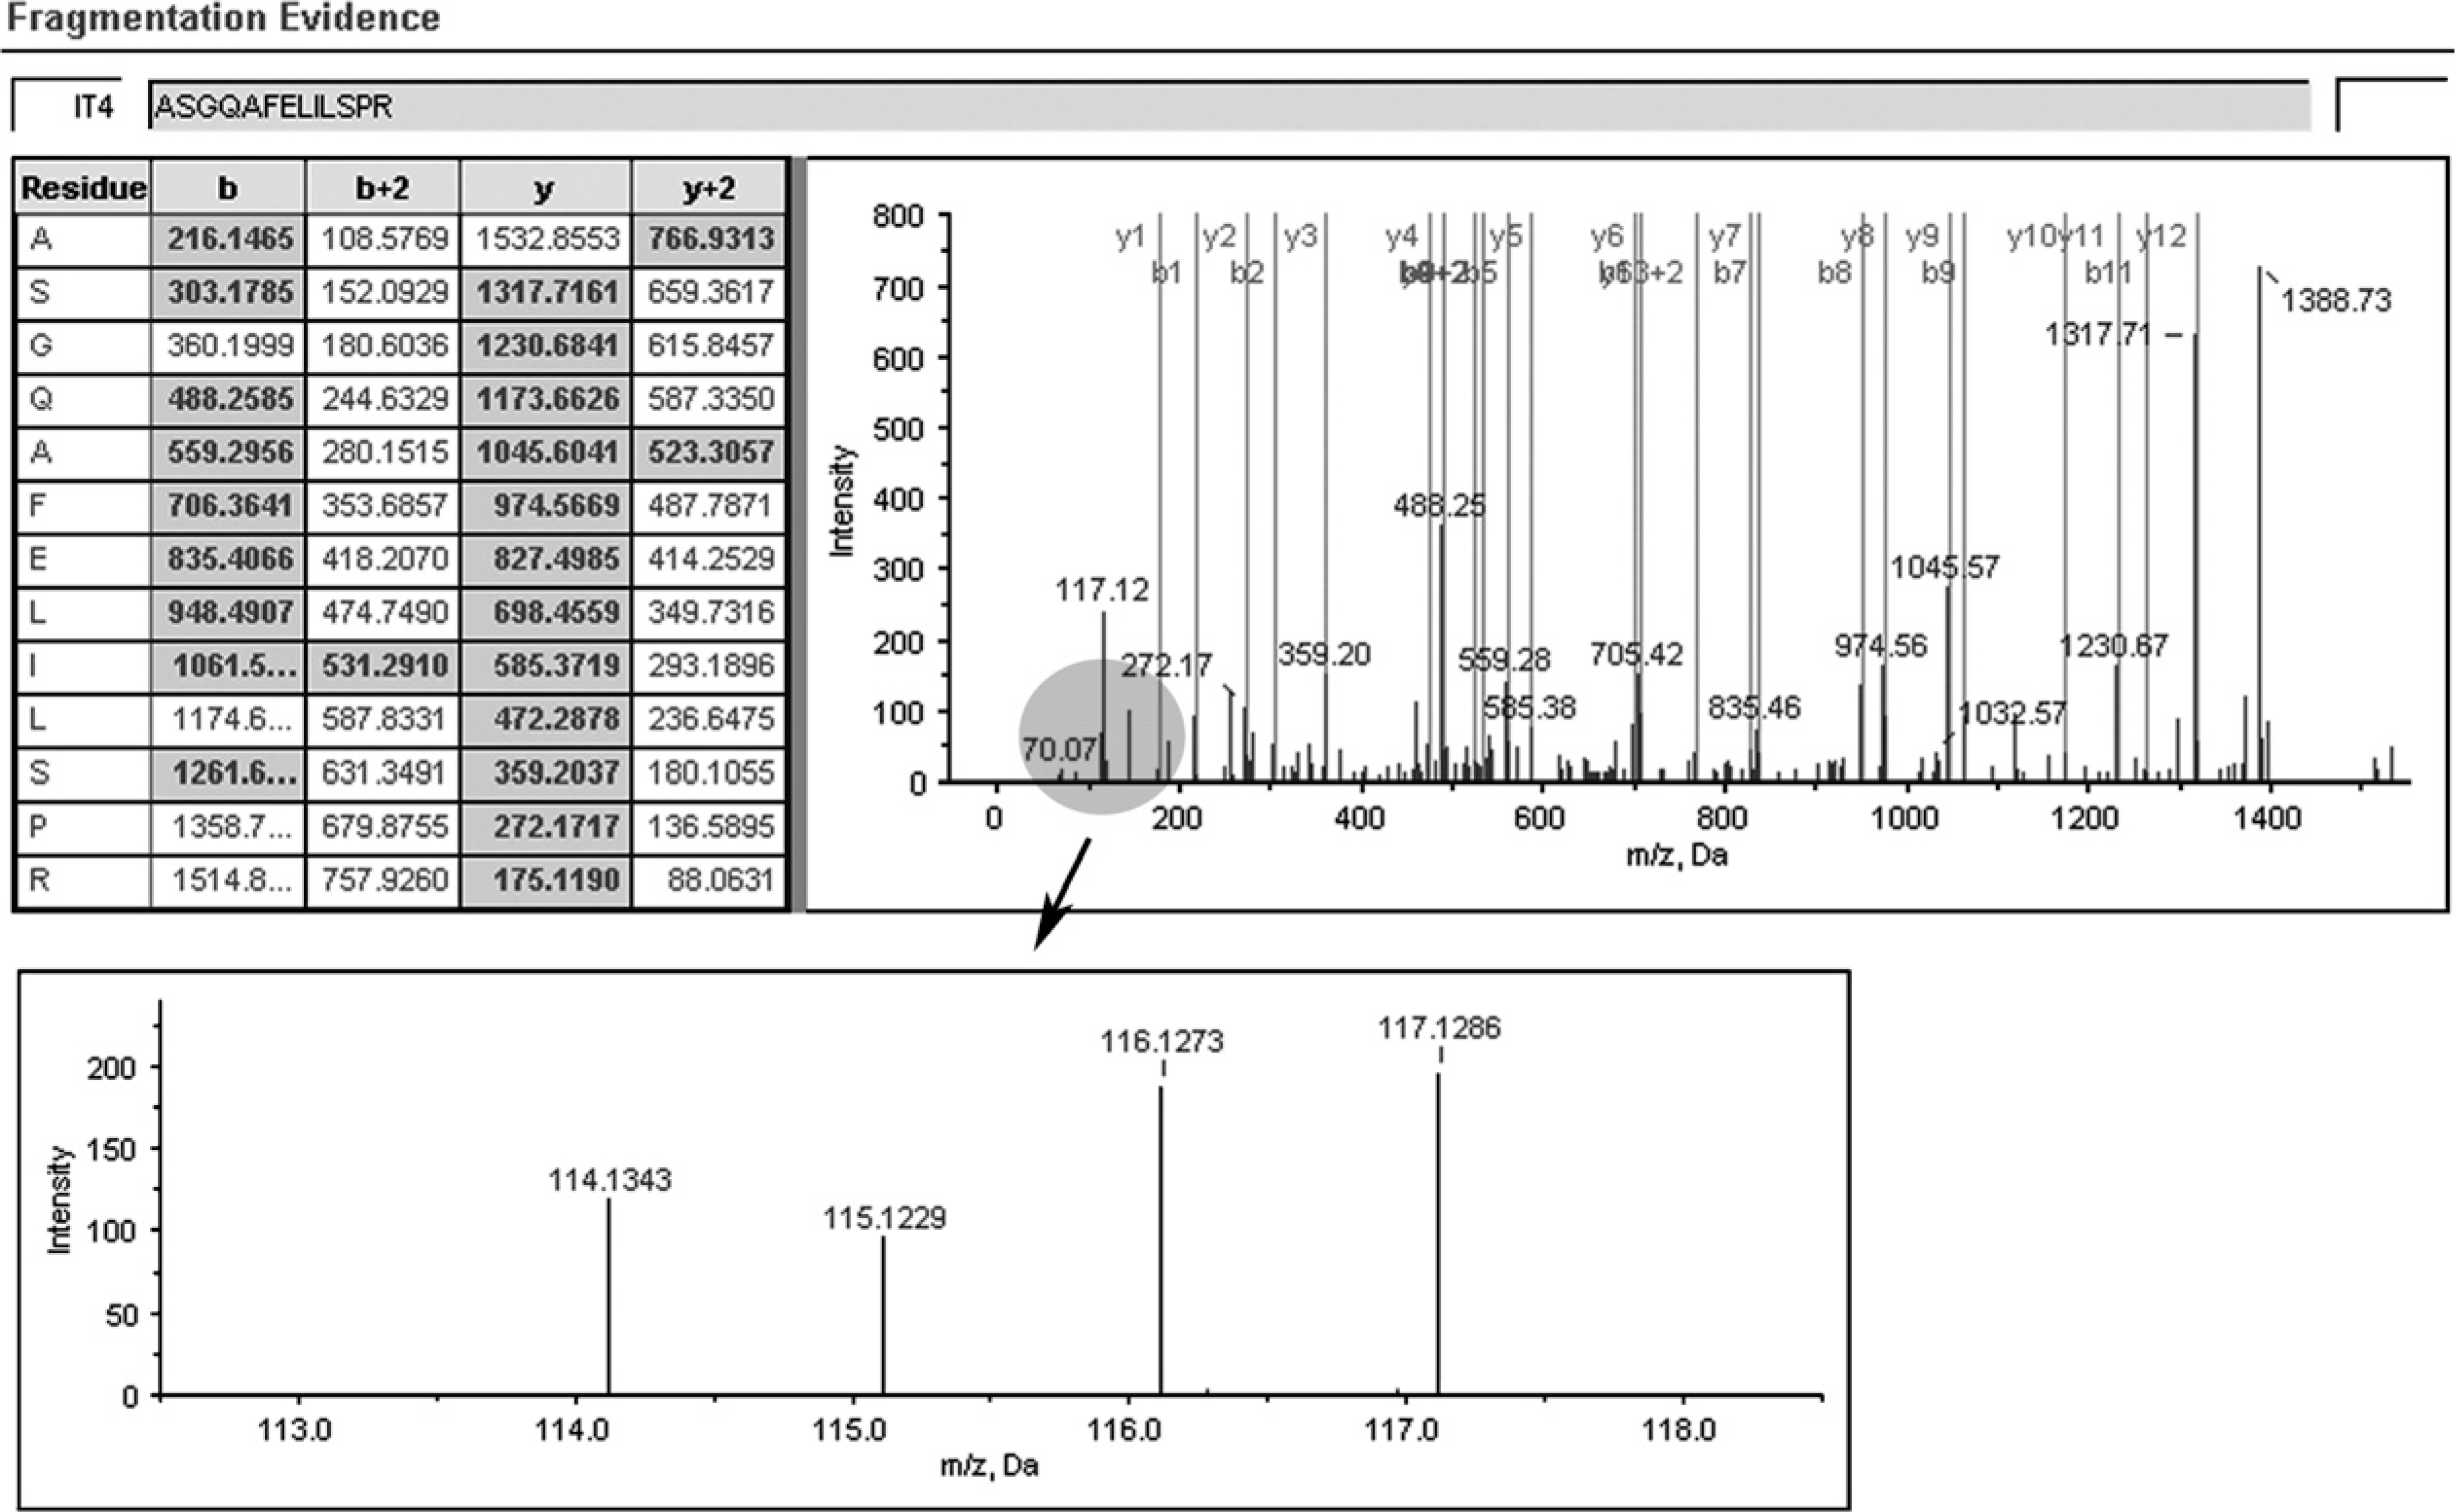
A representative MS/MS spectrum showing a peptide, ASGQAFELILSPR (top panel) from STMN1, with the representative quantitation information of the peptide (bottom panel). The ion assignments are as follows: NNET, iTRAQ 114; NPC WHO type I, iTRAQ 115; NPC WHO type II, iTRAQ 116; NPC WHO type III, iTRAQ 117.
For some time, the routine protein-based application for FFPE tissues has been in IHC, apart from its traditional use in histological investigations. Formalin-induced inter- and intramolecular crosslinking reactions were thought to render the FFPE samples incompatible with many biological analyses, including proteomic studies (Ahram et al. 2003). The efficiency of protein recovery is the key to high-throughput proteomic analysis of archival FFPE tissues. Developed to increase the reactivity in immunohistochemical staining in FFPE tissues, HIAR techniques have shown promising results with protein extraction and proteomic analysis (Ikeda et al. 1998; Shi et al. 2006). We adopted an economical and easily accessible extraction buffer combining with HIAR in protein retrieval and acquired a dataset including proteins associated with various cellular compartments and representing a diverse array of molecular functions. Although the number of proteins in the dataset acquired cumulatively in our previous study from the frozen tissues is far more than that from the FFPE tissues, owing to the multiple experiments on the types of MS platforms, the comparison of the identifications based on gene ontology categories representing cellular localization and function indicates no significant organelle or function bias in the identifications from FFPE tissues. Thus, it is thought that increasing experimental replicates would expand the proteome coverage from FFPE tissue specimens and would probably afford a dataset of protein inventories equivalent to that of the corresponding frozen samples.
In some quantitative shotgun proteomic research of FFPE tissues, spectral counting and trypsin-mediated 18O labeling were adopted for quantification; the former provided a rough measure of protein levels, especially for more-abundant proteins, and the latter was designed for two-group comparative experiments (Hood et al. 2005; Sprung et al. 2009). Only one report utilized iTRAQ technology in conjunction with a commercial extraction kit in a quantitative proteomic study of FFPE tissues (Jain et al. 2008). In 2005, a report described the successful application of shotgun proteome analysis combined with trypsin-mediated 18O labeling to FFPE tissues of cancerous prostate lesions and benign prostate hyperplasia, opening the door to comparative proteomic analyses of FFPE tissues (Hood et al. 2005). In 2007, the absolute quantitation of abundance method coupled to LC-based multiple reaction monitoring was applied to achieve picogram-level quantitation of prostate-specific antigen (Hwang et al. 2007). Later, in a proteomic analysis of squamous cell carcinoma of the head and neck (HNSCC), FFPE tissue sections of normal oral epithelium and well-, moderately, and poorly differentiated HNSCCs were microdissected and processed for nano-reversed-phase liquid chromatography followed by tandem MS; KRT4, KRT16, vimentin, and desmoplakin were chosen to be validated by IHC. However, the IHC results of the oral cancer–specific tissue microarray indicated that the relative expression levels of the proteins showed some inconformity with the relative abundance of their corresponding peptides (Patel et al. 2008). Another study showed that the expressions of KRT4, KRT13, transglutaminase 3 (TGM3), and annexin A1 (ANXA1) were significantly downregulated in microdissected FFPE tissue samples of tongue squamous cell carcinoma by comparing the MS peak intensity between cancer and normal epithelial tissues (Negishi et al. 2009). To date, only one report has described the application of iTRAQ technology in a quantitative proteomic study of FFPE tissues; this report adopted the liquid tissue sample preparation method. The study successfully compared the expression of 114 proteins identified by at least two peptides from oral human papillomavirus lesions between human immunodeficiency virus (HIV)-positive and HIV-negative patients, and the expression level of KRT17 was corroborated by IHC (Jain et al. 2008).
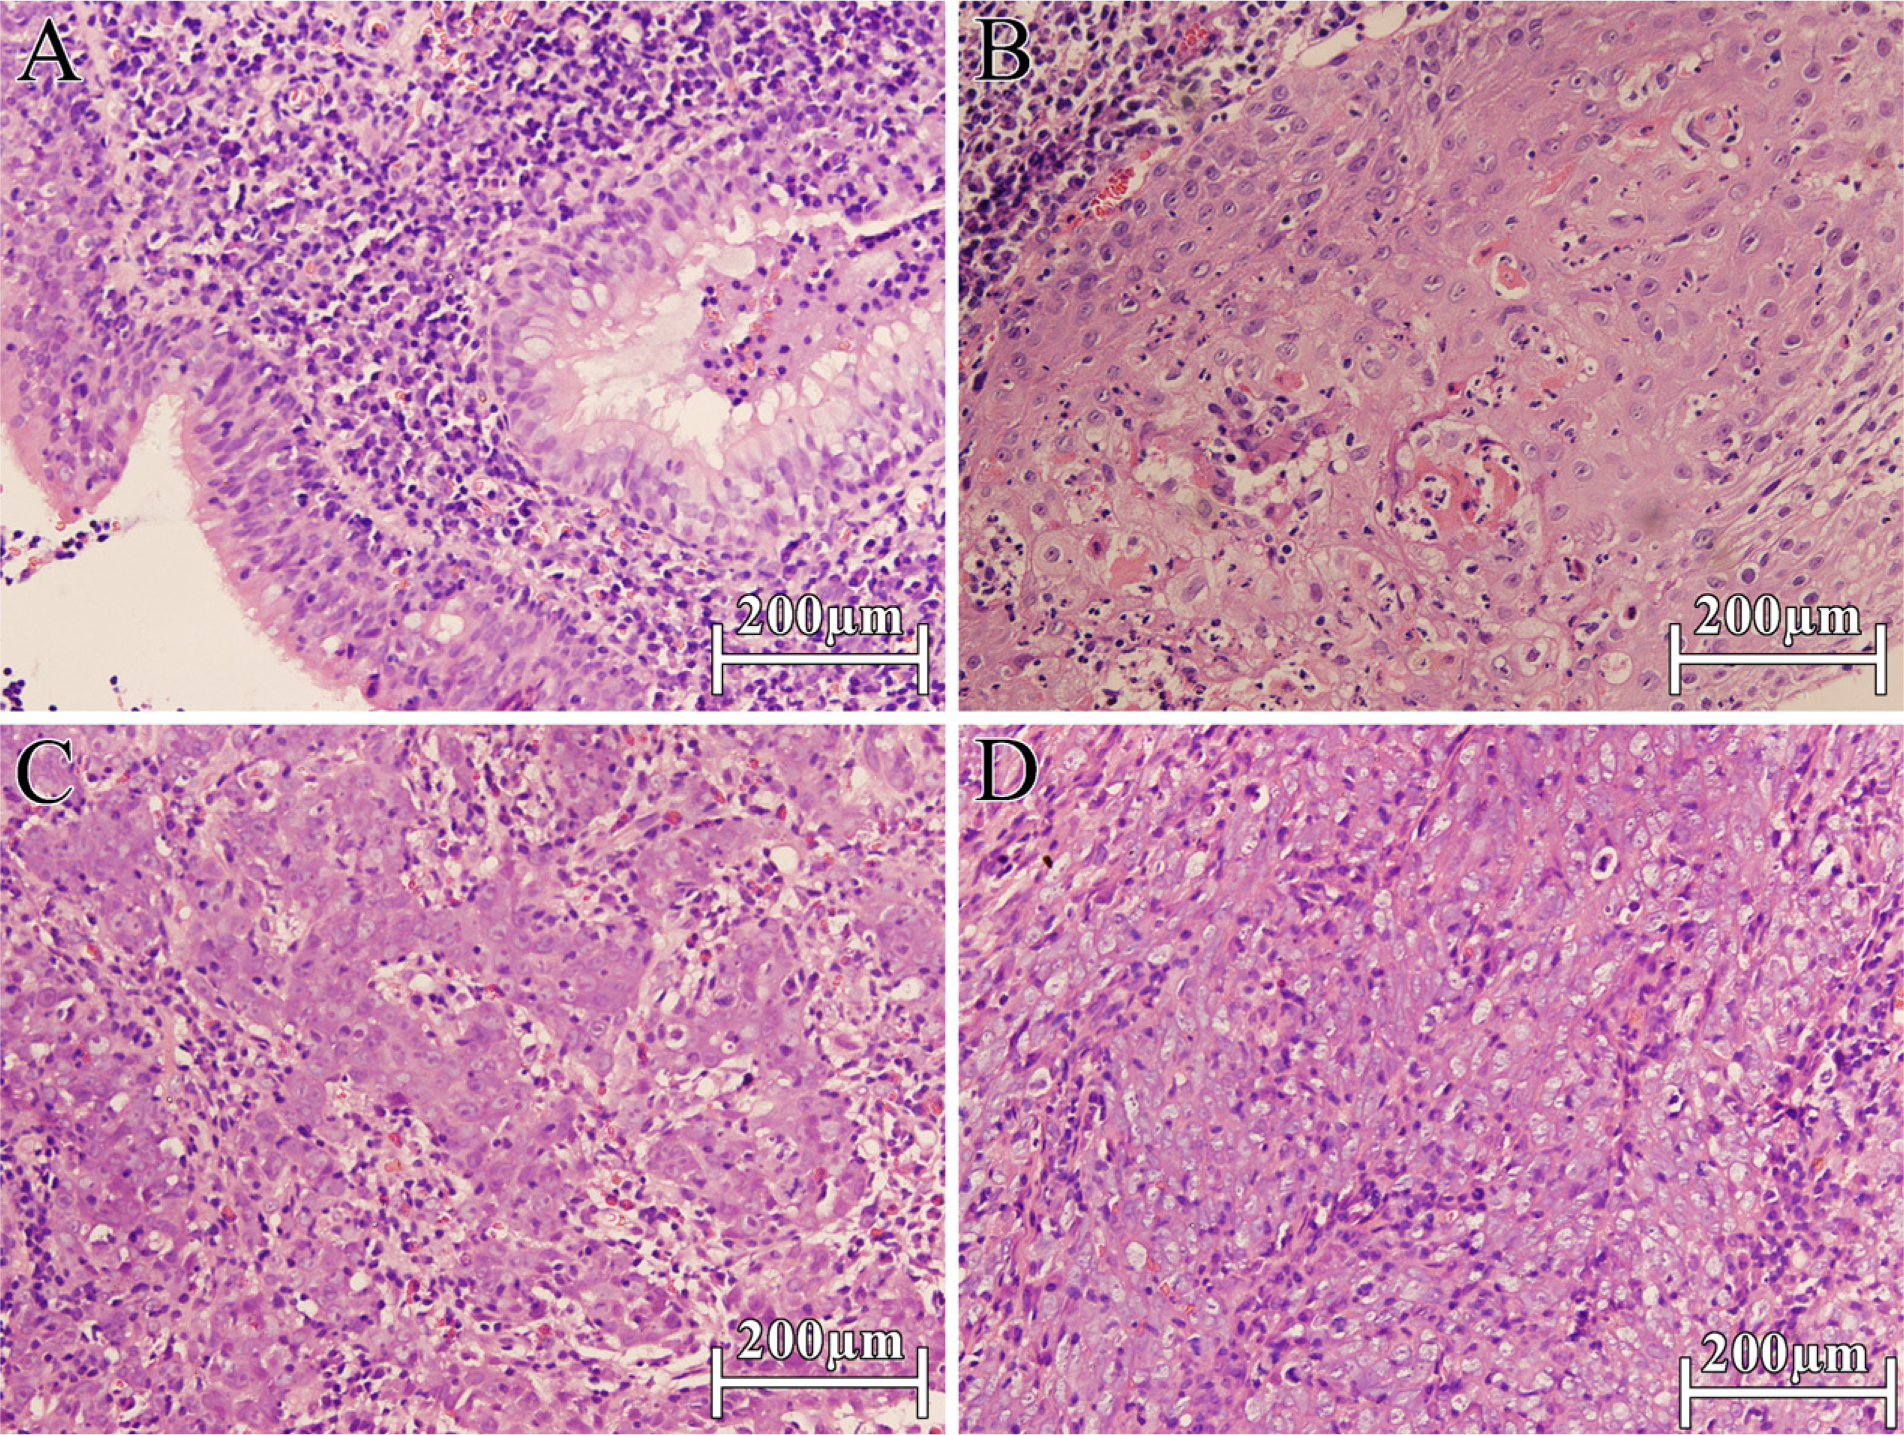
Representative photographs of NNET and NPC sections (hematoxylin and eosin stained) selected for the protein extraction.
As a primary amine-specific labeling reagent, iTRAQ acts by covalently binding to lysine side chains and N-terminal groups (Chen et al. 2007). Although modifications of amino acid residues widely exist in FFPE tissues and lysine-terminal peptides have been confirmed to be under-represented in the FFPE dataset compared with the frozen dataset (Fox et al. 1985; Sprung et al. 2009), iTRAQ technology has exhibited good performance in the quantitative proteomic study of FFPE tissues. This may be explained in part by the speculation that the peptide fragments produced by trypsin digestion acquired new and accessible N-terminal groups for iTRAQ labeling and the losses of lysine side chains were proportionate in each FFPE sample group. Because no MS/MS evidence for formaldehyde-derived modifications was observed through searching the spectra in a targeted manner nor in an unbiased manner in a recent study (Sprung et al. 2009), we did not specify modifications targetedly in the database search.
In our previous study, CTSD, KRT8, SFN, and STMN1 were confirmed by IHC and Western blot to play an important role in the differentiation of NPC without prior knowledge of the correlation of their differential expression with the NPC histological types. In development, this report provided a direct and effective method for identifying the differentially expressed proteins related to the NPC histological types, the samples of which were supplied in FFPE form. Representative sections of the three histological types of FFPE NPC were examined and chosen carefully to decrease the effect of the contribution of stromal cells on comparative results, but use of laser-based tissue microdissection to focus on specific cell populations would provide greater specificity of data, especially for the NNET group.
In summary, our results demonstrate that the application of quantitative proteomics based on iTRAQ technology is effective in evaluating FFPE tissues. We were able to identify and quantify related proteins with differential expression levels in the diverse differentiation types of NPC tissues that constitute the basic data for revealing the molecular mechanism of NPC differentiation and for screening differentiation-related biomarkers.
Footnotes
Acknowledgements
This work was supported by grants from National Key Basic Research Program of China (grant no. 2001CB510207), National Natural Science Foundation of China (grants no. 30800419 and no. 30973289), and Program for New Century Excellent Talents in University (NECT-07-0861).
The authors thank the Department of Chemistry and the Institute of Biomedical Science, Fudan University, Peoples Republic of China, for technical support.