
Abstract
Photonic crystal (PC) surfaces can be designed to provide a wide range of functions that are used to perform biochemical and cell-based assays. Detection of the optical resonant reflections from PC surfaces enables high sensitivity label-free biosensing, whereas the enhanced electromagnetic (EM) fields that occur at resonant wavelengths can be used to enhance the detection sensitivity of any surface-based fluorescence assay. Fabrication of PCs from inexpensive plastic materials over large surface areas enables them to be incorporated into standard formats that include microplates, microarrays, and microfluidic channels. This report reviews the design of PC biosensors, their associated detection instrumentation, and biological applications. Applications including high-throughput screening of small molecules, cell membrane integrin activation, gene expression analysis, and protein biomarker detection are highlighted. Recent results in which PC surfaces are used for enhancing the detection of surface-enhanced Raman spectroscopy, and the development of high-resolution PC-based laser biosensors are also described.
Introduction
Genomic, epigenomic, and proteomic data are now providing an explosion of new information about how individuals may be susceptible to a particular disease, which people are most likely to benefit from a pharmaceutical treatment, and who is likely to suffer from adverse side effects. These trends are introducing a new era of personalized medicine in which pharmaceutical companies will no longer produce treatments that are intended to be effective for the entire population, but instead will be effective only for patients with identifiable gene expression or presence of a protein biomarker in their blood. In pharmaceutical research, the ability to efficiently screen the biochemical interaction of potential pharmaceutical drug compounds with a wide array of proteins and cells before the clinical trial stage is an increasingly important capability for avoiding costly failures when the drug is introduced to animals and humans. Likewise, testing of patients’ blood or tissue samples for expression of a gene profile or presence of a biomarker will become common practice to aid in decisions regarding the most promising course of treatment. New tools are required to address these challenges. These tools take the form of sensors and assay methods that are capable of translating biochemical interactions, modifications of cell membranes, and cell differentiation into measurable signals that provide a window into how these structures operate. The study of transducers, fluorescent tags, and nanoparticle “biosensors” comprises a diverse and highly active field of research and commercial activity.
Performing assays through the detection of fluorescent proteins, chemical tags, and nanoparticles are dominant methods for applications that include gene expression micro-arrays, gene sequencing, protein—protein interaction screening, cell imaging, and many others. A vast array of fluorescent tag materials, surface immobilization chemistries, illumination sources, and detection instruments are used for fluorescence-based assays that enable these methods to achieve detection sensitivity in the <10 pg/mL range,1, 2 subdiffraction limit imaging,3, 4 and throughput of up to millions of assays per chip. 5 Although fluorescence-based detection is very powerful, development of effective fluorescent tags and robust quantitative assay procedures are not always simple. For example, tags can interfere with the conformation of molecules under study and can block active binding epitopes, whereas quenching and photobleaching of fluorescent dyes require strict experimental controls and limits long-term tests that provide kinetic data. Therefore, label-free assay methods that enable biomolecular binding events or cellular processes to be studied through an intrinsic physical property of the analytes are desirable in some cases. Because label-free methods transduce biological activity directly to a measurable output, these assay methods are generally simpler to implement than tag-based methods, although some type of sensor surface is required on which assays must take place.
Of the many label-free detection methods that have been demonstrated, those based on detection of the dielectric permittivity of their analytes at optical wavelengths, collectively known as “optical biosensors,” have been most widely adopted, since the introduction of surface plasmon resonance (SPR) in the 1990s.6, 7 Detection and identification of molecules through the vibrational modes of their chemical bonds using Raman spectroscopy and surface-enhanced Raman spectroscopy (SERS) has also gained prominence as a chemical analysis method and more recently as a biological assay method since the discovery of SERS by Van Duyne in 1977.8, 9
Since the term “photonic crystal” (PC) was first used by Yablonovitch 10 to describe a material that comprises two different refractive index materials that alternate in a periodic fashion in one, two, or three dimensions, a wide variety of PC structures have been studied and fabricated for an enormous range of applications. The periodic modulation of refractive index within a PC, along with incorporation of intentional “defects” in the PC, can be used to concentrate and direct the EM fields associated with light to produce efficient wavelength-selective reflectors, waveguides, optical circuits, beam-steering devices, optical multiplexors, and much more. 11 PCs can be designed to interact strongly with particular optical wavelengths through selection of their materials and the period of their modulation. At the wavelengths of “optical resonance” (also known as “guided-mode resonance”), light will couple strongly to the PC structure for a particular incident angle, resulting in electric fields inside the PC that can be many times higher than the electric field of incident radiation.12-14 These optical resonances can be observed by an external observer simply by illuminating the PC at normal incidence with a broad band of wavelengths (such as from a light-emitting diode [LED] or a white light lamp) and observing a narrow band of wavelengths that are reflected back with nearly 100% efficiency. The precise wavelength that is back-reflected is determined by the refractive index of the PC materials and the PC period.
To design a PC that can serve as a biosensor, some portion of the resonant electric field must be in contact with liquid media that contains the analyte, providing a surface on which biomolecules or cells may be adsorbed. Therefore, “surface PCs” in which the periodic modulation is open to the liquid, so that the resonant electric fields reside partially within the liquid, are effective for application as biosensors. The region of high electric field magnitude near the PC surface, known as an “evanescent field,” extends up to ∼ 200—300 nm from the surface. As described in previous publications,15-19 incorporation of material with greater dielectric permittivity than the media (which is typically either water or air) into the evanescent field region will increase the overall refractive index of the PC, resulting in a shift of the resonant wavelength to longer wavelengths. Fundamentally, all proteins, peptides, small molecules, and cell membranes have a greater dielectric permittivity than either air or water because all these biological analytes contain electrons that are more easily displaced by the force of an externally applied optical electric field. The result is that the speed of light is slightly reduced when traveling through these analytes, compared with the speed of light through air or water. As summarized below, this small change is transduced into a measurable change in the wavelength of light that is reflected from a PC biosensor surface.
Because of the design flexibility for producing PCs by changing their period, it is not difficult to design a PC surface for which the resonant wavelength is selected to occur at the same wavelength that is used to excite a fluorescent or nano-particle tag. In this case, any fluorophore that is adsorbed to the PC surface will experience the resonant electric fields of the evanescent field region and will be excited to a greater extent than a similar fluorophore adsorbed on an ordinary glass surface and illuminated by the same light source. Importantly, surface-adsorbed fluorophores will be excited to a greater extent than those floating freely in solution or auto-fluorescent material in the sensor substrate, thereby increasing the signal-to-noise ratio (SNR) of fluorescence detection. This phenomenon, called “PC-enhanced excitation” or “evanescent resonance” has been used to increase the detection sensitivity for detection of DNA and proteins in microarray formats by up to 115 × .20, 21 More sophisticated design of PC surfaces enables resonances to occur at more than one wavelength simultaneously. Thus, it is possible for a resonance to be designed that occurs not only at the wavelength of a laser used to excite fluorescent dyes but also at the wavelength of dye emission. This second resonance can be used to physically direct the fluorescent emission in a desired direction, such as toward a detector or microscope objective. Instead of distributing the fluorescent output into all directions in spherical coordinates, the PC enables a greater proportion of the output to be captured by the detection system, again resulting in an increase in SNR. This second technique is called “PC-enhanced extraction.” The combination of PC-enhanced excitation and PC-enhanced extraction was used to enhance the fluorescence from semiconductor quantum dots 22 with a magnification factor of 8× for the excitation effect and 13× for the extraction effect, for an overall sensitivity enhancement of 108×.
Together, the effects of PC-enhanced excitation and PC-enhanced extraction multiply, resulting in an overall fluorescence detection signal gain of up to 550× in recently published reports23-25 compared with performing the same assay on a glass microscope slide. The enhanced fluorescence (EF) effects of PC-enhanced excitation and PC-enhanced extraction, used individually or in combination are often referred to as PC-enhanced fluorescence (PCEF).
The use of enhanced resonant electric fields of a PC surface can be used to excite molecules beside fluorophores. We will briefly review how metal nanostructures can be integrated with the PC surface and how the nanostructures can couple with the PC-enhanced fields to increase the local electric fields experienced by surface-adsorbed molecules. By designing the PC surface to provide a resonant electric field at the same wavelength of light that excites molecular vibrations in a SERS instrument, the SERS signal may be increased by more than an order of magnitude. SERS represents yet another mechanism for label-free detection that may have the ability to compete with fluorescence detection for many assays, as available sensitivity improves.
The goal of this article is to briefly review the demonstrated capabilities of PC surfaces in label-free and fluorescence detection and to familiarize the reader with some of the initial applications of the technology. For full details, the reader is directed to full articles on each topic.
Label-Free Pc Biosensors
Sensor Structure and Optical Fiber Detection Instrument
The sensor structure used most commonly for label-free detection contains a one-dimensional surface grating structure with a period of 550 nm (Fig. 1A). It is produced via a room-temperature replica-molding process using a UV-curable polymer on a transparent polyester sheet. The low refractive index polymer grating structure is subsequently coated with a film of high refractive index TiO2 to achieve the final sensor structure. The completed sensor is cut from the polyester sheet and attached to the bottom of a standard 96-, 384-, or 1536-well microplates (Fig. 1B). The readout instrument (SRU Biosystems BIND Reader, Woburn, MA)18, 26, 27 illuminates microplate wells from below with a broadband light source coupled to eight optical fibers, each illuminating a ∼1 mm diameter region of the PC surface at normal incidence. Reflected light is collected by a second optical fiber, bundled next to the illuminating fiber, and measured by a spectrometer. An automated motion stage enables parallel collection of reflectance data at timed intervals to acquire kinetic information from all 384 wells. When illuminated with broadband light, appropriately configured PCs are able to reflect narrow band light whose wavelength is directly dependent on the local density of adsorbed biomolecules. Association of macromolecules to the sensor surface modulates the peak wavelength value (PWV) of the reflected light, allowing for detection of binding by a shift in the PWV. Figure 1C illustrates the general experimental setup of DNA-binding assays performed using PC biosensors.
A). Schematic cross section of the PC biosensor surface structure comprised a low refractive index polymer with periodic tooth pattern (light blue material) that is overcoated with a high refractive index film of TiO2 (red material). The PC surface is illuminated from below at normal incidence with an LED coupled to an optical fiber. The PC is illuminated with a broad band of wavelengths from the LED, but reflects only a narrow band of wavelengths. The reflected light is gathered into a second optical fiber that brings the reflected light to a spectrometer for measurement of the PWV of the resonantly reflected light. (B). Photo of PC biosensors incorporated into 96, 384, and 1536-well microplates. (C). Schematic for performing a typical biosensor assay. Each biosensor well is prepared with an immobilized capture probe that enables the sensor to specifically adsorb a target analyte to the surface. In this case, a SA-coated biosensor is used to immobilize biotinylated double stranded DNA. Capture of a DNA-binding protein to the immobilized DNA results in a positive shift in the PWV. (Reprinted with permission from ref 28. Copyright 2008 American Chemical Society.)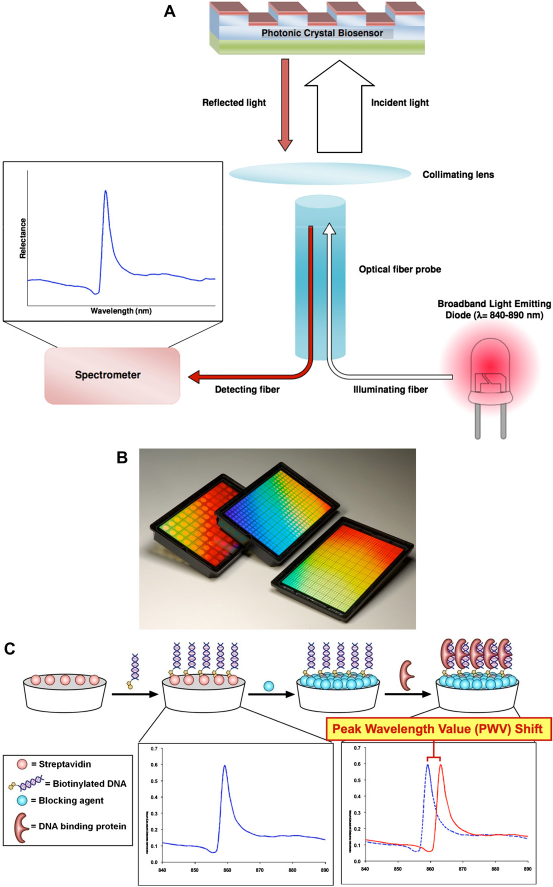
Application in Screening Assays for Protein-DNA Interaction Inhibitors
Protein-DNA interactions are essential for fundamental cellular processes, such as transcription, DNA damage repair, and apoptosis. As such, small molecule disruptors of these interactions could be powerful tools for investigation of these biological processes and such compounds would have great potential as therapeutics. Unfortunately, there are few methods available for the rapid identification of compounds that disrupt protein-DNA interactions. Here, we show that PC technology can be used to detect protein-DNA interactions and can be used in a high-throughput screening mode to identify compounds that prevent protein-DNA binding. In a recently published report, the PC technology was used to detect binding between protein-DNA interactions that are DNA sequence dependent (the bacterial toxin-antitoxin system MazEF) and those that are DNA sequence independent (the human apoptosis inducing factor [AIF]). The PC technology was further used in a screen for inhibitors of the AIF-DNA interaction and through this screen aurin tricarboxylic acid (ATA) was identified as the first in vitro inhibitor of AIF. The generality and simplicity of the PC method should enable this technology to find broad utility for identification of compounds that inhibit protein-DNA binding.
Our goal was to develop a high-throughput screen that could be used to identify compounds that prevent the AI-F A). Results from a small section of a screen in which we seek to identify chemical compounds that have the ability to inhibit the binding of AIF to immobilized DNA. Chemical compounds are added to PC biosensor microplate wells along with the protein AIF. Each microplate well incorporates multiple negative control wells with no compound present and positive controls where free DNA serves as a strong inhibitor of AIF binding to immobilized DNA. Here, a single hit is identified. (B). A larger portion of the same screening campaign with the PWV shift data scaled to percent inhibition based on the positive/negative controls. One molecule, ATA, was identified as an inhibitor from a group of ∼1000 compounds shown here. Negative inhibition values represent compounds that enhance the binding of AIF to DNA. (Reprinted with permission from ref 28. Copyright 2008 American Chemical Society.)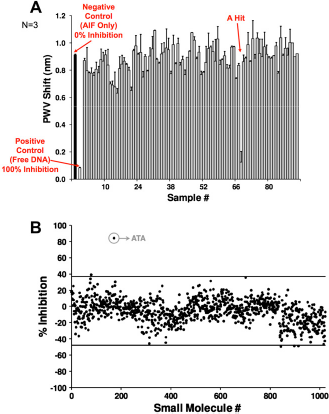
Application in Screening Assays for Cell-Surface Interactions
In addition to registering a positive shift in reflected wavelength because of the adsorption of biomolecular layers, the PC surface also is able to detect the adsorption of large biological structures, including cells. In the same manner that the dielectric permittivity of the PC surface is increased when biomolecules displace water molecules within the evanescent field region, the lipid bilayer of cells and the protein contents of cells will also cause an increase in dielectric permittivity when the cell forms a tight association with the PC surface. Although cells that simply rest on the PC surface will not increase the reflected PWV, those that adhere to the surface produce a large PWV increase at the location of the cell. Because the PC surface may be prepared with biomolecular coatings of antibodies that specifically recognize proteins expressed on the outer surface of cells, or with extracellular matrix (ECM) coatings that promote adhesion, it is possible to specifically gather target cells from a mixed population and to bind cells that would ordinarily be suspended in solution. 30 The advantage of using a PC biosensor as a method for monitoring cell attachment is that no staining of the cells is necessary, so that cells need not be killed for measurement. As a result, cells can be measured directly in their culture environment multiple times over the course of several days (if necessary), and the biosensor microplate may be returned to an incubator among measurements. Using the optical fiber-based detection instrument (Fig. 1A), only a small number of cells are required to register a measurable PWV shift, although measurements represent an averaged PWV shift over the ∼1-mm2 illuminated area. However, a high-resolution imaging detection instrument 31 is capable of measuring the attachment of individual cells and monitoring them over many measurements. The biosensor provides information that is distinct from that provided by optical microscopy from the standpoint that the biosensor is a tool for measuring cell attachment to the surface and how cell adhesion is modulated by changes in the cells’ chemical environment over time.
For example, PC biosensors are used to measure the attachment of cancer cells to the biosensor surface and to quantify how cancer cell proliferation is modulated by the presence of a variety of drugs. Used in this way, the sensor serves as a screening tool that is capable of rapidly identifying drugs from a compound library that induce apoptosis and can subsequently determine the IC50 values of “hit” compounds through a dose-response measurement.32, 33 Cell signaling from membrane receptors, such as G-protein coupled receptors (GPCRs) to integrin proteins that mediate attachment between cells and surrounding tissues is an important area of pharmaceutical research, as GPCRs represent important targets for drug discovery. For example, it has been shown recently that GPCR activation/inactivation can regulate integrin activity, resulting in gross changes in cell morphology and function.
34
One can use the PC biosensor to monitor changes in cell adhesion by first growing a layer of cells on the sensor surface (or on an ECM coating on the sensor surface) and then exposing the cells to drugs that selectively activate a targeted subclass of GPCR. When cells become more thoroughly attached to the biosensor surface (e.g., through a flattening of the cell structure), a positive shift in PWV is measured, whereas a negative shift in PWV is measured when the cells become less attached (e.g., through rounding of the cell structure). As shown in Figure 3, selective activation of different classes of GPCR results in different kinetic characteristics of the cell adhesion as a function of time. For example, activation of the Gq receptors of human embryonic kidney cells results in a rapid increase in cell attachment, whereas activation of the Gi receptor results in a more moderated increase in cell attachment followed by a slow return to the baseline level. In a similar fashion, distinct kinetic responses have been recorded for several cell types in response to muscarinic, opioid, β-arrestin, and P2Y ligands. The sensor response provides more subtle information than simply measuring proliferation or cytotoxicity by recording how cell adhesion and its response over time is modulated by receptor stimulation. As a general-purpose tool, it can be used to study the effects of full agonists, partial agonists, inverse agonists, and receptor desensitization. The system can be used with any type of cell, including overex-pressed, endogenous, primary, or stem.
Kinetic monitoring of the PWV for immobilized human embryonic kidney cells on the PC biosensor surface after exposure to four different drugs that specifically target different GPCR receptors (Gq, Gi, Gs, and G12/13). The response profile represents measurement of changes in the adhesion of the cells induced by GPCR signaling to integrins on the cell surface. Data courtesy of Jason Brown at GlaxoSmithKline.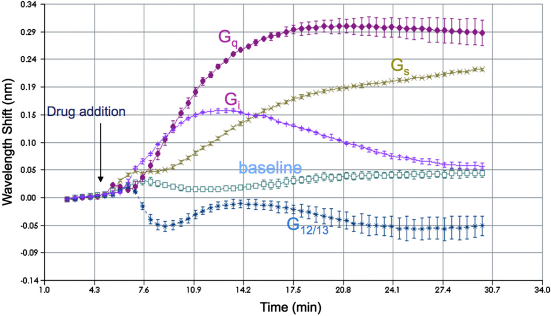
PC FLUORESCENCE ENHANCEMENT
The simultaneous quantitation of multiple proteins in a patient's fluid sample promises to aid researchers seeking to understand protein interaction networks and may potentially be clinically useful for diagnosis and prognosis with serum biomarkers. 35 One approach to multiplexed protein detection has been an adaptation of the DNA microarray format to immunoassays. Fluorescence-based protein microarrays have demonstrated detection limits comparable to their enzyme-based counterparts, enzyme-linked immunosorbent assays, while measuring multiple proteins within each array. These protein microarrays have been adapted and optimized for detection of cancer biomarkers 36 and cytokines37-39 Cy-tokines are a particularly promising class of analytes for multiplexed detection because they rarely act alone and rely on the upregulation or downregulation of multiple cytokines simultaneously to achieve a particular physiological effect. Cytokines are associated with immune responses to infection but may be associated with noninfectious diseases. Because the immune system is integrated with other physiological systems, such as the cardiovascular and gastrointestinal systems, and cytokines often act as a signaling system throughout the body, these proteins may be a valuable tool in understanding and diagnosing disease. Although protein microarrays on optically passive surfaces, such as glass slides have been useful in multiplexed cytokine quantitation, the utility of these arrays can be expanded by a more accurate determination of protein levels and lowered limits of detection.
In recently published reports, we have demonstrated how PC surfaces can be used to achieve improved detection sensitivity and more accurate quantificationof a representative protein biomarker compared with performing the same immunoassay on a glass surface. 20 Using PC-enhanced excitation, we have demonstrated fluorescence enhancement from the fluorescent dye Cyanine-5 (Cy5) 13 and detailed the spectral characteristics of the PC-fluorophore interaction 14 as well as the dependence on distance from the PC on enhanced excitation. 40
We performed a microspot fluorescence immunoassay for the cytokine tumor necrosis factor-α (TNF-α) simultaneously on glass slides and PC surfaces under identical experimental conditions to evaluate the impact of enhanced fluorescence on the assay. The PC used in this work was similar to a combined label-free biosensor and enhanced fluorescence device described previously. 13 Although this PC is capable of label-free detection of proteins that could enable spot density quantitation, we focus on the impact of enhanced fluorescence on the SNR of the assay because this can allow more accurate quantitation of protein levels at the lowest concentrations assayed. Using a nanoreplica molding process, PCs of the size of microscope slides were fabricated for compatibility with commercial microarray spotters and scanners. A layer of SiO2 was added to the PC so an identical surface chemistry interaction can be achieved on both the PC and glass slides. A microspot immunoassay was performed on both substrates using a fluorescent Cy5 label. By evaluating the immunoassay over a concentration series on glass and PCs, the impact of PC-enhanced fluorescence on the assay resolution and detection limit was assessed.
Fluorescence measurements were taken using a commercially available confocal microarray scanner with user-adjustable angle of incidence laser excitation (LS Reloaded, Tecan, Mannedorf, Switzerland) to allow alignment of the PC resonance with the incident wavelength. The PC slides and glass slides were scanned with identical conditions (photomultiplier tube gain, incidence angle). PC slides were scanned at an angle that fulfills the resonant condition at 633 nm (3.2°) and an angle at which no resonance occurs at this wavelength (20°). Array Pro Analyzer (Media Cybernetics, Bethesda, MD) software was used to quantify spot and background fluorescent intensities. ImageJ software was used to generate spatial profiles of the fluorescence data. ProMAT (Pacific Northwest National Laboratory, Richland, WA, http://www.pnl.gov/sta-tistics/ProMAT) was used to fit fluorescence data to a four-parameter logistic model and to calculate the lower limit of detection for the immunoassay. Figure 4A illustrates the enhanced SNR for spots incubated with the lowest concentration of TNF-α (1.6pg/mL), with an estimated SNR enhancement of more than eight times. This SNR enhancement is one component in lowering the detection limit of the immunoassay, which can be addressed in more detail by an analysis of the complete concentration series.
A). Fluorescent intensity images gathered with a confocal laser scanner for ∼100 μm diameter spots of anti-TNFα capture probe after exposure to a 1 pg/mL solution of TNFα and subsequent labeling with Cy5-labeled secondary antibody. At this concentration, detection is near the detection limit when the assay is performed on a glass surface, but the PC surface shows robust SNR. (B). Dose-response characteristic for the TNFα assay, showing enhanced signal using the PC surface. Full assay details are provided in ref 20.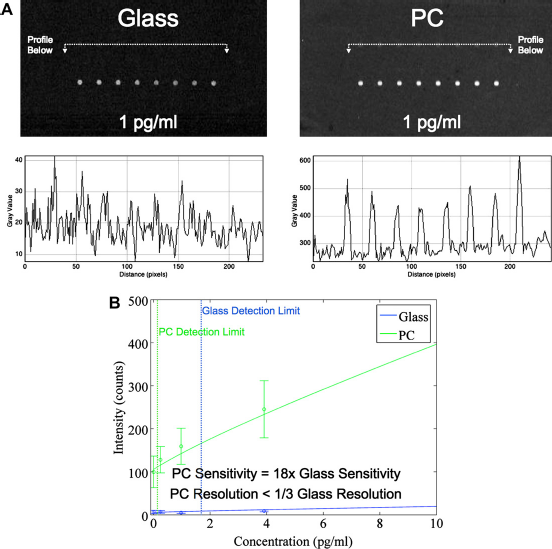
The SNR enhancement allows for an increased fluorescence signal that is higher than a concurrent increase in noise-improvingthe resolution and detection limit. The quantitative lower limit of detection for the resonant PC was 1 out of 3 the limit of the glass slide. Furthermore, the lowest concentration assayed, 1.6 pg/mL, could be detected (but not quantified) above noise on the PC and not on the glass slide. The improvement of these metrics can be attained without an alteration of the basic instrumentation used for a protein microarray experiment, so this technology should be straightforward to implement by laboratories currently pursuing microarray research. A typical dose-response curve for the TNF-α assay performed on both a PC surface and an ordinary glass microscope slide surface is shown in Figure 4B, showing the gain in fluorescence signal that is achieved for low-concentration analyte.
The cytokine TNF-α plays an integral role in the immune response during infection and has been studied as a biomarker for sepsis, a state of acute inflammation throughout the body that is responsible for more than 100,000 deaths a year in the United States. 41 An evaluation of cytokine concentrations in sepsis diagnosis determined that TNF-α could be a useful biomarker with a cutoff value of 11.5 pg/mL, 42 which is below the limit of detection for the glass slide but not the PC in this study. This cutoff is not much higher than normal physiological TNF-α serum concentrations of 5-10 pg/mL,43, 44 which underscores the importance of resolution-a metric that was significantly improved in the PC relative to the glass slide. Although the sensitivity and specificity of TNF-α in sepsis diagnosis are not high enough to warrant its use as a lone biomarker, the addition of other cytokines in the immunoassay may be powerful and is a subject of future study. The protein microarray format lends itself to quantitation of multiple serum proteins at once by spotting capture antibodies to multiple analytes, and accurate, multiplexed cytokine measurement would be a valuable tool in understanding the modulation of the immune system during sepsis.
Combined Label-Free and Enhanced Fluorescence Detection
Recently, we reported on the design and demonstration of an optical imaging system capable of combining high-resolution label-free imaging of a PC surface with PC-enhanced fluorescence. With these two capabilities combined within a single detection system, we demonstrated label-free images self-registered to enhanced fluorescence images with 328 × more sensitive fluorescence detection relative to a glass surface. This technique was applied to a DNA microarray where label-free quantification of immobilized capture DNA enables improved quality control and subsequent enhanced fluorescence detection of dye-tagged hybridized DNA yields 3 × more genes to be detected versus commercially available microarray substrates.
In general, label-free biosensor imaging methods, such as SPR imaging45, 46 and PC imaging do not offer the same level of sensitivity as fluorescence-based methods. However, for most fluorescent surface-based assays, there is no mechanism for quantification of the density of immobilized capture ligand. This capability is especially important for the production of DNA and protein microarrays that are produced by pin-spotting or piezoelectric jet spotting because a large variability exists in spot size and density. 47 The ability to perform lateral force (LF) imaging of immobilized ligand spots would potentially provide a quality control tool for elimination of missing spots or spots with poor characteristics (in terms of density, size, or uniformity) to improve the reliability of microarrays for disease diagnostics based on detection of expressed genes or protein biomarkers. Because the immobilized spot density is typically high, detection by LF methods does not pose a difficult sensitivity challenge, although sufficient spatial resolution is required for imaging capture spots that are 50-200 mm in diameter. Therefore, one application of this technology is the detection of capture spots in LF mode and subsequent detection of fluorescent-tagged analytes in EF mode, where the highest possible level of sensitivity is desired.
A schematic drawing of the LF/EF imaging microscope is shown in Figure 5. A 35-mW HeNe laser chosen to align with the excitation spectrum of the fluorescent dye Cy5 passes through a half-wave plate (for polarization control), a variable neutral density filter, a rotating diffuser (to reduce speckle and fringes at the imaging plane because of spatial coherence), a 10× beam expander, an aperture, and a motorized angle-tunable mirror. The gimbal-mounted mirror sits on top of a motorized linear stage to maintain a constant illumination area on the device as the mirror rotates. The remainder of the imaging path makes use of an Olympus BX-51 upright microscope with a Cy5 filter cube (Semrock, Rochester, NY) and a variety of objectives. Several important features make this implementation ideal for combined EF and LF imaging. First, it uses a common beam path for both imaging modes, facilitating acquisition of spatially registered images of fluorescence and surface-bound molecular density. Second, the use of a charge-coupled device (CCD) rather than laser scanning imaging simplifies the optical setup and enables large-area, high-resolution, and high-throughput analysis. Third, a high-resolution motorized gimbal-mounted mirror and beam-expanded laser provide efficient and selective light coupling to the PC, especially crucial for the narrow resonances that provide optimal fluorescence enhancement and sensitive LF detection. Lastly, other imaging techniques available on the microscope, including reflected brightfield and differential interference contrast, can be overlaid with EF and LF images (Fig. 6).
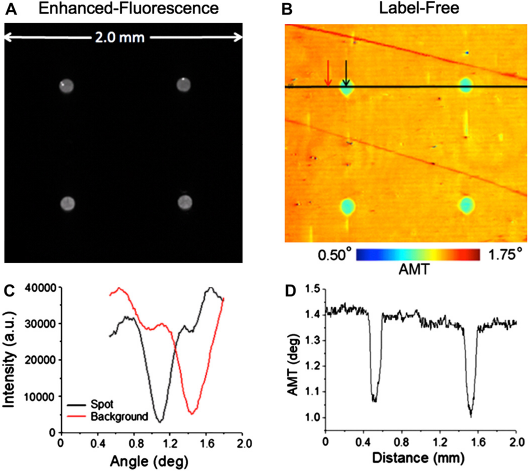
Schematic diagram of the instrument capable of providing high-resolution label-free images on the PC surface and for providing PC-enhanced fluorescence images. The system comprised an ordinary upright fluorescence microscope, but used a collimated laser illumination source with a computer-controlled mirror that allows tuning the incident illumination angle to match the PC resonance condition. (Reprinted with permission from ref 24. Copyright 2009 American Optical Society.) Enhanced fluorescence (A) and label-free (B) images of 50 μg/mL SA-Cy5 spots on a PC. Inverted transmission versus angle response for a pixel inside and outside the SA-Cy5 spot (C) and cross section of the label-free image through 2 SA-Cy5 spots, in (D). Rather than measuring the PWV, the label-free imaging system measures the Angle of Minimum Transmission by illuminating the sensor at a fixed wavelength while scanning the angle of illumination through computer-controlled rotation of the mirror. (Reprinted with permission from ref 24. Copyright 2009 American Optical Society.)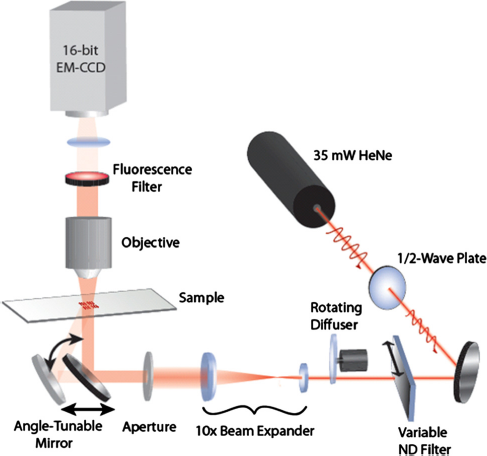
For LF imaging, the laser passes through the neutral density filter, rotating diffuser, and a blank in the filter wheel on the fluorescence microscope. A custom data acquisition and control program (LabView, National Instruments, Austin, TX) translates the motorized mirror mount over a small range of angles and captures a single image for each discrete illumination angle. The resonant angle is computed for each pixel in the image stack by fitting the transmission versus angle data with a Lorentzian lineshape and finding the resonant angle. This resonant angle map is the LF image and can be used to quantify and visualize surface-bound density, as well as to find the appropriate resonant angle for EF imaging.
The EF mode is generally used without the neutral density filter, without the rotating diffuser and with an appropriate fluorescence filter set centered at 690 nm to match the Cy5 spectral emission maximum. For EF imaging, the desired angle of illumination is set in the control software and single images, sequences, or video can be captured.
Before biologically relevant experiments can be performed with a PC sensor, the surface must be functionalized with appropriate reactive groups. We chose to use a vapor-deposited monofunctional epoxysilane monolayer for its low autofluor-escence, high density, and excellent uniformity. 48 The silane group provides covalent linkage to the surface oxide through free OH-groups, whereas the epoxide is highly reactive with proteins through the amino terminus or exposed lysine residues. On successful surface functionalization, 300 pL spots of SA-Cy5 at a range of concentrations from 50 mg/mL down to 24 ng/mL in 0.1% trehalose in phosphate-buffered saline (PBS) were deposited onto the PC using a noncontact piezoelectric spotting system (Perkin Elmer Piezorray). After overnight incubation, the SA-Cy5 spots were washed in 0.1% Tween in PBS and then distilled water with gentle agitation and subsequently dried under nitrogen.
A LF image was constructed by first imaging laser transmission through the SA-Cy5-immobilized PC for a range of angles, fitting the resonance profile pixel-by-pixel for 100 angles and then generating a spatial map of the resonant angle across the imaged area. A 4× 0.10 NA objective (Olympus) was used to yield a 4-mm2 imaged area. For each LF image captured, on-resonance fluorescence images were also gathered. Figure 4A and B show precise registration between the EF and LF images, respectively.
To demonstrate the potential utility of combined EF and LF imaging, a DNA microarray experiment was carried out on PC and control glass slides. PC slides were functionalized with (3-glycidoxypropyl) trimethoxysilane at 185 mTorr overnight and were run in the experiment in parallel with commercially available glass microarray slides (Corning UltraGAPS). Both PCs and glass slides were spotted with a set of 192 different 70-mer oligonucleotide sequences representative of known
Comparing fluorescence images on the PC with those captured on the control glass slide allows for a clear demonstration of the significant fluorescence enhancement that can be achieved for DNA microarrays using the instrumentation and PCs described and characterized in this work. Figure 7A shows an EF image of an area containing 64 spots where the laser illumination has been aligned to the resonance angle. A second image was captured of the same area for laser illumination; several set degrees off of the resonance angle (not shown). Figure 7B contains a third image that was captured of the same array pattern on a glass slide substrate. The spot size variation between the glass and PC surface is because of differences in the hydrophobicity between the commercially and laboratory prepared surface chemistries. Gain and exposure settings were held constant for the acquisition of these three images. Registered cross-section profiles through five replicate spots are given for the three devices in Figure 7C, demonstrating 11.5× excitation enhancement (from off- to on-resonance on the PC) and 9.3 × extraction enhancement (from the glass slide to the PC illuminated off-resonance). The effects of these multiply to provide up to 109 × total fluorescence enhancement (from glass slide to PC on-resonance). Using the greater sensitivity afforded by the PC surface, three times as many genes on the PC versus the glass slide exceed the detection limit, resulting the capture of gene expression information from genes that ordinarily would have been classified as unexpressed.
24
Fluorescence image of hybridized DNA microarray on a PC illuminated on-resonance (A) and on a control glass slide (B). Intensity cross sections through five replicate spots for the PC illuminated on-resonance, illuminated off-resonance, and for the glass slide (C). (Reprinted with permission from ref 24. Copyright 2009 American Optical Society.)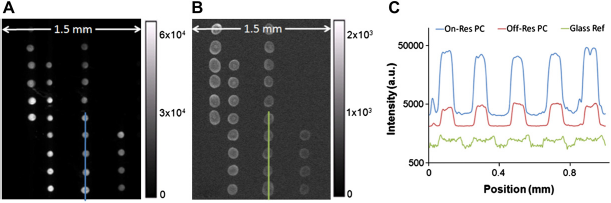
PC-Enhanced Sers
We have recently demonstrated that the resonant near-fields of a large-area replica molded PC slab can efficiently couple light from a laser to SiO2-Ag “post-cap” nano-structures deposited on the PC surface by a glancing angle evaporation technique for achieving high SERS enhancement factor. Although enormous enhancement factors have been achieved using metal structures, further enhancement of Raman signals is still desirable to reduce laser power and accumulation time for detection of trace quantities of analytes.
We used the glancing angle deposition (GLAD) technique
49
to create a high density coating of electrically isolated Ag nanoparticles that are supported vertically from the PC surface on 50 nm-tall SiO2 dielectric posts (Fig. 8). The GLAD technique has been demonstrated to be a simple method for fabrication of metal structures with high SERS enhancement factor because the randomly distributed and sized Ag nanostructure has numerous interconnections and strong EM field within the gaps among the nanoparticles.
50
Figure 8A shows a cross-sectional schematic of the PC-SERS substrate, comprising a one-dimensional PC slab and a SiO2-Ag “post-cap” nanostructure coating.
A). Cross section schematic of the PC surface structure used for PC-SERS. The PC surface is covered with a layer of dielectric nanorod “posts” that each support a 20-30 nm diameter Ag “cap” for obtaining the SERS effect. The design goal is for the Ag caps to reside within the evanescent field region of the PC when it is illuminated with a laser at a combination of wavelength and incident angle that excites an optical resonance. (B). Scanning electron microscope photo of the post-cap structures, (C). Measured SERS signals from a layer of BPE, comparing the SERS intensity with the post-cap structures without a PC (GL-SERS curve), with a PC illuminated at an angle that does not excite resonance (PC-SERS (off)) and at an angle that excites resonance (PC-SERS (on)). (Reprinted with permission from the American Physical Society, 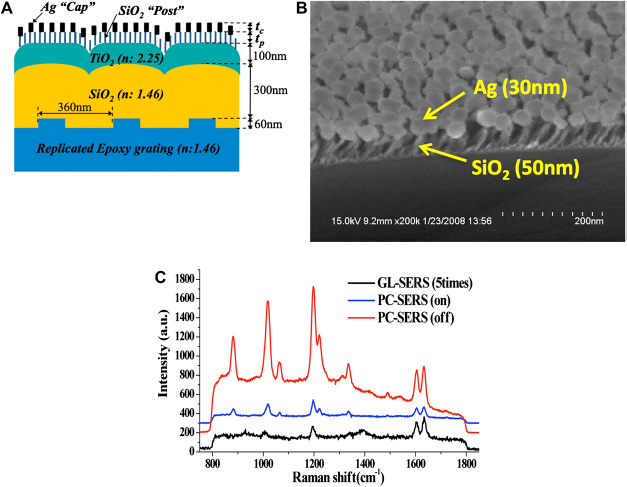
For experimental verification of the enhancement effects of PC—SERS, Raman spectra of trans-1,2-bis(4-pyridyl)-ethane (BPE) on ordinary microscope glass-coated SERS (GL-SERS) and PC—SERS substrates were measured and compared. The Raman detection instrument comprised a transverse electric polarized Argon-dye laser excitation source (Coherent, INNOVA-90 and CR-500, λ = 600 nm, output power = 82 mW), a sample holder with a rotational stage, a power meter to measure laser transmittance through the sample, imaging optics, a spectrometer (SPEX-Triplemate), and a cooled CCD (Princeton Instruments). Raman scattered light was collected from a 235.4 × 51.8 μm2 area, and the diameter of the laser beam spot was ∼470 μm. A 2-μL droplet of BPE dissolved in methanol (1 × 10⁻⁴ M) was applied to each substrate by pipette. The BPE/methanol droplet spread out to form a circular region with a diameter of
Figure 8C shows the Raman spectra obtained from BPE using both GL-SERS and PC—SERS substrates at on/off resonance conditions, where the spectrum for the GL-SERS substrate was multiplied by a factor of 5 to enable visualization. The Raman signal was defined as the integrated intensity of the 1200-cm−1 peak after subtraction of the background signal. Our results show that the Raman signal from the PC—SERS substrate increased significantly. The enhancement effect on the Raman signal because of the PC is observed throughout the entire concentration range, with an enhancement factor of 10—30× between GL-SERS and on-resonance PC—SERS.
Pc Laser Biosenosrs
A wide variety of optical resonator structures have been used for label-free detection of chemical compounds, biomolecules, and cells.51, 52 Several approaches have been commercially developed for application in life science research, environmental monitoring, quality control testing, and diagnostic testing.18, 53 Label-free resonant optical sensors generally detect shifts in resonant wavelength or coupling angle caused by the interaction between the target molecule and the evanescent portion of the resonant modes. The narrow spectral linewidth achieved by using high
A schematic cross-sectional diagram of the designed DFB laser structure is shown in Figure 9.63, 64 The low refractive index polymer layer applied to the substrate functions as a cladding layer, on which a thin film of high refractive index polymer provides vertical light confinement and feedback along the horizontal direction. Doped with laser dye, this high refractive index layer also contributes to the light amplification of the cavity oscillation mode. Altering the refractive index of the media exposed to the DFB laser surface or surface adsorption of biomolecules changes the effective refractive index associated with the resonant mode and results in modulation of the stimulated emission wavelength. By controlling the guidance layer thickness, the DFB laser is designed to exhibit single-mode radiation to facilitate determination of the laser wavelength shift.
A). Cross section schematic of the surface structure used to create a PC DFB laser biosensor. Like other PC structures, a replica molded grating surface is produced on a flexible plastic substrate. A thin film of polymer that contains a laser dye is applied on top of the grating to provide a gain medium for lasing. (B). Narrow bandwidth output of the laser biosensor, showing a peak that is less than 0.1 nm wide. (C). Measurement of laser emission wavelength as a function of time for detection of human IgG adsorbed to immobilized Protein A for various concentration. (Reprinted with permission from ref 64. Copyright 2008 American Physical Society.)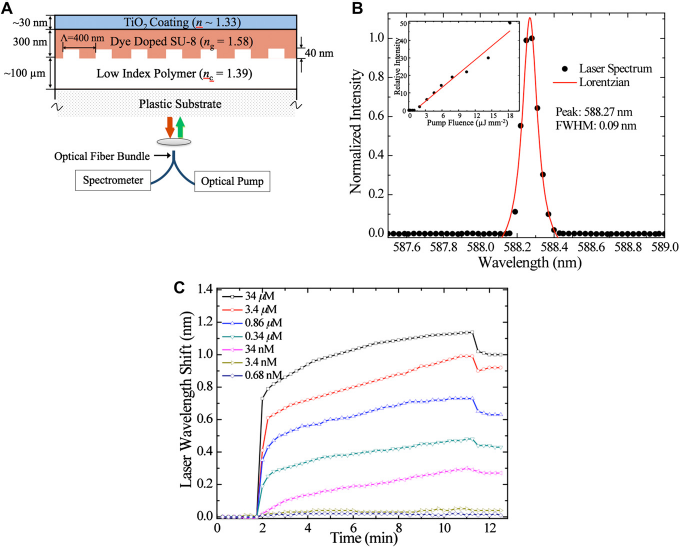
Conclusion
As shown in the preceding examples, PC surfaces offer a variety of capabilities for applications in pharmaceutical high-throughput screening, gene expression analysis, disease diagnostics, and life science research through the ability to detect adsorbed analytes in a label-free fashion and the ability to amplify the output of fluorescence and SERS measurements. The PC surfaces can be inexpensively fabricated from plastic-based processes and incorporated into a variety of liquid handling format used for biological assays. Detection instruments for PC-based label-free detection are simple and robust, with options that enable rapid screening of micro-plate wells with quantitative kinetic information and options for high-resolution imaging of adsorbed analytes for applications, such as label-free microarrays, cell proliferation, and cell Chemotaxis. PC surfaces for enhanced fluorescence may be designed for compatibility with commercially available confocal fluorescence laser scanners; but for optimal performance, a specially adapted fluorescence microscope with a collimated laser excitation source is most desirable. The enhanced fluorescence microscope has the added benefit of simultaneously providing label-free detection of the PC surface, providing a means for evaluating the density of immobilized capture ligands. New applications for PC surfaces continue to emerge, including amplification of SERS, and the development of label-free biosensors with improved detection resolution through the incorporation of active dyes in the PC structure that enable the structure to provide laser output with extremely narrow bandwidth. As PC surfaces and detection instrumentation become more widely available, additional applications in the areas of cell membrane receptor imaging, single fluorophore detection, and DNA sequencing are expected to emerge.
Footnotes
Acknowledgment
The author is grateful for financial support provided by National Science Foundation (NSF CBET 07-54122), National Institutes of Health (R01 CA118562 and R01GM086382), and SRU Biosystems. Any opinions, findings, and conclusions or recommendations in this work are those of the author and do not necessarily reflect the views of the funding agencies. As this article is a review article, it represents the efforts of many talented and dedicated individuals. In particular, the author would like to acknowledge the contributions of Prof. Paul Hergenrother at the University of Illinois for his collaboration in small molecule screening, Prof. Lila Vodkin at the University of Illinois for her collaboration in gene expression analysis, and Dr. Lance Laing from SRU Biosystems for directing the cell-based assays reported here. The author gratefully acknowledges Dr. Julio Martin and Dr. Jason Brown from GlaxoSmithKline for the GPCR data shown in ![]() . The research of postdoc associate Seok-min Kim and graduate students Leo Chan, Maria Pineda, James Heeres, Meng Lu, Ian Block, Wei Zhang, Patrick Mathias, Vikram Chaudhery, and Nikhil Ganesh are summarized in the article. The author discloses that he is a founder and CTO of SRU Biosystems.
. The research of postdoc associate Seok-min Kim and graduate students Leo Chan, Maria Pineda, James Heeres, Meng Lu, Ian Block, Wei Zhang, Patrick Mathias, Vikram Chaudhery, and Nikhil Ganesh are summarized in the article. The author discloses that he is a founder and CTO of SRU Biosystems.