
Abstract
Robotic liquid-handling systems using fixed reusable pipetting tips are used not only in fully integrated in vitro clinical diagnostic analyzers, but also in open platform robotic liquid-handling systems. These are not confined to particular diagnostic assays, as customers adapt a large variety of assays on these platforms. One major problem with the use of fixed, reusable tips is the carry over (CO) of analyte from sample to sample. Despite widespread use of fixed tips in open platform systems, systematic studies on procedures to quantify CO for analytes other than nucleic acids are missing. In a consortium with three liquid-handling system suppliers and one coating specialist, we developed test procedures for the quantification of CO. The procedures were standardized and tested with the analytes fluorescein, immunoglobulin G, and hepatitis B surface antigen as model substances for small organic molecules, antibodies, and complex biomolecules. The test procedures allow the reproducible quantification of the CO with intra- and interassay precisions of less than 6% coefficient of variation. They were used to investigate the effect of different tip coatings on the CO of the three analytes. Fluoropolymers, inorganic-organic nanocomposites, sodium-silicate glass, titanium dioxide, and silicone resins, which are used in special applications, showed only small differences in CO. The CO test procedures can be easily transferred to different liquid-handling systems and used with different analytes.
Introduction
Robotic liquid-handling systems have found widespread use in in-vitro clinical diagnostics and also in pharmaceutical, biotechnological, forensic, environmental, and research laboratories where a highly diverse number of assays are run on automated systems. Central to all systems is the pipetting of liquid samples, which contain one or multiple analytes and reagents. Pipetting in liquid-handling systems is achieved either by fixed reusable tips or by disposable tips. Disposable tips for robotic use are expensive; they require conductive polymer material to allow commonly used capacitive liquid-level detection, and tip racks must fulfill stringent tolerance criteria to allow consistent tip pick-up by robotic arms. Assays usually require a large number of pipetting steps and the use of disposable tips can thus substantially increase assay costs. 1 In addition, assay throughput can be limited by tip logistic (space occupied on the worktable, disposal of used tips as clinical waste). Accordingly, the use of fixed reusable tips is an attractive alternative. The major problem with fixed tips is carry over (CO). The CO is the process by which materials are carried into a reaction mixture to which they do not belong. 2 These materials can be either the sample itself, that is, the respective analyte or the reagents used during the assay. Sample-to-sample CO (also termed as sample cross-contamination) can occur when a sample containing a high analyte concentration precedes one with a low (or zero) analyte concentration. The CO from the first to the second sample may cause the second sample to become false positive.
Therefore, manufacturers of in vitro diagnostic analyzers have to ensure that CO does not significantly affect results by carefully optimizing the pipetting and washing procedures for each analyte. In the guideline for the preliminary evaluation of quantitative clinical laboratory measurements from the Clinical and Laboratory Standards Institute, a procedure for the analysis of linearity, bias, precision, drift, and sample CO is proposed. 3 Three samples of high, medium, and low analyte concentration are used. They are measured within one series in the order medium, high, low, medium, medium, low, low, high, high, and medium. This series of 10 measurements should be repeated 20 times. All the data are then analyzed in a multiple regression procedure, which simultaneously calculates effects of linearity, bias, precision, drift, and sample CO. The multiple regression is based on the assumption that sample CO is linearly dependent on the concentration of the preceding sample-an assumption that is difficult to verify over the full range of analyte concentrations. Alternate test procedures involved three measurements of a sample with high analyte concentration followed by three measurements of a sample with low analyte concentration 2 4 ; three identical high samples followed by five low samples 5 or two identical high samples followed by two low samples. 6 7 Similar procedures were used to describe the absence of clinically significant CO in commercial in vitro diagnostic analyzers. 5 8 14 However, in these publications, pipetting and washing procedures are not described in detail.
In contrast to fully integrated in vitro diagnostic analyzers, open platform robotic liquid-handling systems are not confined to particular diagnostic assays, as customers adapt all kind of assays on these platforms. Despite widespread use of fixed tips in these systems, we are not aware of systematic studies on procedures to quantify CO in such liquid-handling systems for analytes other than nucleic acids. The CO of nucleic acids has been investigated by several groups (Frégeau et al. 15 and references therein).
Together with a consortium of three liquid-handling system suppliers, we have therefore established and validated test procedures for measuring the CO of three model substances, a small organic molecule, a protein, and a lipid protein complex. Procedures were developed such that they can be easily adapted on each platform and used with different analytes. In the present paper, the development, set-up, and performance characteristics of the standard test procedures are described together with their ability to analyze the effects of different tip coatings on carry over. In a second paper, we will describe the use of the standard test procedures to reduce the CO to below required levels by optimization of the wash procedure (Iten et al., manuscript in preparation).
Materials and methods
Liquid-Handling System
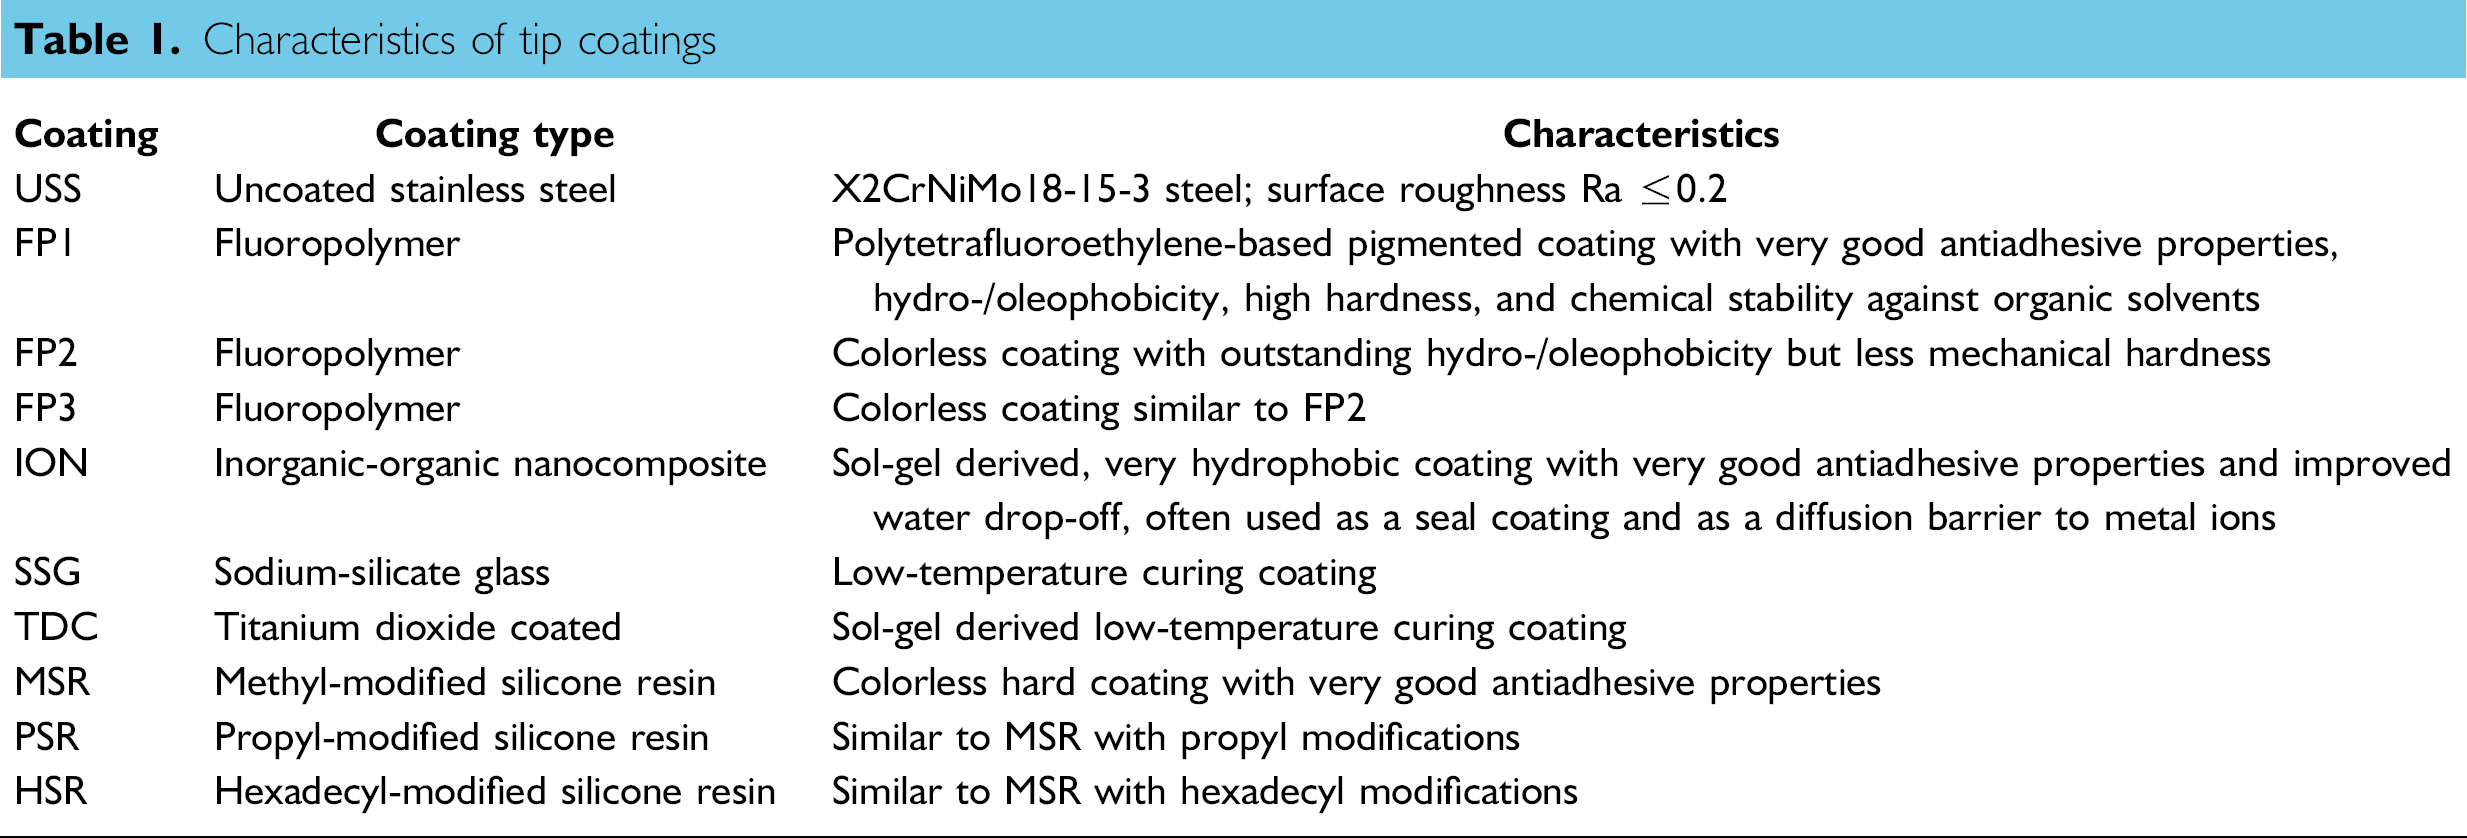
Standard test procedures for measuring CO were developed on a commercial liquid-handling system (Freedom EVO, Tecan Schweiz AG, Mannedorf, Switzerland) equipped with eight pipetting channels, a membrane pump, and a wash station (Low Volume Wash Station; Tecan Schweiz AG). Four channels were equipped with fixed multiuse tips and the remaining four channels were equipped with adapters for disposable tips, which were used for pipetting of calibration samples, reagents, and diluents. Fixed tips of different liquid-handling systems have different geometries. Therefore, special tips with a simplified geometry (hollow cylinder; length: 160 mm; outer diameter: 2 mm; inner diameter: 0.8 mm) were used in this study to allow transferability of methods to the different liquid-handling platforms and comparability of results. The suitability of the test procedures for differentiating the effects of different tip coatings was evaluated with stainless steel tips, which were either left uncoated or which were coated inside and outside with fluoropolymers, inorganic-organic nanocomposite (ION), sodium-silicate glass (SSG), titanium dioxide, and different types of silicone resin coatings (Table 1). All coatings were produced by Surface Contacts GmbH, Saarbrücken, Germany.
Characteristics of tip coatings
The liquid-handling systems from Tecan, Hamilton and Sias use water purified by reverse osmosis or ion exchange as the wash solution. In the Freedom EVO liquid-handling system, water purified by reverse osmosis was used as system liquid for pipetting and was selected as the washing solution for developing the CO standard test procedures.
Procedures to Provoke CO
The CO procedure was developed such that it could be used for the three analytes tested in this study and that it can be easily adapted to further analytes.
Before each CO run, fixed tips were cleaned by pumping 50 mL of wash solution through the tip into the waste, followed by a wash step with 100 mL of wash solution in the wash station (inside and outside wash using the membrane pump).
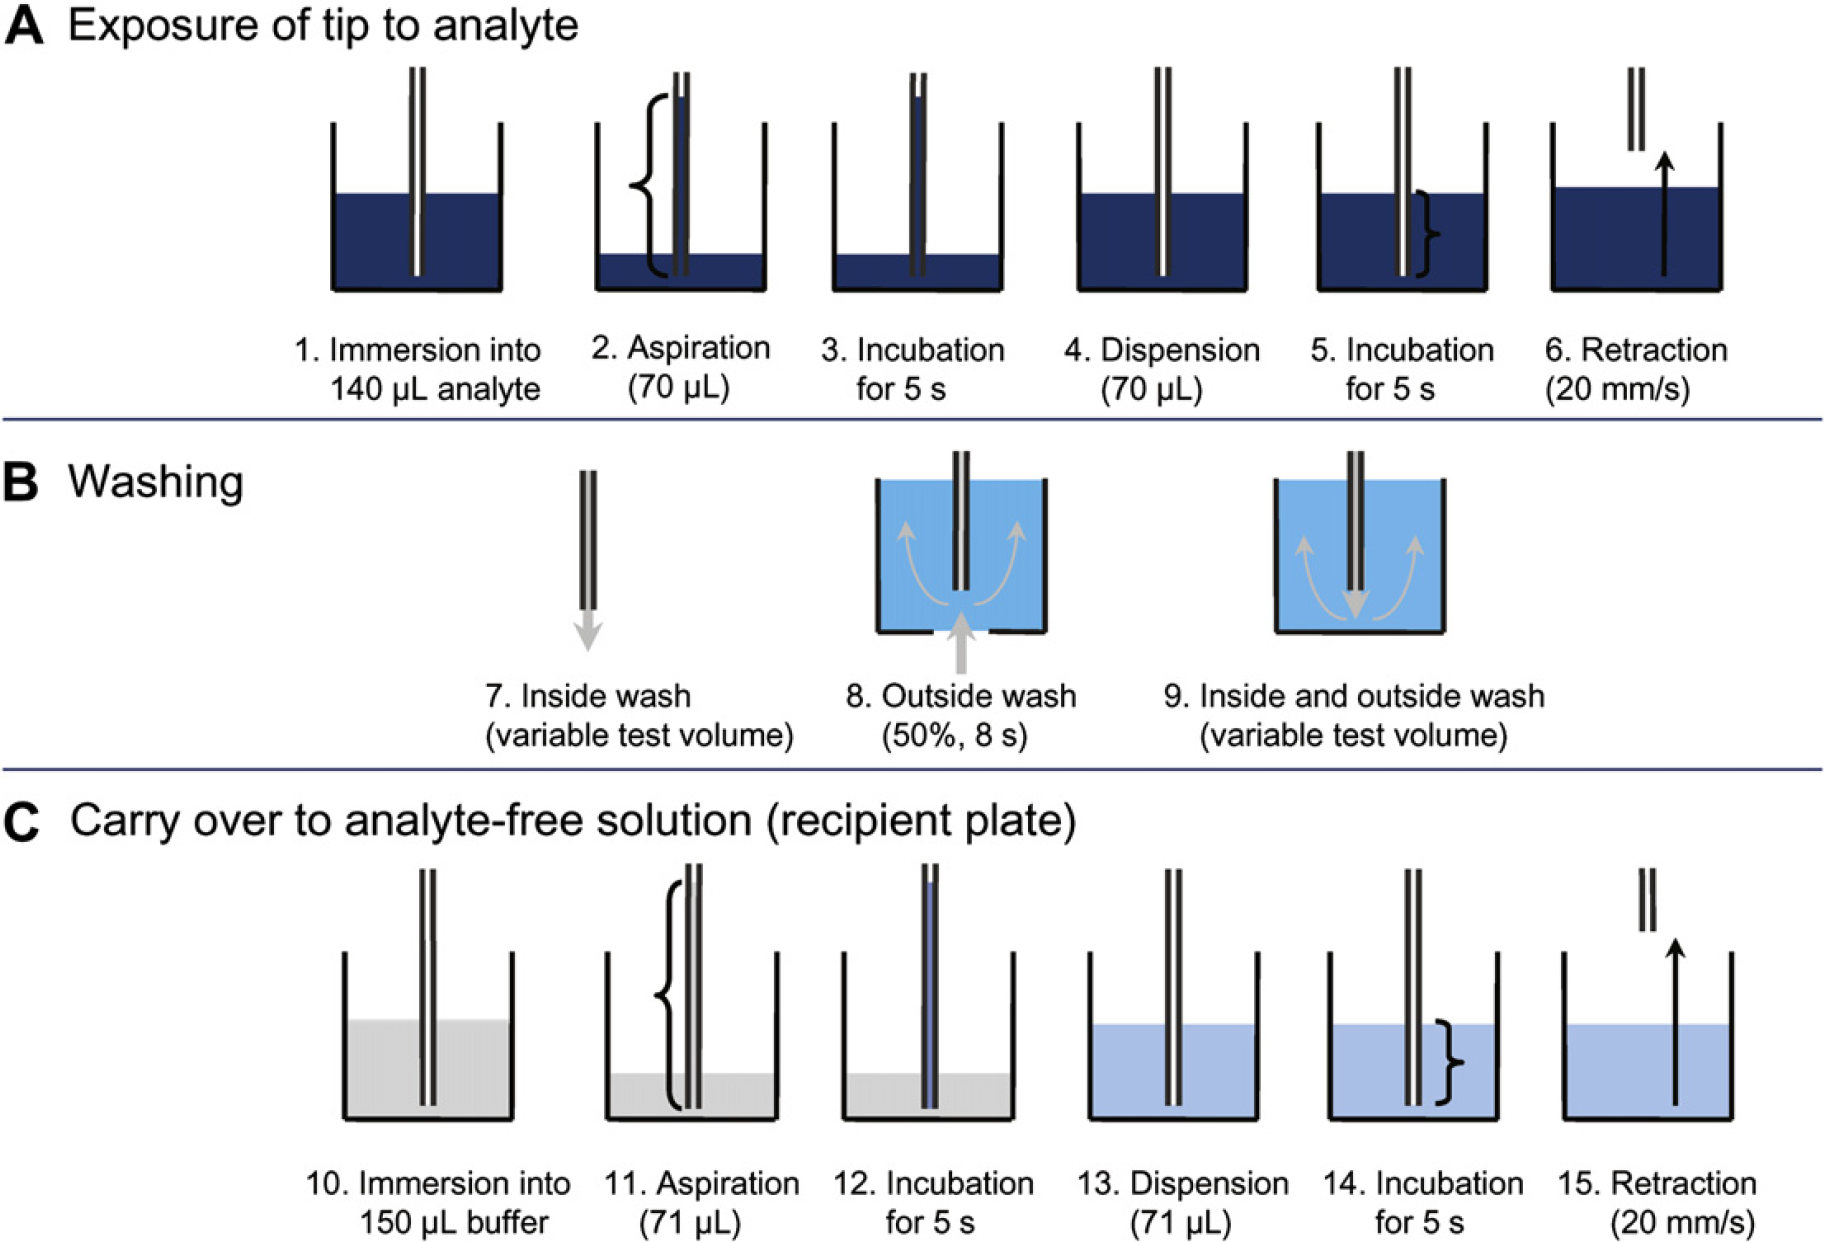
The CO was provoked by the procedure shown in Figure 1, with two 96-well plates placed on the worktable. One plate contained the analyte stock solutions, whereas the second served as a recipient plate for measuring the CO and contained buffer. The tips were immersed into the analyte stock solution (140 μL per well) with a tip end position of 0.75 mm above the bottom of the plate, resulting in an immersion depth of 3.5 mm. Analyte stock solution (70 μL) was aspirated at an aspiration speed of 150 μL/s, which resulted in an aspirated column height of 139.3 mm. The analyte solution was kept in the tips for 5 s, and was then dispensed back into the same well with a dispension speed of 600 μL/s. The tip position remained at 0.75 mm above the bottom of the plate for another 5 s before the tips were retracted from the solution. Subsequently, the tips were washed in a three-step procedure: First, the inside of tips was rinsed with 13-mL wash solution with the tip positioned above the waste tray (pump speed 0.9 mL/s). In the second washing step, the outer surface of the tips was washed in the wash station using the membrane pump (8 s, pump speed 50%, which corresponds to 18.75 mL/s). In the third washing step, the tips were washed inside and outside by pumping 13 mL through the tip. After the wash procedure, the tips were positioned in the recipient CO plate wells containing 150 μL of buffer at a height of 0.75 mm above the bottom of the plate, resulting in an immersion depth of 3.8 mm. Buffer (71 μL) was aspirated with an aspiration speed of 150 μL/s, which resulted in an aspirated column height of 141.3 mm. The buffer was kept in the tips for 5 s, and then dispensed into the same well. The tip position remained at 0.75 mm above the bottom of the plate for another 5 s before the empty tips were retracted from the solution. In initial experiments, the CO samples were transferred with disposable tips from the recipient plate into the enzyme-linked immunosorbent assay (ELISA) plates for immunoglobulin G (IgG) and hepatitis B surface antigen (HBsAg) quantification, respectively. Further experiments showed that the CO could be provoked directly in the coated and blocked ELISA plates used as recipient plates for both IgG and HBsAg, which allowed the assay time to be reduced. Performing the CO directly in the ELISA plates affects the incubation time of samples with capture antibodies. However, it was found that there was no difference in the measured concentrations of IgG and HBsAg when sample incubation times differed by not more than 30 min.
Before the next CO measurement, the tips were thoroughly cleaned by pumping 5 mL of wash solution through them, followed by a 50 mL wash in the wash station using the membrane pump.
One CO measurement run consisted of three identical series of five CO measurements with four tips in parallel. The five CO measurements were performed consecutively with decreasing wash volumes from 26 to 11, 6, 3.5, and 2 mL. For each of these wash conditions, half of the volume was pumped through the tips into the waste (Fig. 1, step 7) and the other half of the wash volume was pumped through the tip in the wash station (Fig. 1, step 9). Samples were arranged on one 96-well plate together with the calibration samples and blank samples in duplicates.
Fluorescein Assay
Detection limits of seven highly sensitive fluorescence dyes (Fluorescein sodium, Atto 550 NHS, CY3 NHS, Atto 647 NHS, CY5 NHS, Alexa Fluor 647 and Mega 520 NHS) were determined in a microplate fluorescence reader (POLARstar OPTIMA; BMG Labtech, Offenburg, Germany). The lower limit of detection (LLOD) was calculated from the average signal of multiple measurements of a blank sample plus three standard deviations thereof. Fluorescein sodium and Atto 550 NHS were the most sensitive dyes with a limit of detection of 1.8 pg/mL. Fluorescein was selected for CO measurements.
Fluorescein CO assays were performed in a black 96-well plate (polypropylene, F-bottom, Greiner bio-one, St. Gallen, Switzerland). The fluorescein stock solution was made of 1-mg/mL fluorescein sodium (Merck, Darmstadt, Germany) in 50-mM Tris buffer (pH 8.5) supplemented with 0.01% Triton X-100. The fluorescein stock solution plate was filled with 140-mL stock solution per well. The recipient plate was filled with 150-μL buffer per well. Eleven calibration samples (1 pg/mL to 23 ng/mL in buffer) were prepared by serial dilution using disposable tips. Concentrations of fluorescein were determined after provocation of CO by fluorescence measurements in top reading mode with 50 flashes per well. The excitation wavelength was 490 ± 5 nm, and the emission wavelength was 540 ± 5 nm. The gain was adjusted such that the signal from the most concentrated calibration standard solution was about 95% of the maximum measurable signal.
IgG Assay
The IgG stock solution was made of 4.48 μg/mL IgG (Chrompure mouse IgG; Jackson Immuno Research, Wet Grove, PA) in phosphate buffered saline (PBS, pH 7.4) supplemented with 0.05% Triton X-100 (PBST). Eleven calibration samples (10 pg/mL to 50 ng/mL in buffer) were prepared by serial dilution using disposable tips.
Concentrations of IgG were determined with an in-house sandwich ELISA, which had been optimized for sensitivity. ELISA plates (Maxisorp; Nunc Immuno, Roskilde, Denmark) were coated with capture antibody (goat anti-mouse F(ab')2 IgG; Jackson Immuno Research, Wet Grove, PA) at 1 μg/mL in coating buffer (10 mM sodium phosphate, 250 mM NaCl, pH 7.6) for 16 h at 4 °C. After removal of the coating solution, wells were blocked with StartingBlock PBS (Pierce, Rockford, IL) for 20 min at room temperature, followed by three washing steps with PBST.
After provocation of CO, the plate was incubated for 1 h at 37 °C. The analyte solution was discarded carefully to prevent cross-contamination. The plate was washed twice with PBST. Subsequently, detection antibody (HRP-conjugated goat anti-mouse IgG, Jackson Immuno Research; 1.6 μg/mL in StartingBlock T20; Pierce, Rockford, IL) was added and incubated for 30 min at 37 °C. After washing the plate six times with PBST, the substrate solution (orthophenylene-diamine in peroxide substrate buffer; Pierce, Rockford, IL) was added. The enzyme reaction was stopped with 2 M H2SO4 after incubation for 30 min at room temperature. Absorbances were read in a microplate reader (POLARstar OPTIMA; BMG Labtech) using the 490-10 absorbance filter and 50 flashes per well. Plates were washed using a plate washer (Skan Washer 300, Version B; Molecular Devices, Bucher Biotec, Basel, Switzerland).
HBsAg Assay
HBsAg stock solution (32.9 μg/mL) was prepared by diluting recombinant HBsAg (ayw) (Genovac, Freiburg, Germany) in PBST. Nine calibration samples (15 pg/mL to 6 ng/mL in buffer) were prepared by serial dilution using disposable tips.
A commercial assay for the detection of HBsAg (Enzygnost HBsAg 5.0 kit; Dade Behring, Deerfield, IL) was used. This assay is semiquantitative but was transformed to a quantitative assay by using a standard curve. The kit contains a precoated and preblocked assay plate, which was used directly for the assay.
After provocation of CO, the HBsAg assay plate was incubated for 1 h at 37 °C. The analyte solution was discarded carefully to prevent cross-contamination. The plate was washed twice with PBST. The detection antibody (biotinylated monoclonal mouse anti-HBsAg) was incubated for 30 min at 37 °C. After washing the plate four times with PBST, the streptavidin-HRPO conjugate was added and incubated for 30 min at 37 °C. After a further washing step (five times with PBST), the substrate solution (1-Step ultra TMB; Pierce, Rockford, IL) was added. The reaction was stopped with 2 M H2SO4 after incubation for 30 min at room temperature in the dark. Absorbances were read in a microplate reader (POLARstar OPTIMA, BMG Labtech) using the 450-10 absorbance filter and 50 flashes per well.
Quantification

with β being the concentration of the analyte (ng/mL), S the signal (OD or fluorescence), S Bottom the signal at an analyte concentration of 0 ng/mL, STop the signal at analyte saturation, EC50 the effective concentration of the analyte to reach 50% of the signal, and h describing the slope of the curve. GraphPad Prism 5.0 was used to calculate the 4PL fits. Sample concentrations were determined from the 4PL fit using eq 1. To determine the LLOD and the lower limit of quantification (LLOQ), a blank (the respective assay buffer) was measured six times. The LLOD was calculated from the average signal of the six measurements plus three standard deviations thereof. The LLOQ was defined as five times the limit of detection. The upper limit of quantification (ULOQ) was defined as the highest measurable value that showed a coefficient of variation (CV) smaller than 20%.

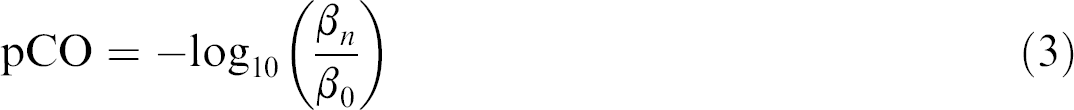
As CO values may be very small, pCO was defined as the negative logarithm of CO.
Results
Selection of Analytes
Three analytes were selected as models for studying CO and for the development of standardized test procedures. Fluorescein is a fluorophore with a molecular mass of 376 Da and carries two negative charges. Fluorescein shows a very strong fluorescence intensity, and thus an extremely low CO (pCO = 8.8) can be detected. Measurement of fluorescein CO requires only a fluorescence reader and can thus be carried out in many laboratories. IgG is not only a clinically relevant analyte but is also widely used in pharmaceutical and biotechnological industries where mid-to high-throughput screenings are used, for example, for target identification. IgG has a molecular mass of 150,000 Da. As the third model, we selected HBsAg. HBsAg is composed of particles with a diameter of 17e22 nm, formed by a lipid bilayer into which the S protein of hepatitis B virus is integrated. HBsAg particles can be found in serum from patients infected with hepatitis B virus. HBsAg particles are also recombinantly produced in yeast and are used as a prophylactic vaccine against hepatitis B. Recombinantly produced HBsAg is noninfectious and nontoxic and can thus be used under standard laboratory safety conditions. Both IgG and HBsAg were quantified by ELISA.
Performance Characteristics of Analyte-Specific Detection Assays
The performance characteristics of the analysis methods for quantifying fluorescein, IgG, and HBsAg are given in Table 2. The lower limits of detection were between 1.8 and 40 pg/mL. Intra-assay CVs were determined by 10 measurements of the same sample. The inter-assay CVs were determined in six independent assays.
Performance characteristics of analysis methods
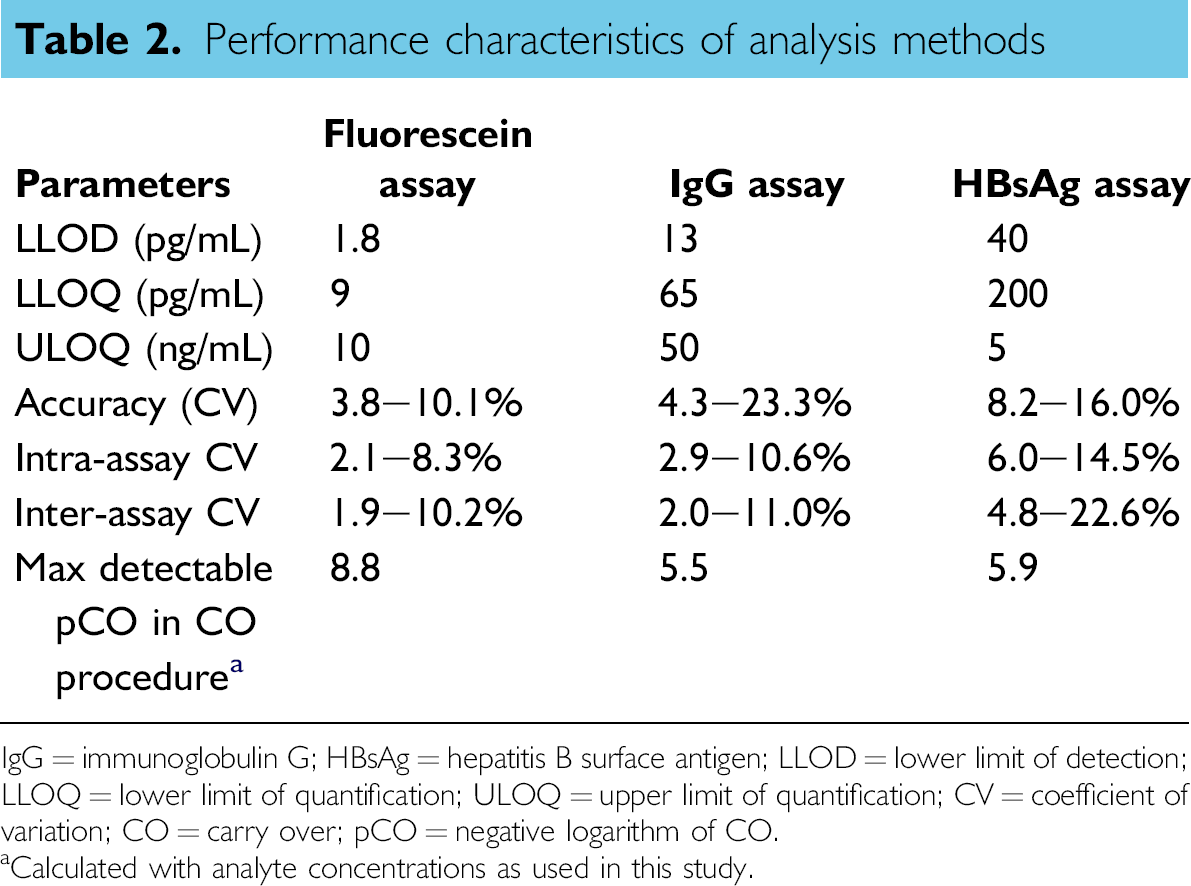
IgG = immunoglobulin G; HBsAg = hepatitis B surface antigen; LLOD = lower limit of detection; LLOQ = lower limit of quantification; ULOQ = upper limit of quantification; CV = coefficient of variation; CO = carry over; pCO = negative logarithm of CO.
Calculated with analyte concentrations as used in this study.
Establishment of a Standardized CO Provocation Procedure
The CO was provoked in a three-step procedure. First, the tips were exposed to highly concentrated analyte solutions to allow adsorption of the analytes to the tips. Thereafter, the tips were washed in a standard washing procedure and finally the tips were exposed to an analyte-free buffer solution to allow CO of remaining analyte to occur. This procedure replicates the situation where a sample with high analyte concentration is followed by a sample lacking analyte, which may lead to a false-positive result for the second sample.
Sample-to-sample CO is not only influenced by the type of analyte and its concentration, but also by multiple parameters of the pipetting procedure. The immersion depth during aspiration determines the area of the outer surface of the tip, which comes into contact with the analyte. The volume of as-pirated analyte determines the area of the inner surface, which is covered by analyte solution. After aspiration, the tip is retracted out of the solution and positioned over the target dispension position. This transfer takes some time, which adds to the contact time of the analyte with the inner surface of the tips. The times needed for aspiration and dispension are usually very short compared with the transfer time and aspiration, and dispension speeds were kept constant throughout this study. In liquid-handling systems, the retraction speeds of the tips out of the solution are optimized to avoid drop formation; therefore, standard settings of the liquid-handling system were used.
We chose conditions in which CO was likely to occur (large aspiration volume, long contact time) but which, nonetheless, were within the range used in the common practice. A washing step was also integrated, as minimal washing will always have to be used with fixed tips. After prescreening of parameters and conditions, a test procedure was defined (Fig. 1) and its performance tested.
A highly concentrated stock solution of analyte was aspirated and kept in the tips for 5 s. This was estimated to be the maximum contact time of analyte solution and tip between aspiration and dispension. Depending on worktable layout and parallel processes, it can take a few seconds to reposition the tips from start to target positions. To provoke potential CO from the outer surface, tips were kept immersed in the stock solutions for 5 s.
In initial experiments, we observed, as expected, that the washing procedure can have a strong influence on the CO. However, the influence differed between analytes and tip coatings. We therefore decided to integrate the determination of CO for five wash conditions into one CO measurement run. The conditions differed by the volume of wash solution used. During the first CO measurement, the tips were washed with 26 mL, followed by 11 mL for the second measurement, 6 mL for the third, 3.5 mL for the fourth, and 2 mL for the fifth measurement. At the end of each CO measurement, the tips were thoroughly washed with 55 mL. The latter extensive wash step was shown to remove remaining analyte to levels, which had no influence on the subsequent CO measurement with the same tip (data not shown).
For measurement of CO, the tips were immersed in analyte-free buffer solution. A slightly higher volume of buffer was aspirated compared with the aspiration of the analyte stock solution. The additional volume of 1 μL, which led to a 2 mm higher liquid level in the tips, ensured that the liquid level of buffer was higher than the liquid level of the analyte stock solution. Potential influences of surface properties of coatings and viscosity of stock solutions should thus be excluded.
In the final set-up, four fixed tips were used in parallel and the series of five CO measurements with the different wash volumes was repeated three times. Accordingly, in one run 60 CO values were obtained. The procedure to provoke CO, including the washing steps, took 30 min.
CO of Fluorescein
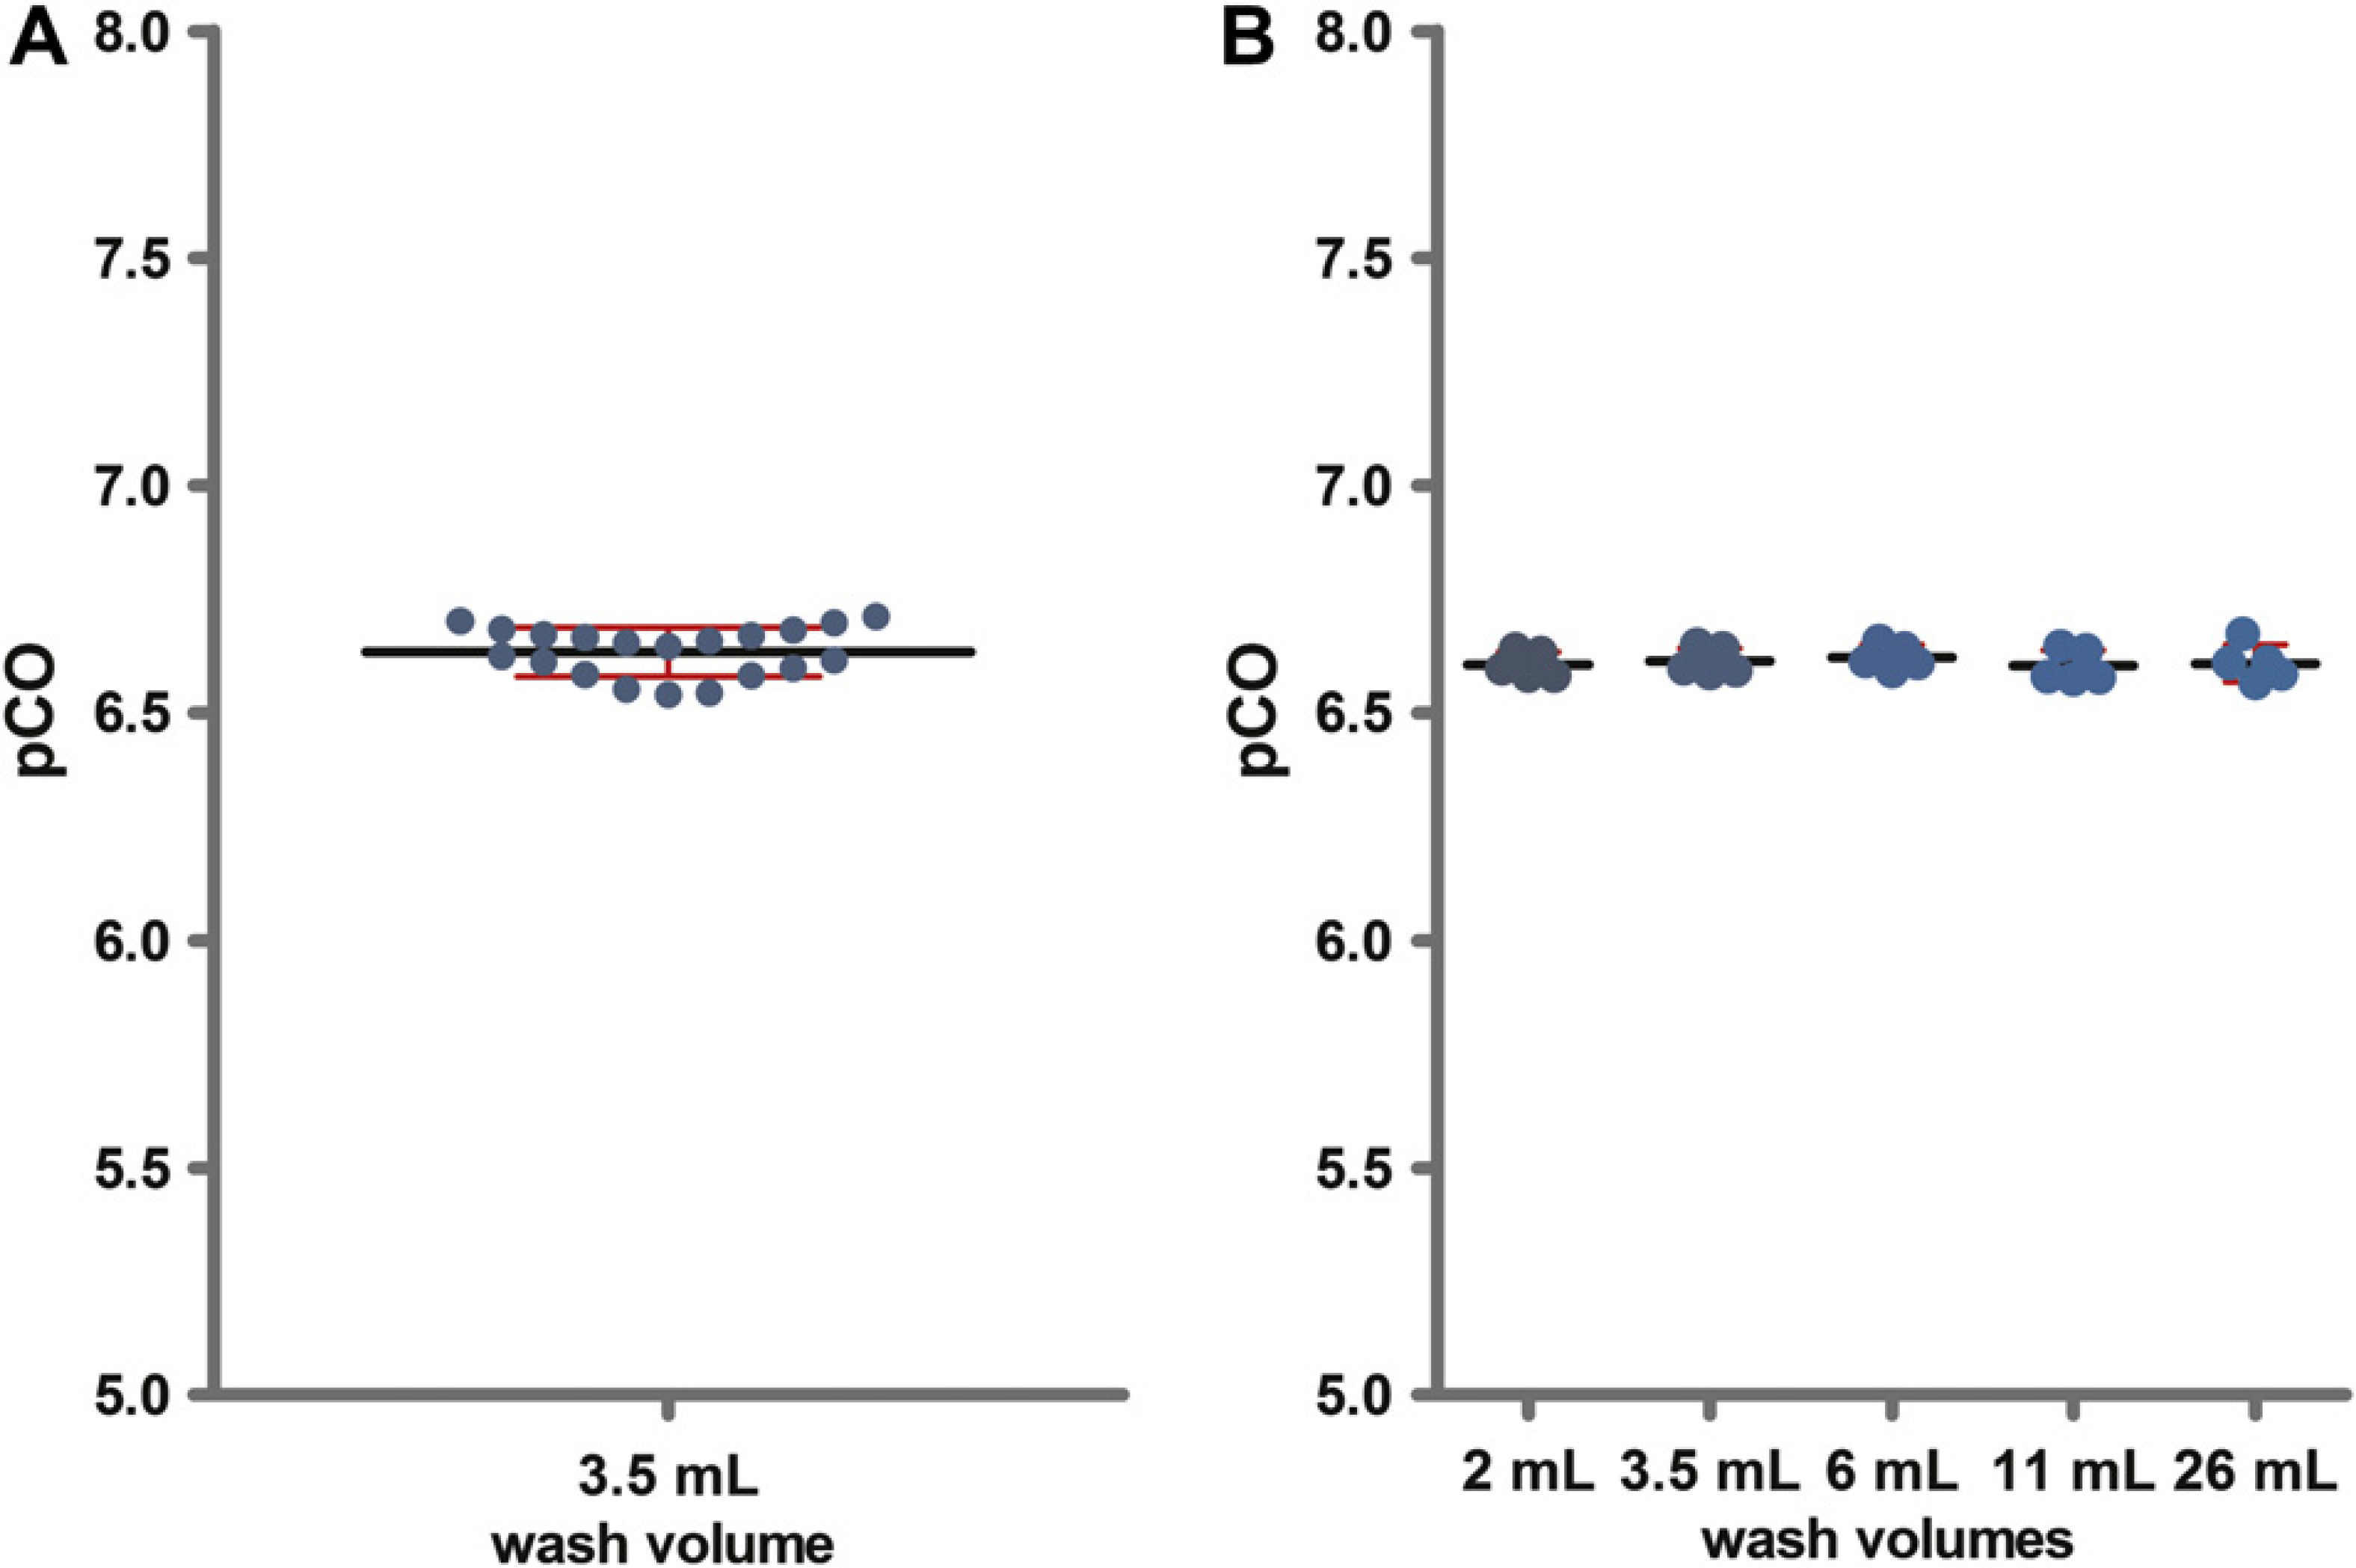
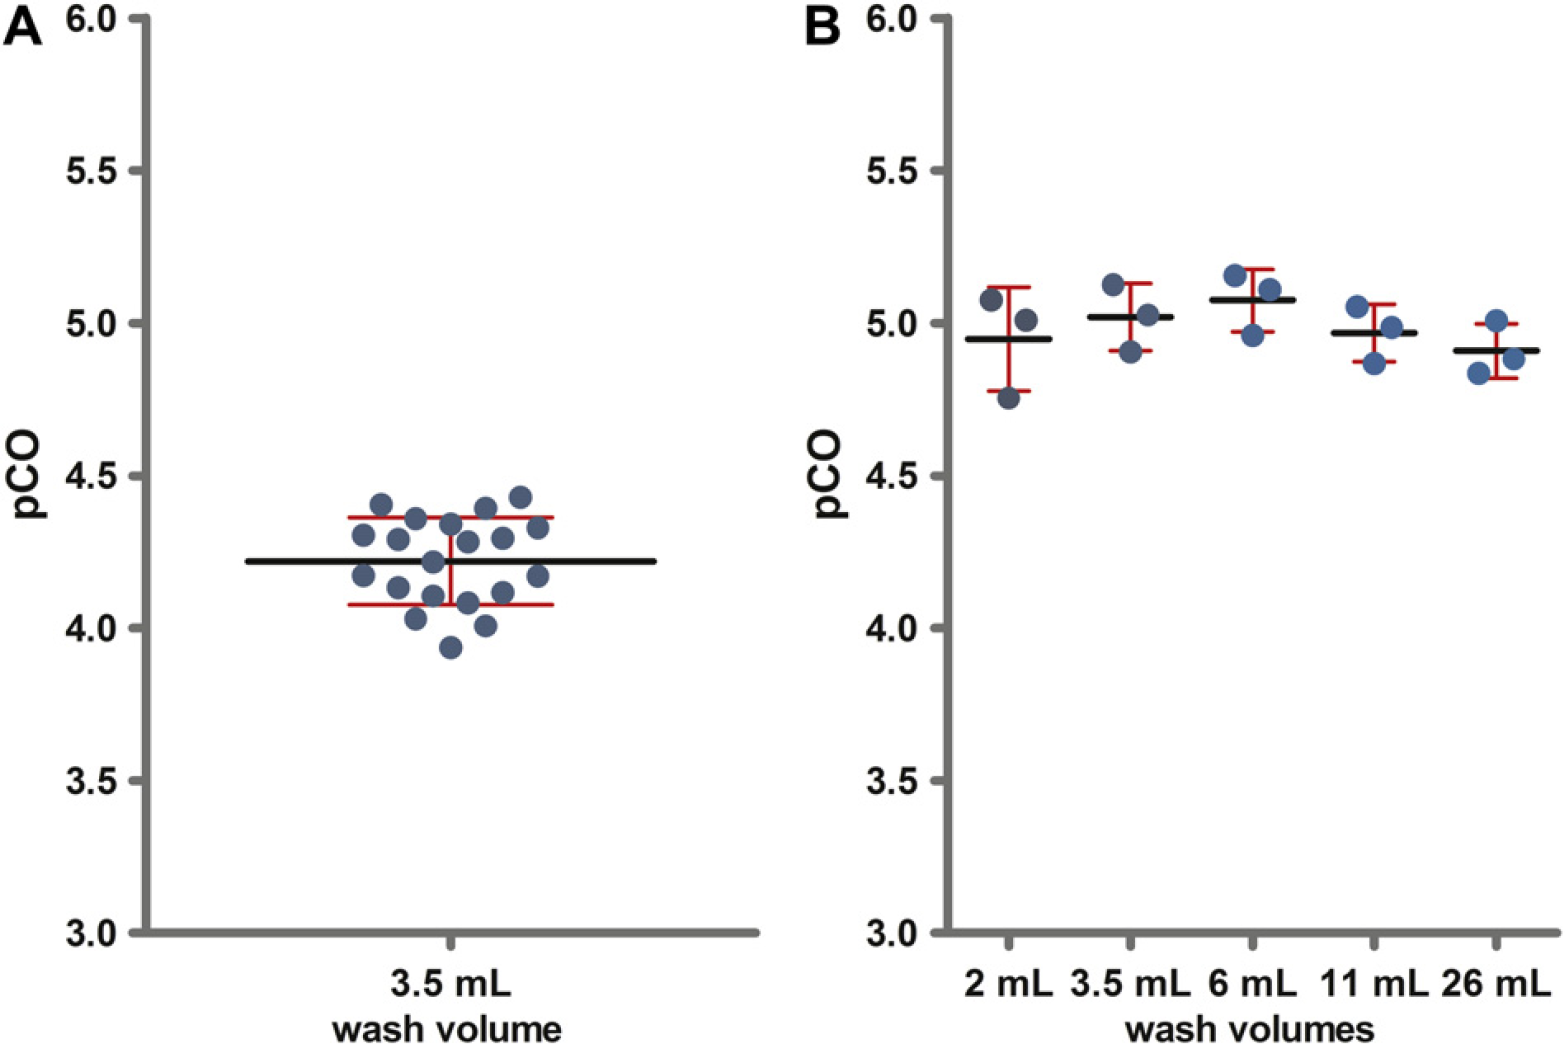
A high fluorescein stock concentration (1 mg/mL) was used to maximize potential CO. After a standard wash procedure (3.5 mL wash volume), a fluorescein concentration of 0.2 ng/mL was detected for fluoropolymer FP1-coated tips, which results in a pCO of 6.63. This corresponds to a CO of 2 × 10⁻⁵%. The intra-assay precision of the CO measurement was calculated from the pCO values of 20 determinations and showed a %CV of 0.82 (Fig. 2A). An inter-assay variation of 0.54% was determined from five independent assays. Inter-assay variation did not differ between wash volumes (Fig. 2B). This demonstrates that the procedure allows precise and reproducible quantification of fluorescein CO.
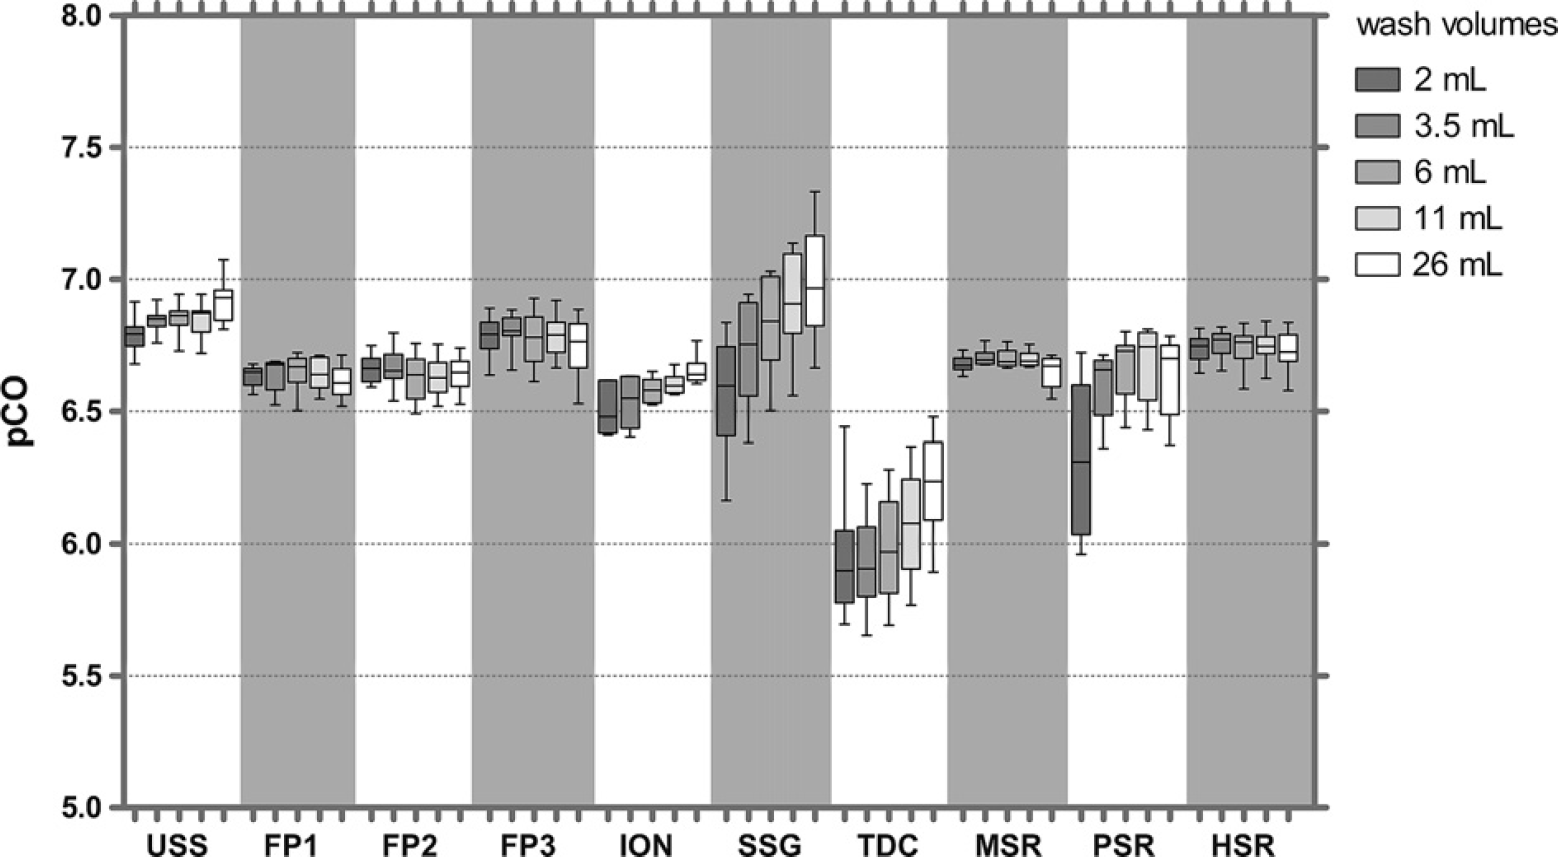
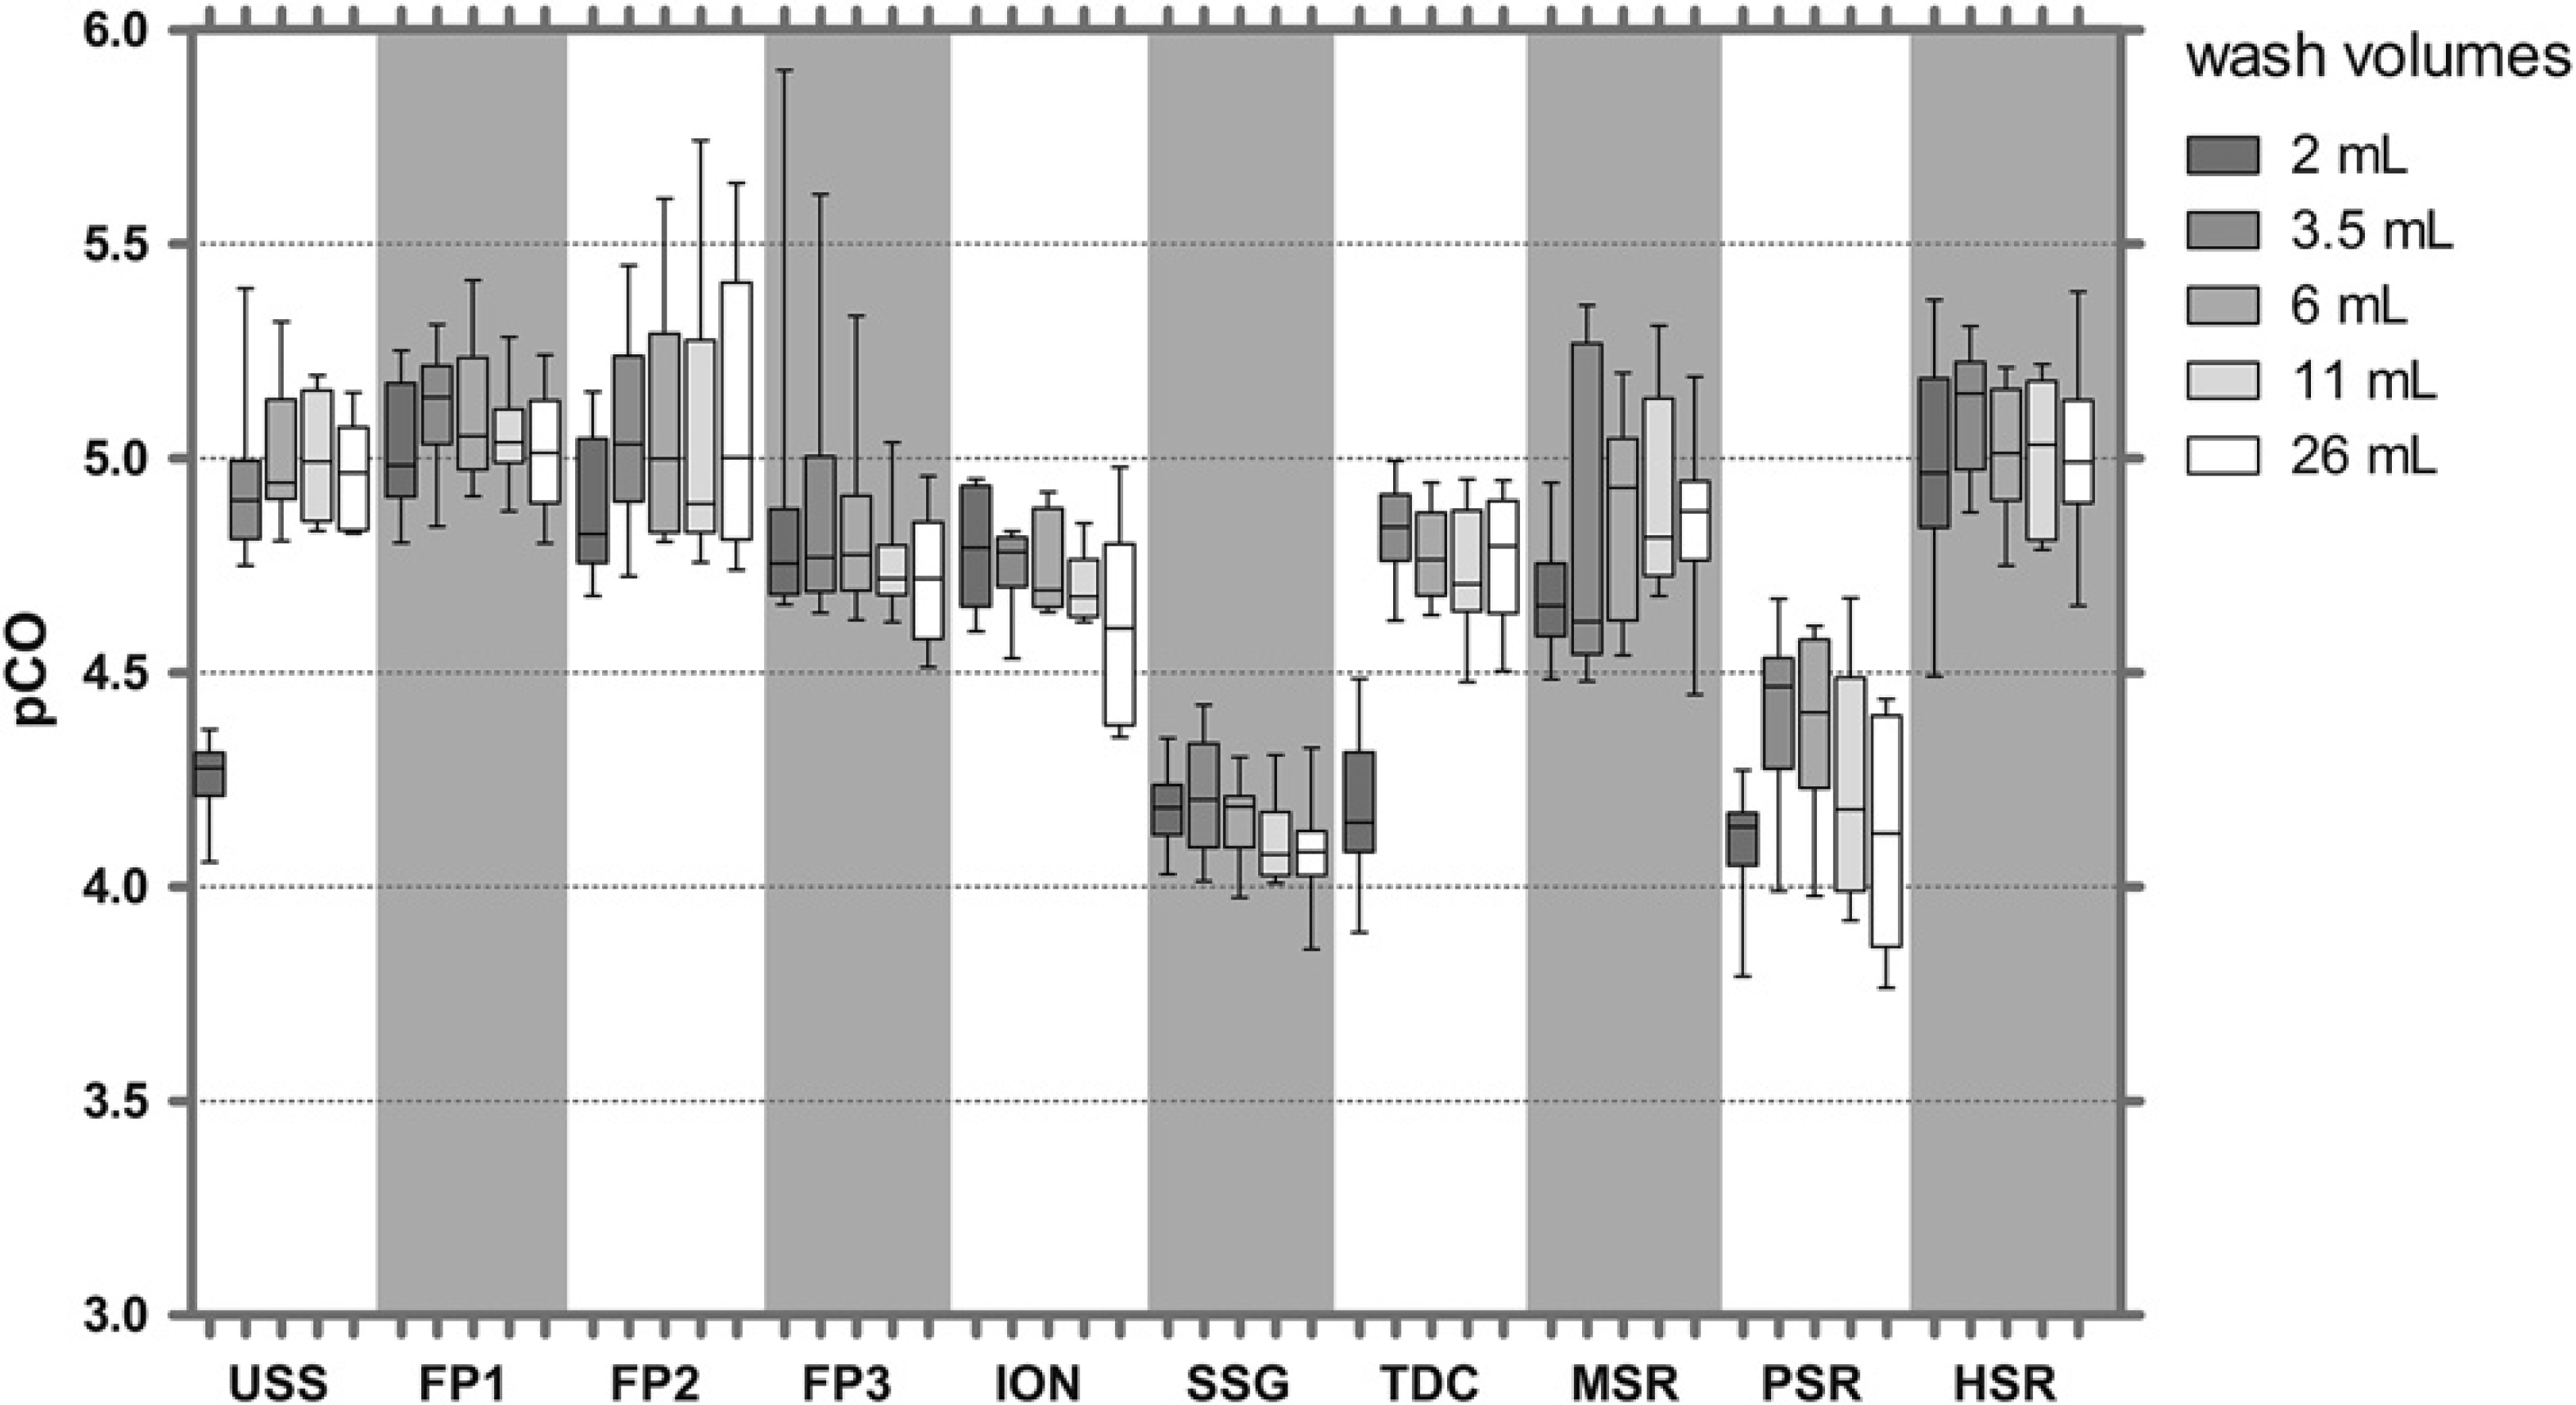
A comparison of fluorescein CO with uncoated stainless steel (USS) tips and nine different coatings revealed similar pCO values of 6.5-7.0 for uncoated tips and tips coated with fluoropolymers (FP1—FP3), ION, SSG, and silicone resins (methyl-modified silicone resin [MSR], propyl-modified silicone resin [PSR], and hexadecyl-modified silicone resin [HSR]). Titanium dioxide-coated (TDC) tips showed 4– to 13-fold higher CO (pCO = 5.9-6.2) (Fig. 3). The CO with some coatings could be improved with higher wash volumes, whereas for others CO was independent of wash volumes. The data also allow a comparison of robustness of the coating procedure; for example, the variation of pCO values between tips was lower for fluoropolymer FP1-coated tips (%CV = 0.71, n = 4) compared with SSG-coated tips (%CV = 1.68, n = 4) and TDC tips (%CV = 1.43, n = 4).
CO of IgG
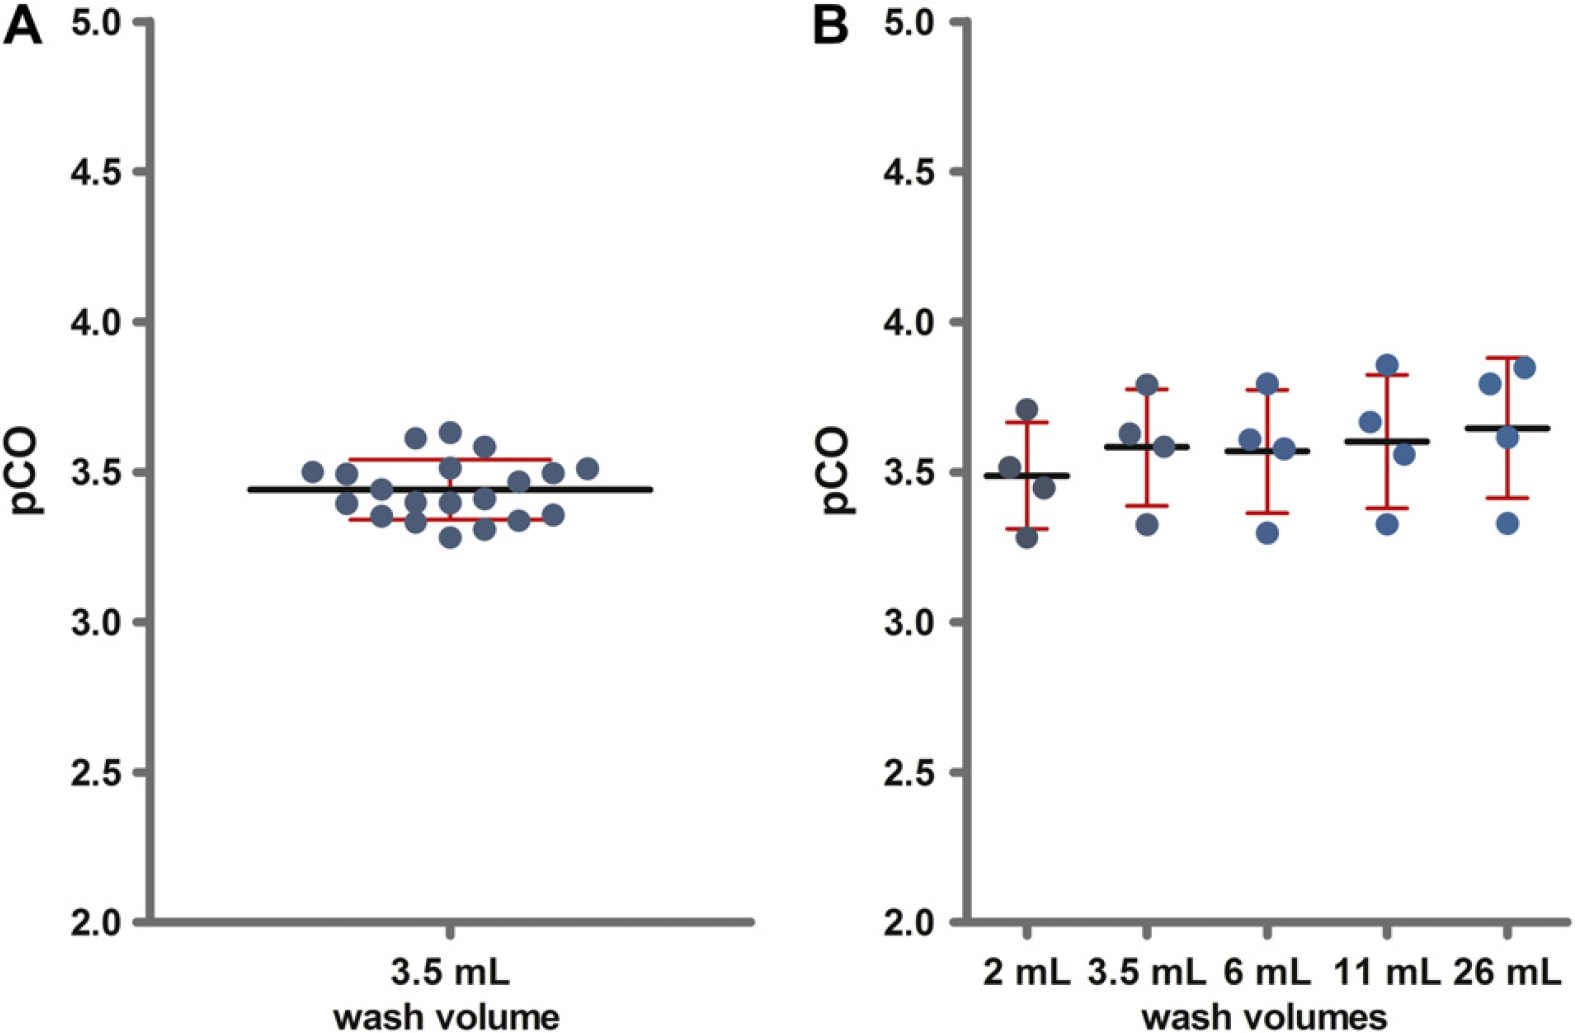
The test procedure was able to provoke a CO of IgG with a pCO value of 3.44 (Fig. 4). This corresponds to an IgG concentration in the recipient sample of 1.6 ng/mL and a CO of 3.6 × 10⁻²%. The intra-assay precision of the CO measurement was calculated from pCO values of 20 determinations and showed a CV of 2.9% (Fig. 4A). An inter-assay variation of 5.8% was determined from four independent assays, and there was no difference in inter-assay variation between wash volumes (Fig. 4B). The difference in CO between tips was small; for example, fluoropolymer FP1-coated tips showed a CV of 0.94% (n = 4). The intra-and inter-assay precision for the IgG CO was larger than that observed for fluorescein. This is most likely caused by the higher variability in the IgG quantification by ELISA compared with the direct fluorescence measurement for fluorescein. The data demonstrate that the procedure also allows precise and reproducible quantification of IgG CO.
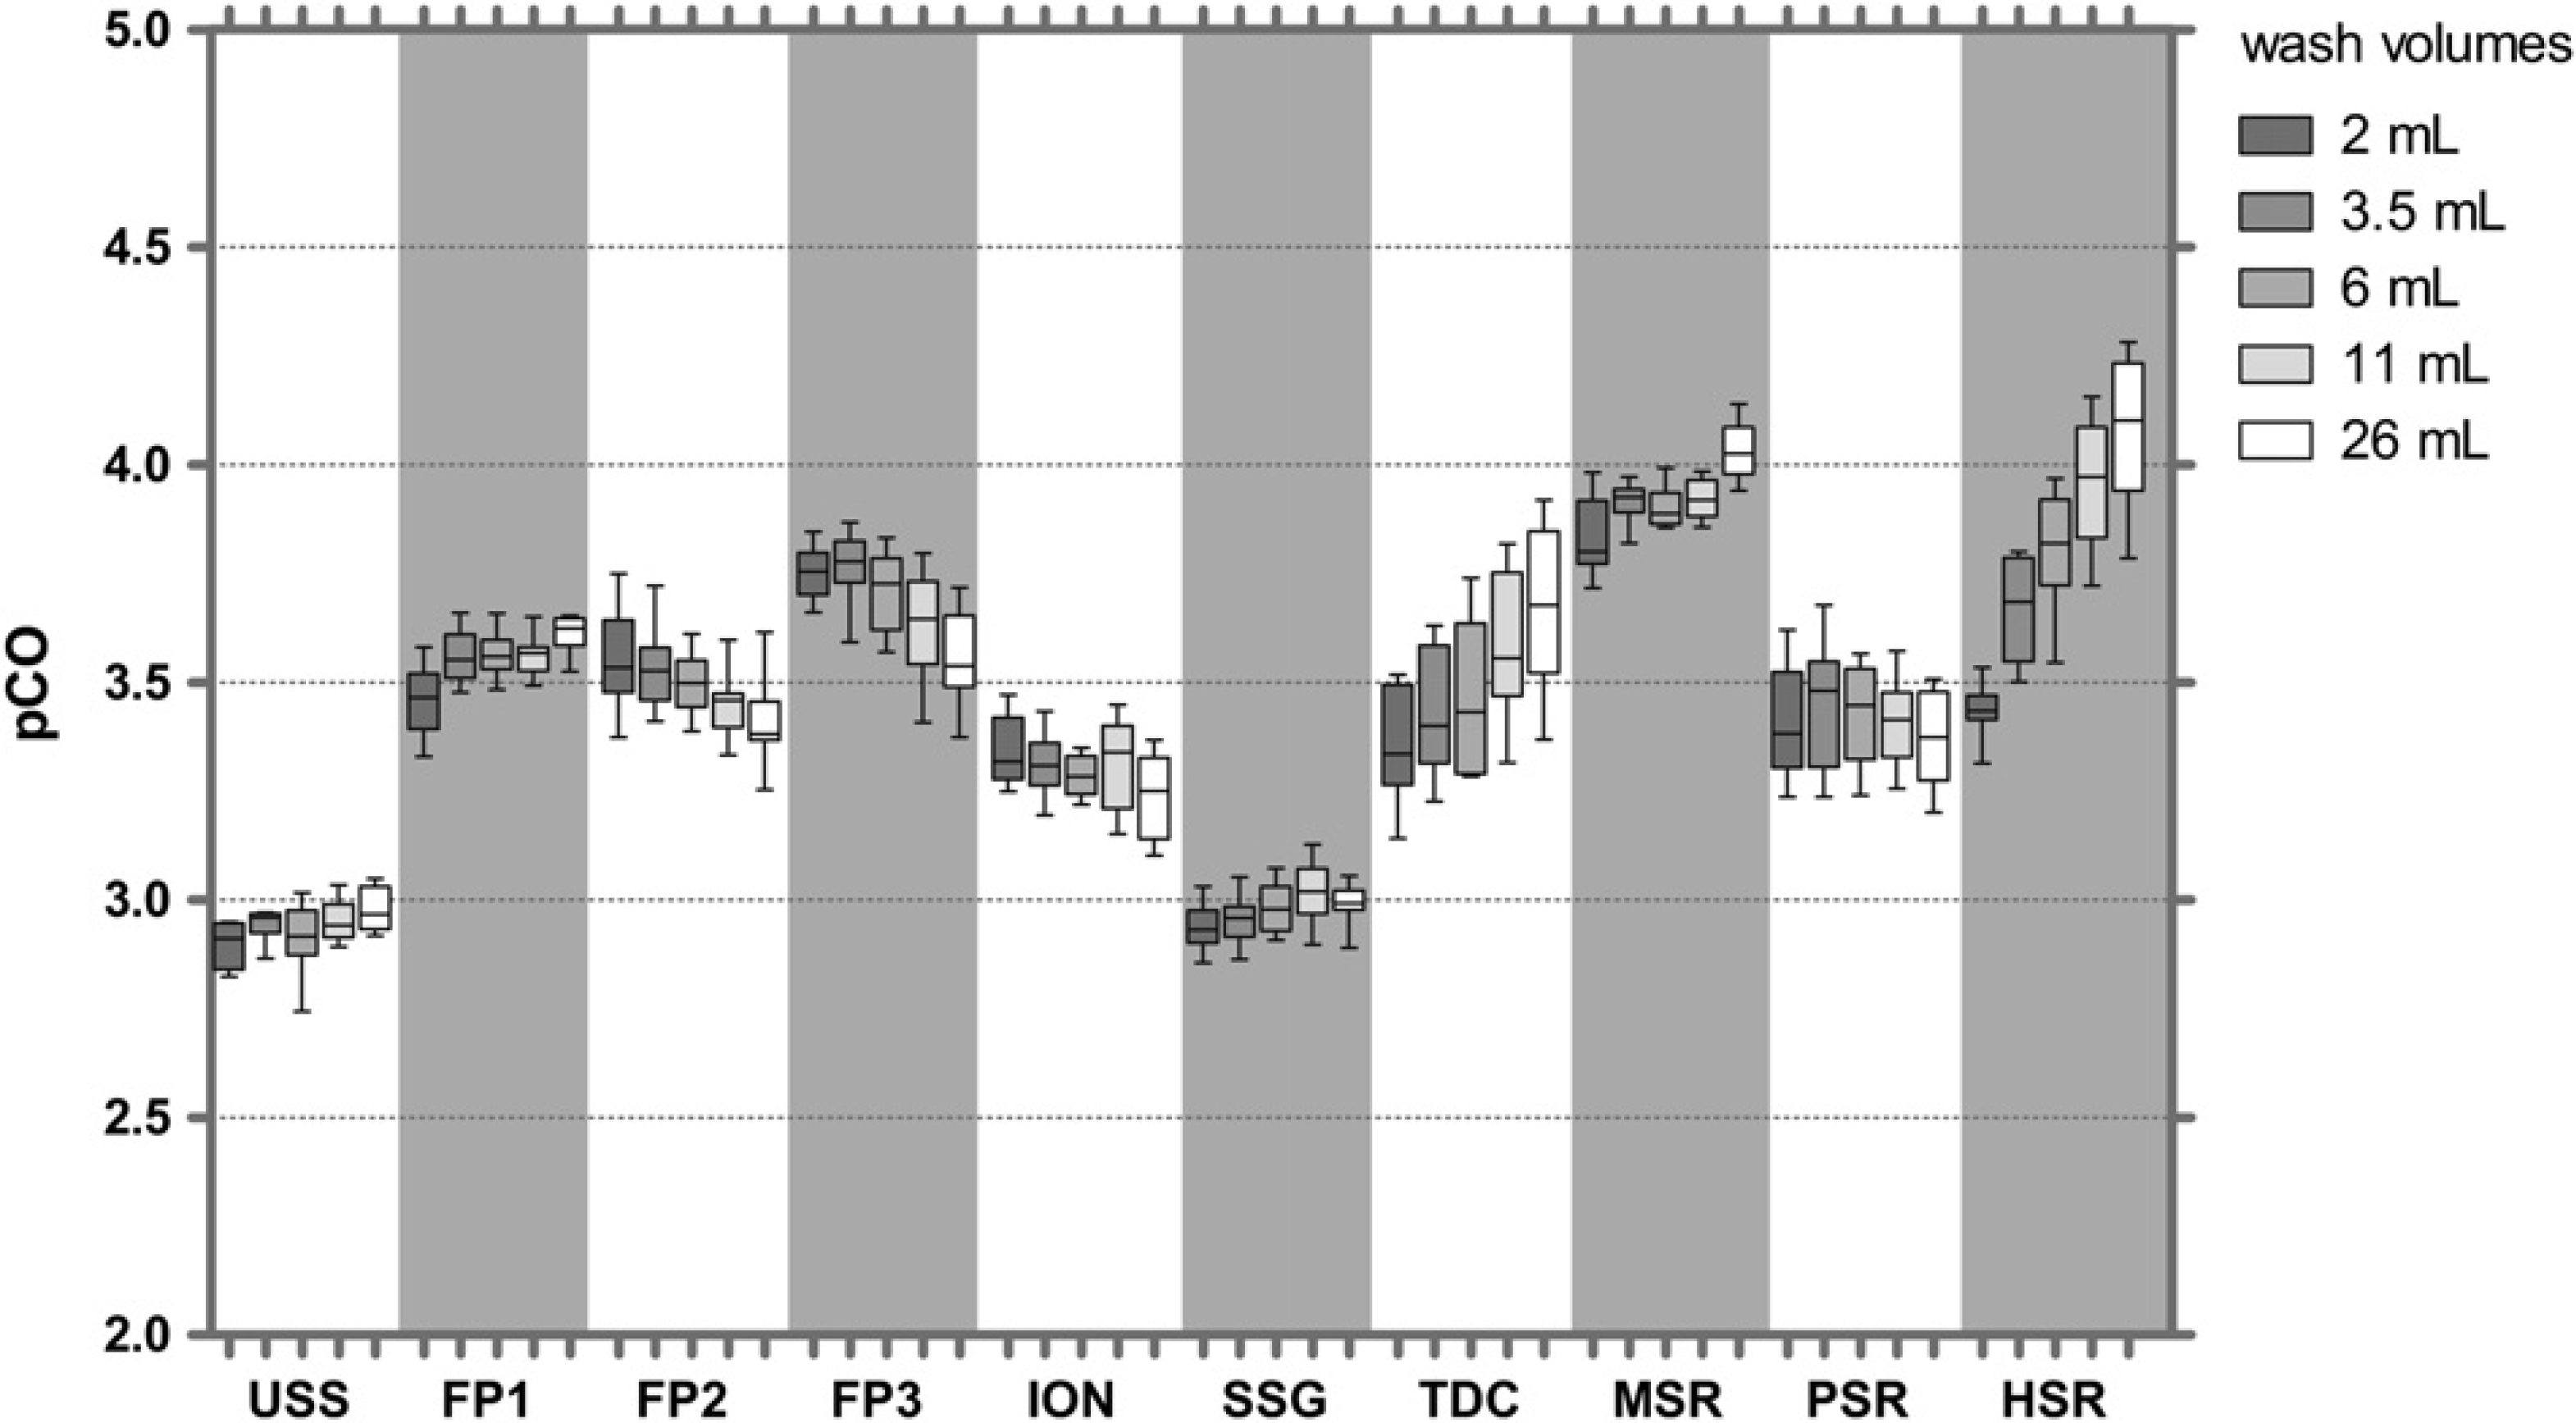
The CO values of tips with different coatings revealed less than 10-fold differences between coatings (Fig. 5). USS tips had the lowest pCO values (about 3), and pCO values of up to four were obtained with MSR and HSR coatings. As seen for fluorescein, some coatings showed improvement of CO with increased wash volumes, others not.
CO of HBsAg
For HBsAg, a pCO value of 4.22 was determined using SSG-coated tips. This corresponds to an HBsAg concentration after CO of 2.0 ng/mL and a CO of 6 × 10⁻³%. The intra-assay precision was 3.4% (n = 20), the inter-assay precision was 5.8% (n= 3) (Fig. 6). Between-tip variation was low; for example, fluoropolymer FP1-coated tips showed a CV of 1.8% (n = 4). The data confirm that the procedure is also suited to quantifying the CO of HBsAg.
As seen for IgG, CO with different coatings differed by less than 10-fold. Similar CO values (pCO of about 5) were observed for USS tips, and all the coatings except SSG and PSR showed pCO values of around 4.2 (Fig. 7).
Discussion
Sample-to-sample CO describes the phenomenon of contamination of a sample from the preceding sample. In general, the CO during pipetting in liquid-handling systems can be caused by liquid remaining on the tip surface after dispensing or by adsorption of analyte on the tip surface. Liquid remaining on the tip surface should be removed efficiently during washing. Therefore, sample-to-sample CO is most likely caused by adsorption of analytes to tip surfaces during aspiration of a sample with a more or less high analyte concentration and desorption of the analyte into a subsequent sample. We therefore developed a procedure in which tips are first exposed to a solution with high analyte levels and CO is measured in a subsequent recipient sample. The use of a blank sample as the recipient sample simplifies the procedure, as each transfer of analyte from a high sample to a blank sample gives one value for the CO, whereas in other procedures measurement of 4, 6 7 6, 2 or even 10 samples 3 is needed to achieve one CO value. Furthermore, the use of a blank sample as the recipient sample instead of a sample with a low analyte concentration broadens the range within which CO can be measured and eliminates the influence of assay precision, which can profoundly complicate CO analysis. In a blank sample as the recipient, the CO is unequivocally detected when the concentration in the recipient sample is above the LLOD. Nonetheless, in cases where it is not possible to obtain analyte-free samples, samples with low analyte concentrations can also be tested with the procedure presented here.
We routinely included five different wash volumes and repeated the measurements three times with four tips. However, several tip coatings did not show a significant influence from the wash volumes. In such cases, the CO measurement procedures can be simplified to the analysis of triplicate measurement of four tips with one wash volume, which should give sufficient statistical power for quantification of CO.
The standardized CO test procedures are characterized by intra-and inter-assay precisions smaller than 4% and 6%, respectively, and thus allow precise quantification of CO. The time needed to provoke CO (triplicate measurement of five washing conditions) was 30 min.
The suitability of the CO procedures was tested by measuring the influence of tip coatings on CO. Fluoropolymers, ION, SSG, titanium dioxide, and different types of silicone resin coatings cover a broad range of surface properties. Surprisingly, only small effects on CO were observed. For fluorescein and HBsAg, uncoated steel tips performed as well as the best coatings while for IgG uncoated steel tips were inferior to most coatings. However, the small differences (less than 10-fold) do not suggest a relevant improvement in CO when these coatings are used. It should be noted that the main issues for the use of coatings are the improved pipetting characteristics (e.g., dispensing behavior for optimized pipetting precision, water drop-off), the protection of the steel against aggressive solutions, the formation of a diffusion barrier against heavy metal ions from the steel, and surface tailoring for special applications (e.g., blood or food analysis).
The CO procedures were adapted to the liquid-handling systems from Hamilton and Sias and resulted in comparable CO values. This shows that the CO procedures can be transferred to liquid-handling systems with different pipetting principles (air displacement, system fluid) and different wash stations.
Conclusions
Test procedures were developed in which the CO of analytes from samples with high analyte concentrations to analyte-free samples is provoked. The procedures were validated with the model substances fluorescein, IgG, and HBsAg and allow reliable and precise quantification of CO. The procedures can be easily adapted to any liquid-handling system platform, to any tip geometry, and to any analyte for which a quantification assay is available.
Furthermore, we are currently investigating the use of the standardized test procedures to optimize washing conditions. Preliminary data show that very short washing steps using a decontamination solution can substantially lower CO (Iten et al., manuscript in preparation). This indicates that fixed reusable tips can potentially be used for a wider variety of assays than in current practice.