
Abstract
A Tecan EVO Workstation and Innovadyne Nanodrop II liquid dispenser have been integrated to provide an automated miniaturized cytochrome P450 inhibition assay, using 1536-well plate technology. The Tecan EVO was used to perform larger volume bulk reagent and compound dilution operations along with plate manipulations using the Tecan Robotic Manipulator. All reagent additions to the 1536-well microplates were performed exclusively by the Nanodrop dispenser, which is capable of accurate and precise pipetting at volumes as low as 100 nL. Miniaturization from 96- to 1536-well plate formats has enabled a fourfold increase in P450 inhibition assay capacity, while reducing reagent costs by approximately 20-fold.
Keywords
Introduction
Miniaturization of in vitro assays used within the pharmaceutical industry can lead to significant efficiency gains, reducing operational costs and decreasing reagent and test compound use. A reduction of personnel resource required to generate a given throughput is an attractive option for streamlining assays used in the pharmaceutical industry. 1,2
In this article, we describe an automated fluorescent end-point cytochrome P450 (P450) inhibition assay for routine in vitro screening of test compounds. This is an important tool for identifying compounds that can cause undesirable drug—drug interactions in the clinic. Described here is an automated process based on 1536-well microplates, to allow screening of up to 50 test compounds against the 5 major human P450 isoforms (1A2, 2C9, 2C19, 2D6, 3A4) responsible for xenobiotic metabolism.
The assay enables scientists to calculate the concentration of test drug that will cause 50% inhibition (IC50) of a specific P450 isoform, where each compound is tested at five concentrations ranging from 0.1 to 10 μM. P450 isoform-specific substrates are metabolized to fluorescent products, allowing facile analysis by in situ microplate-based fluorimetry. Other end-point analysis, such as radiochemical detection and mass spectrometry, 3,4 are encountered with assays of this type using nonfluorogenic substrates; however, these do not have the simplicity and speed of analysis.
Assay Automation
Fully automated fluorogenic inhibition assays are well documented and used within the pharmaceutical industry. 5 7 Existing assays used for screening compounds against five major human P450 enzymes based on 96-well microplates are reported. 8,9 Automated assays of this type often include test compound dilution, incubation plate preparation, reaction cessation (quenching), and automated fluorimetric analysis. Thus, it is for this reason that the fluorimetric end-point assay is often preferred for rapid inhibition screening in early phase drug discovery.
A Tecan EVO 200 Workstation (EVO) (Tecan-UK, Reading, UK) was used previously for an existing 96-well plate format inhibition assay, however, to achieve further assay miniaturization and reduce the cost associated to testing per compound, a multichannel instrument dedicated for low-volume pipetting with minimal dead volume was essential.
As low dead volumes are preferred to ensure minimal loss of expensive reagents, and that the EVO is unable to accurately pipette the volumes encountered with 1536-well microplates (typically up to 12 μL maximum well volume), the preferred option was to combine the larger pipetting volume and plate manipulation capability of the EVO, with the low and accurate volume pipetting features of the Nanodrop II (Innovadyne Technologies Inc., Santa Rosa, CA). The Nanodrop II was chosen because of its small footprint, allowing it to be directly integrated onto the EVO worktable, enabling continued use of the EVO for higher volume pipetting and plate manipulation without the need to purchase any further instrumentation. An alternative approach was to miniaturize the assay from 96- to 384-well plate format, which would have fully used existing equipment, but would not have realized the greater efficiency, cost, and throughput gains achievable with 1536-well formats.
The Nanodrop II uses liquid displacement controlled by a calibrated pressurized system liquid and micro-solenoid dispense valves. This arrangement provides a high degree of accuracy and precision for single aspirate-dispense cycles down to 100 nL. The EVO was used for plate manipulation and larger pipetting activities, including compound dilution and refilling the Nanodrop bulk reagent reservoirs. A Tecan Safire II (Safire) plate reader (Tecan-UK, Reading, UK) was integrated for automated fluorimetric analysis of the assay plates (Fig. 1).
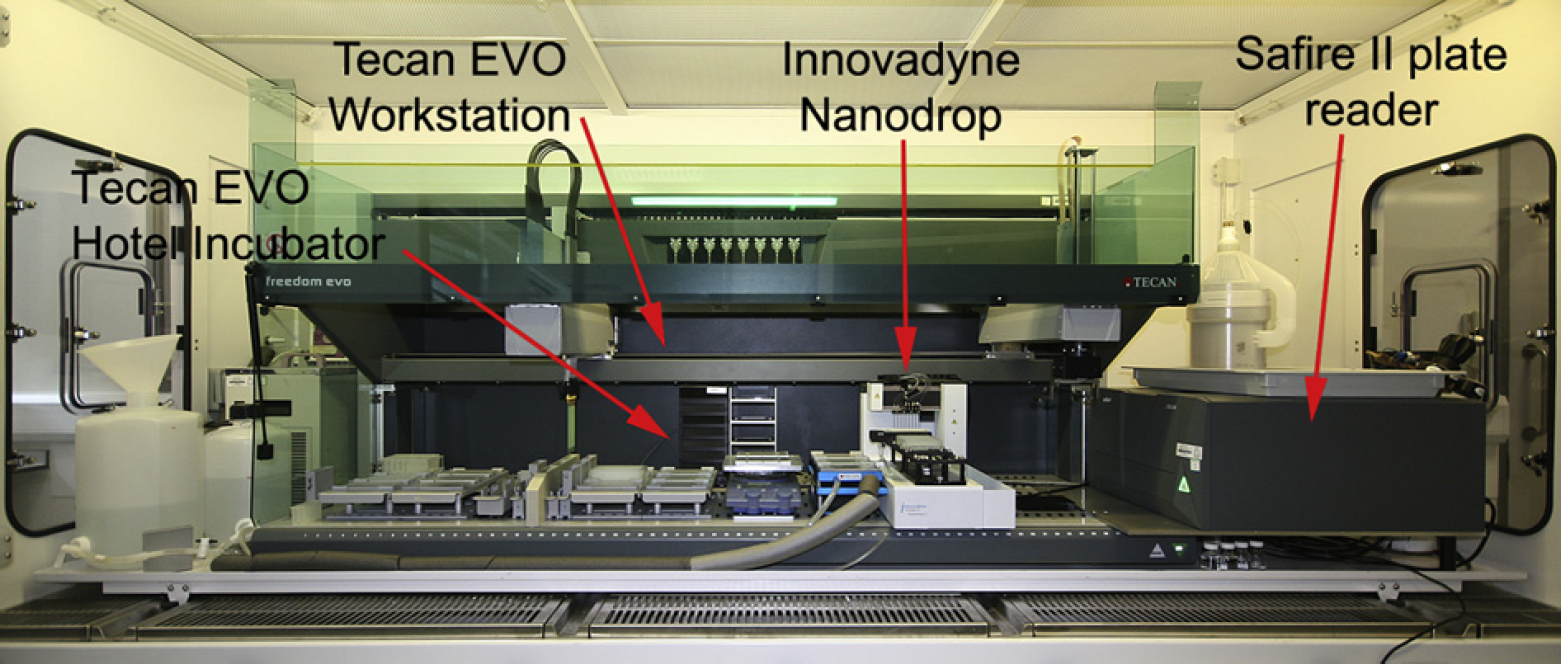
Tecan EVO workstation with integrated Tecan Safire II plate reader and Innovadyne Nanodrop II liquid dispenser.
At the time of assay development, no commercial option was available for direct integration of a Nanodrop II and EVO; however, executable tools in both instrument software packages Nanobuilder 2.4 (Innovadyne Technologies Inc., Santa Rosa, CA) and EVOware 1.4 (Tecan-UK, Reading, UK), provided a platform for computer serial communication port-based instrument connectivity.
Materials and Methods
Materials
Acetonitrile, methanol, propan-2-ol, and dimethylsulfoxide (DMSO) were of analytical grade (Fisher Scientific, Loughborough, UK). Demineralized water was used throughout. The standard P450 inhibitors used were sulfaphenazole, fluvoxamine maleate, ketoconazole, quinidine (free base anhydrous), and miconazole nitrate (Sigma-Aldrich Chemicals, Poole, UK). Inhibitor stock solutions were made up in acetonitrile and test compounds dissolved in DMSO.
The P450 substrates used were 3-cyano-7-ethoxycoumarin, 7-methoxy-4-trifluoromethylcoumarin, 7-methoxy-4-(aminomethyl)coumarin, and 7-benzyloxy-4-(trifluoromethyl)coumarin, and the metabolite standards used were 3-cyano-7-hydroxycoumarin, 7-hydroxy-4-(aminomethyl)coumarin, and 7-hydroxy-4-(trifluoromethyl)coumarin (BD Gentest, Oxford, UK).
The assay uses β-Nicotinamide adenine dinucleotide 2-phosphate reduced tetrasodium salt (Sigma-Aldrich, Poole, UK) as a cofactor to activate the P450 catalytic cycle for each isoform. The reaction quench additive used was Tris-hydroxy-methyl aminomethane (Fisher Scientific, Loughborough, UK).
All human CYP isoforms (1A2, 2C9, 2C19, 2D6, and 3A4) were expressed in yeast (AstraZeneca Biotech laboratory, Södertälje, Sweden).
Methods
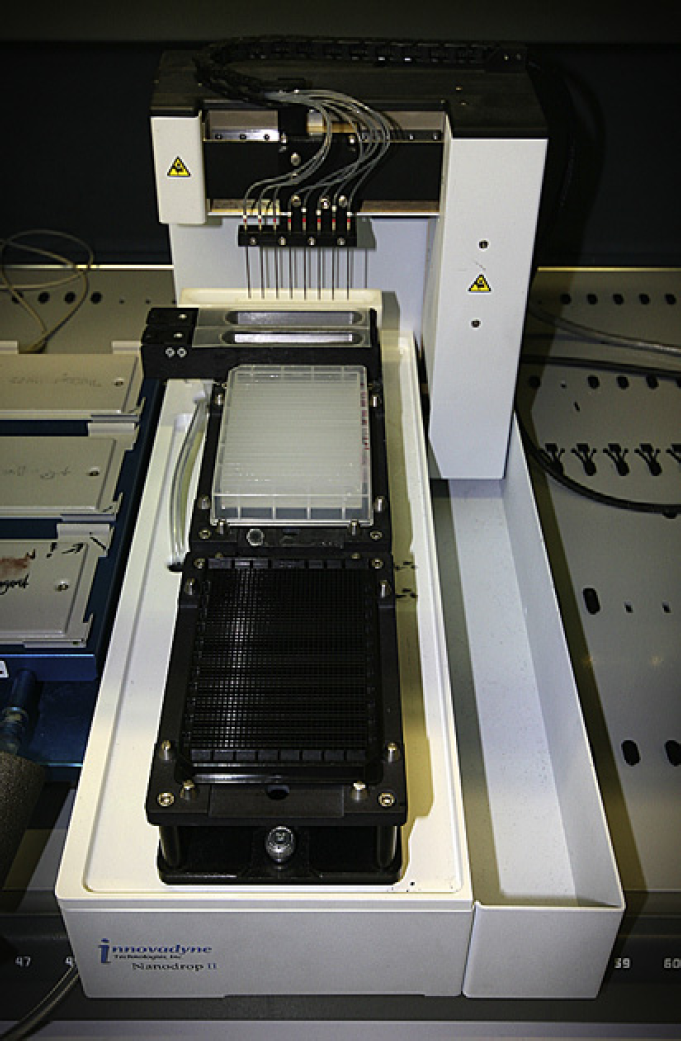
Innovadyne Nanodrop II low-volume liquid dispenser.
Instrument setup is illustrated in Figures 1 and 2. Software tools provided in both instrument packages allowed for connectivity between the instruments. The “Execute Command” in Tecan EVOware software and an instrument communication utility within the Nanobuilder software, were used to create a link between the two instruments. This allowed all Nanodrop operations to be executed from within the EVO assay script.
Automated compound dilutions were made in 384-deep-well v-bottom microplates to give five concentrations of 3, 9, 30, 90, and 300 μM. Assay incubations were performed in Greiner 1536-well microplates on the Nanodrop II. Plate measurements were made at the relevant excitation and emission wavelengths for the enzyme substrate (Table 1).
Assay reagent and analysis conditions
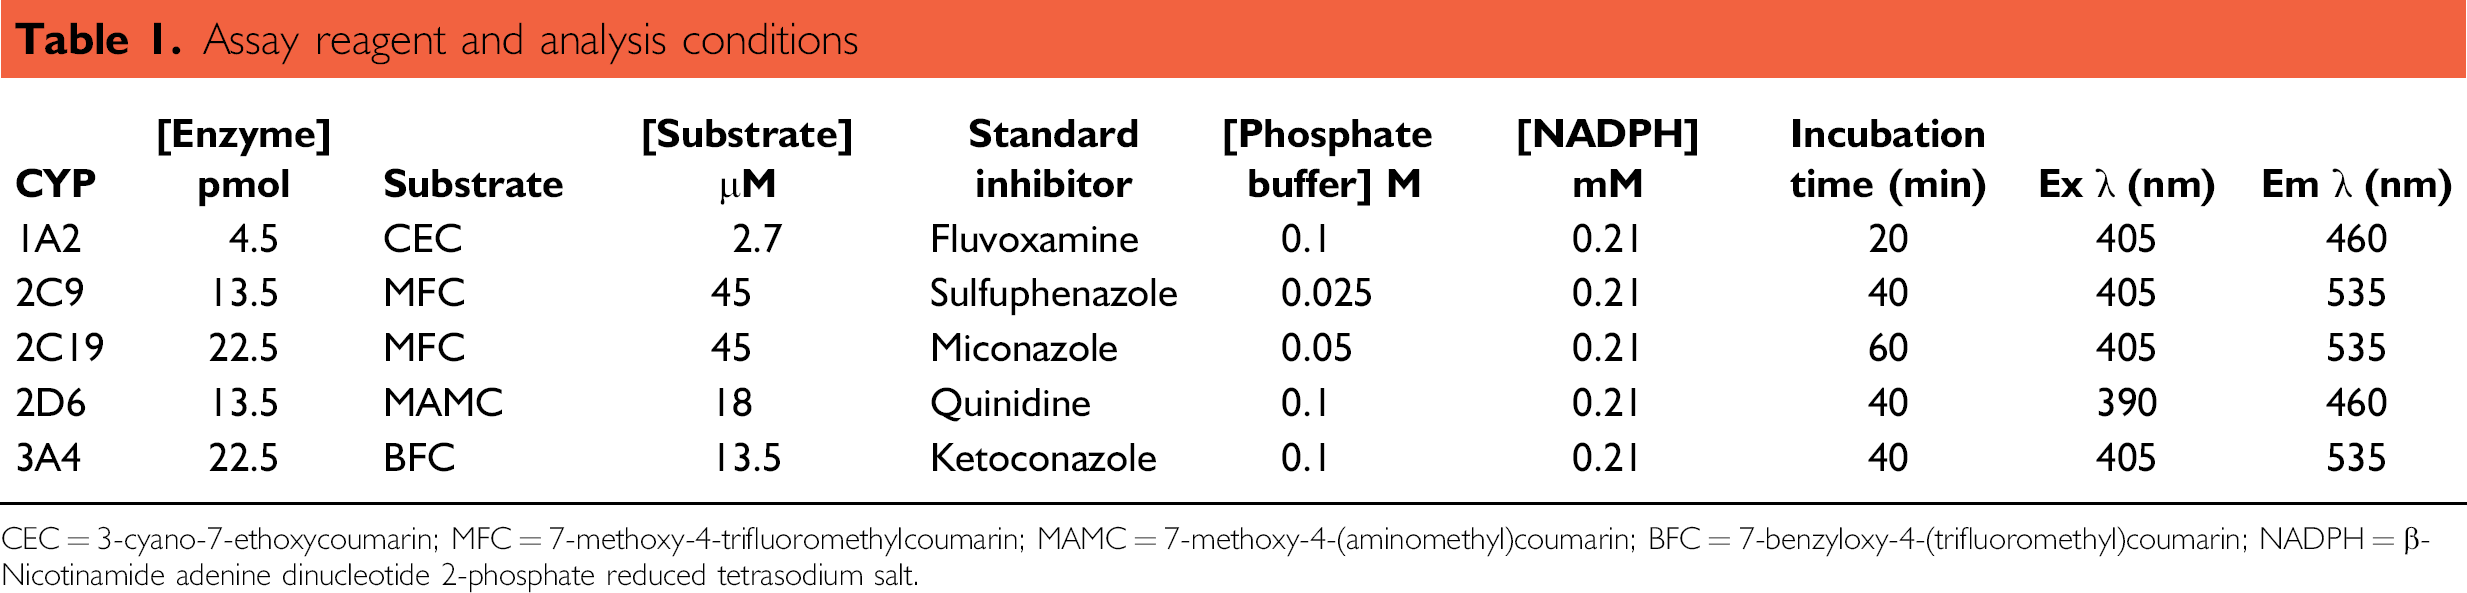
CEC = 3-cyano-7-ethoxycoumarin; MFC = 7-methoxy-4-trifluoromethylcoumarin; MAMC = 7-methoxy-4-(aminomethyl)coumarin; BFC = 7-benzyloxy-4-(trifluoromethyl)coumarin; NADPH = β-Nicotinamide adenine dinucleotide 2-phosphate reduced tetrasodium salt.
Test compounds were dissolved in DMSO (10 mM) and further diluted in acetonitrile to 0.1, 0.3, 1.0, 3.0, and 10 μM. Standard inhibitors were dissolved in DMSO to make working solutions at the following concentrations; fluvoxamine (1 mM), sulfaphenazole (10 mM), miconazole (0.25 mM), quinidine (0.1 mM), and ketoconazole (0.25 mM). These solutions were then further diluted in acetonitrile to the same dilution profiles as for the test compounds. The different concentration profiles of the standard inhibitors take account of the potency of each inhibitor against the relevant enzyme.
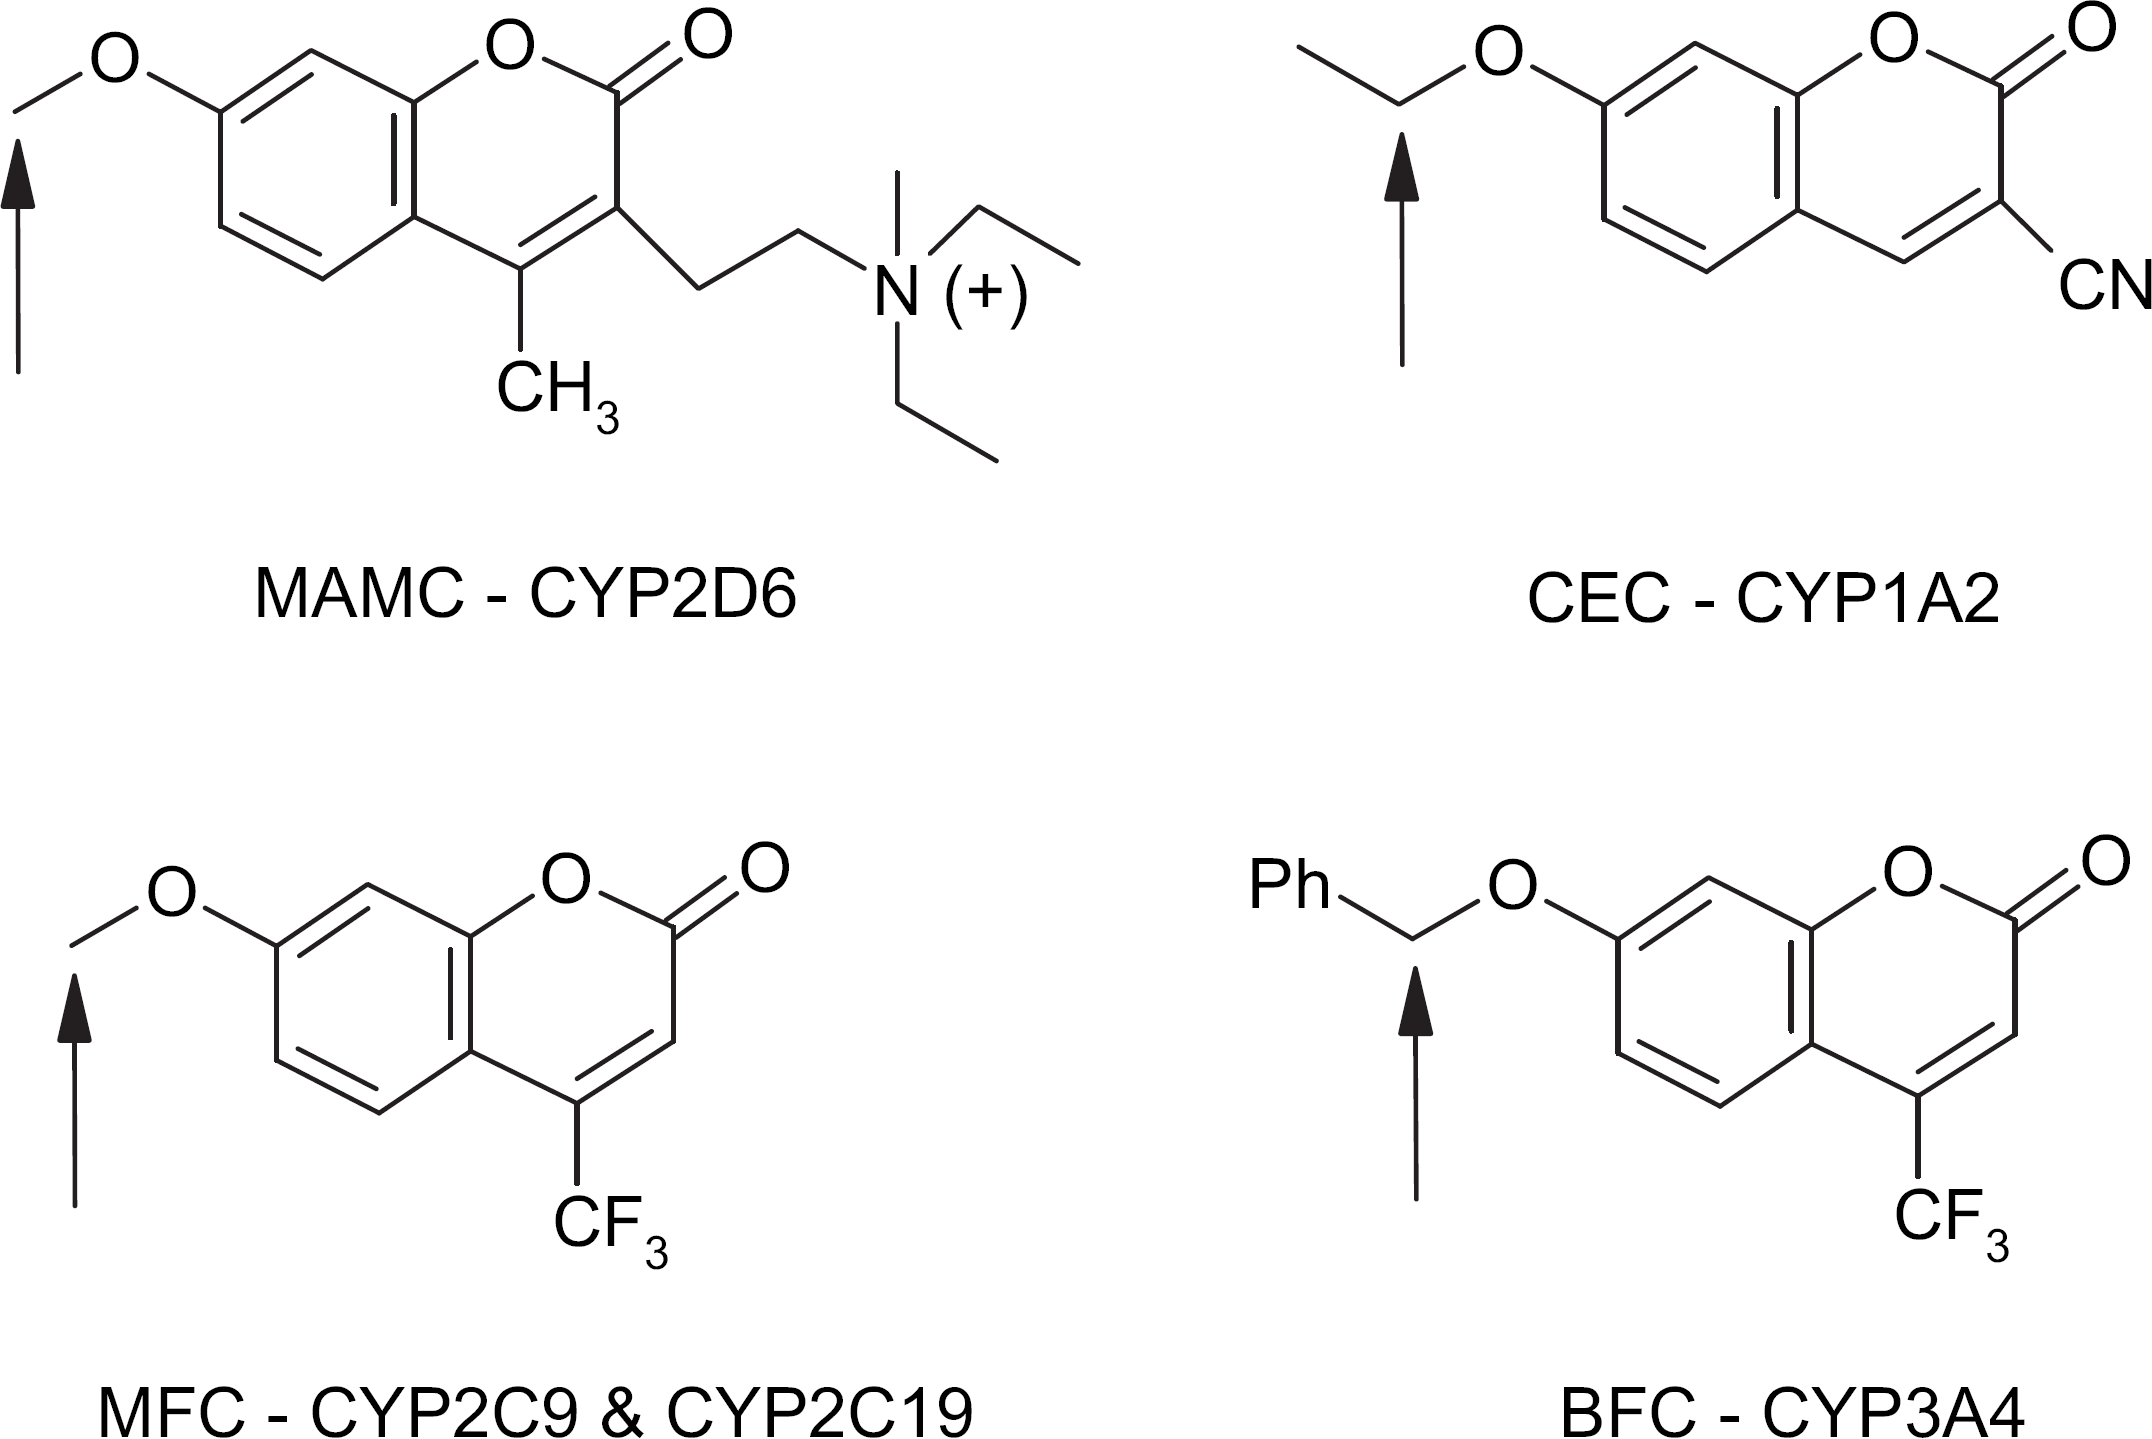
Substrate metabolism; arrows mark the site of oxidation that results in fluorescent metabolite formation.
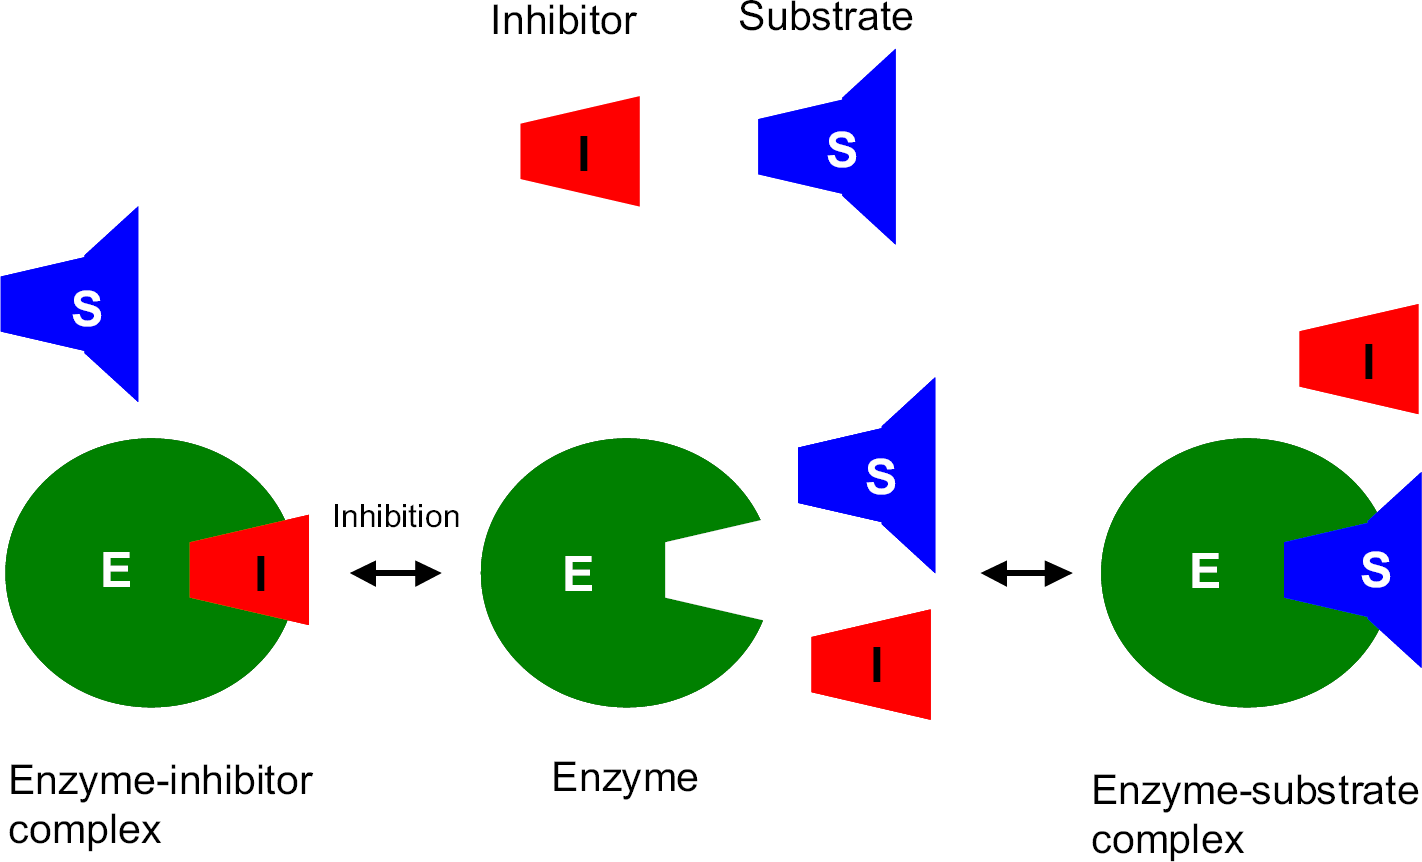
Competitive inhibition. Inhibitor (the compound being tested for inhibition potency) competes with the probe substrate for binding to the enzyme.
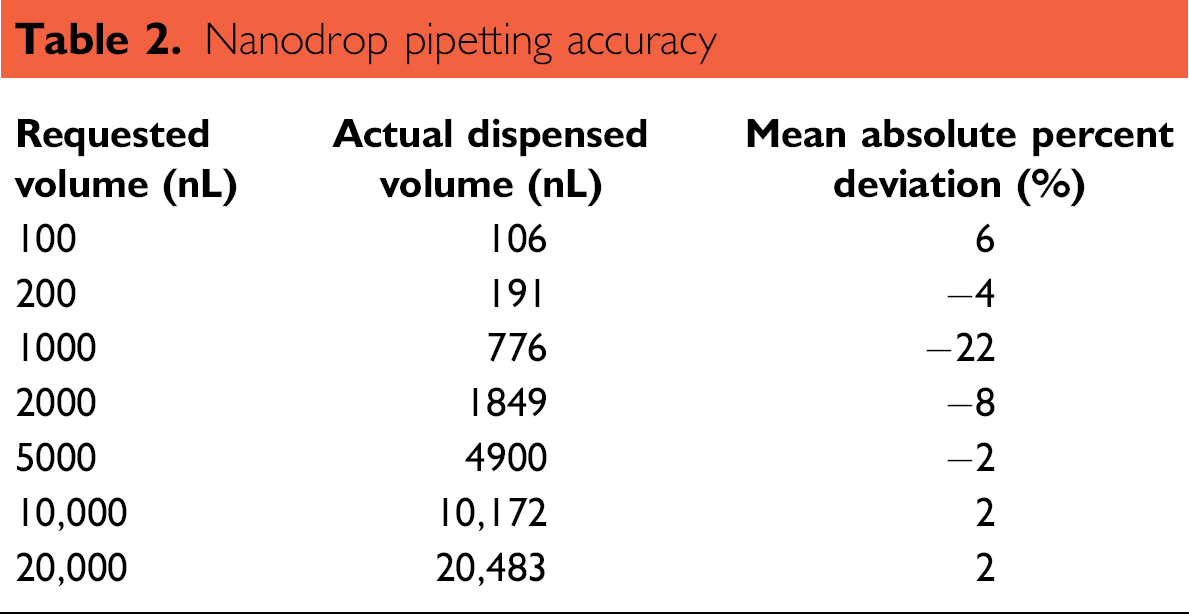
Nanodrop Pipetting Accuracy
The intrinsic liquid-handling performance of the Nanodrop was verified by gravimetric analysis using a single value at each volume. Water was dispensed at a range of volumes from 100 to 20,000 nL to all wells in tared round-bottom 96-well plates, and the average dispensed volume determined, based on the density of water calculated at the time of experimentation. The mean absolute percent deviation (MAPD) of the dispensed liquid was calculated at each volume using eq 1 (Table 2, Fig. 5).

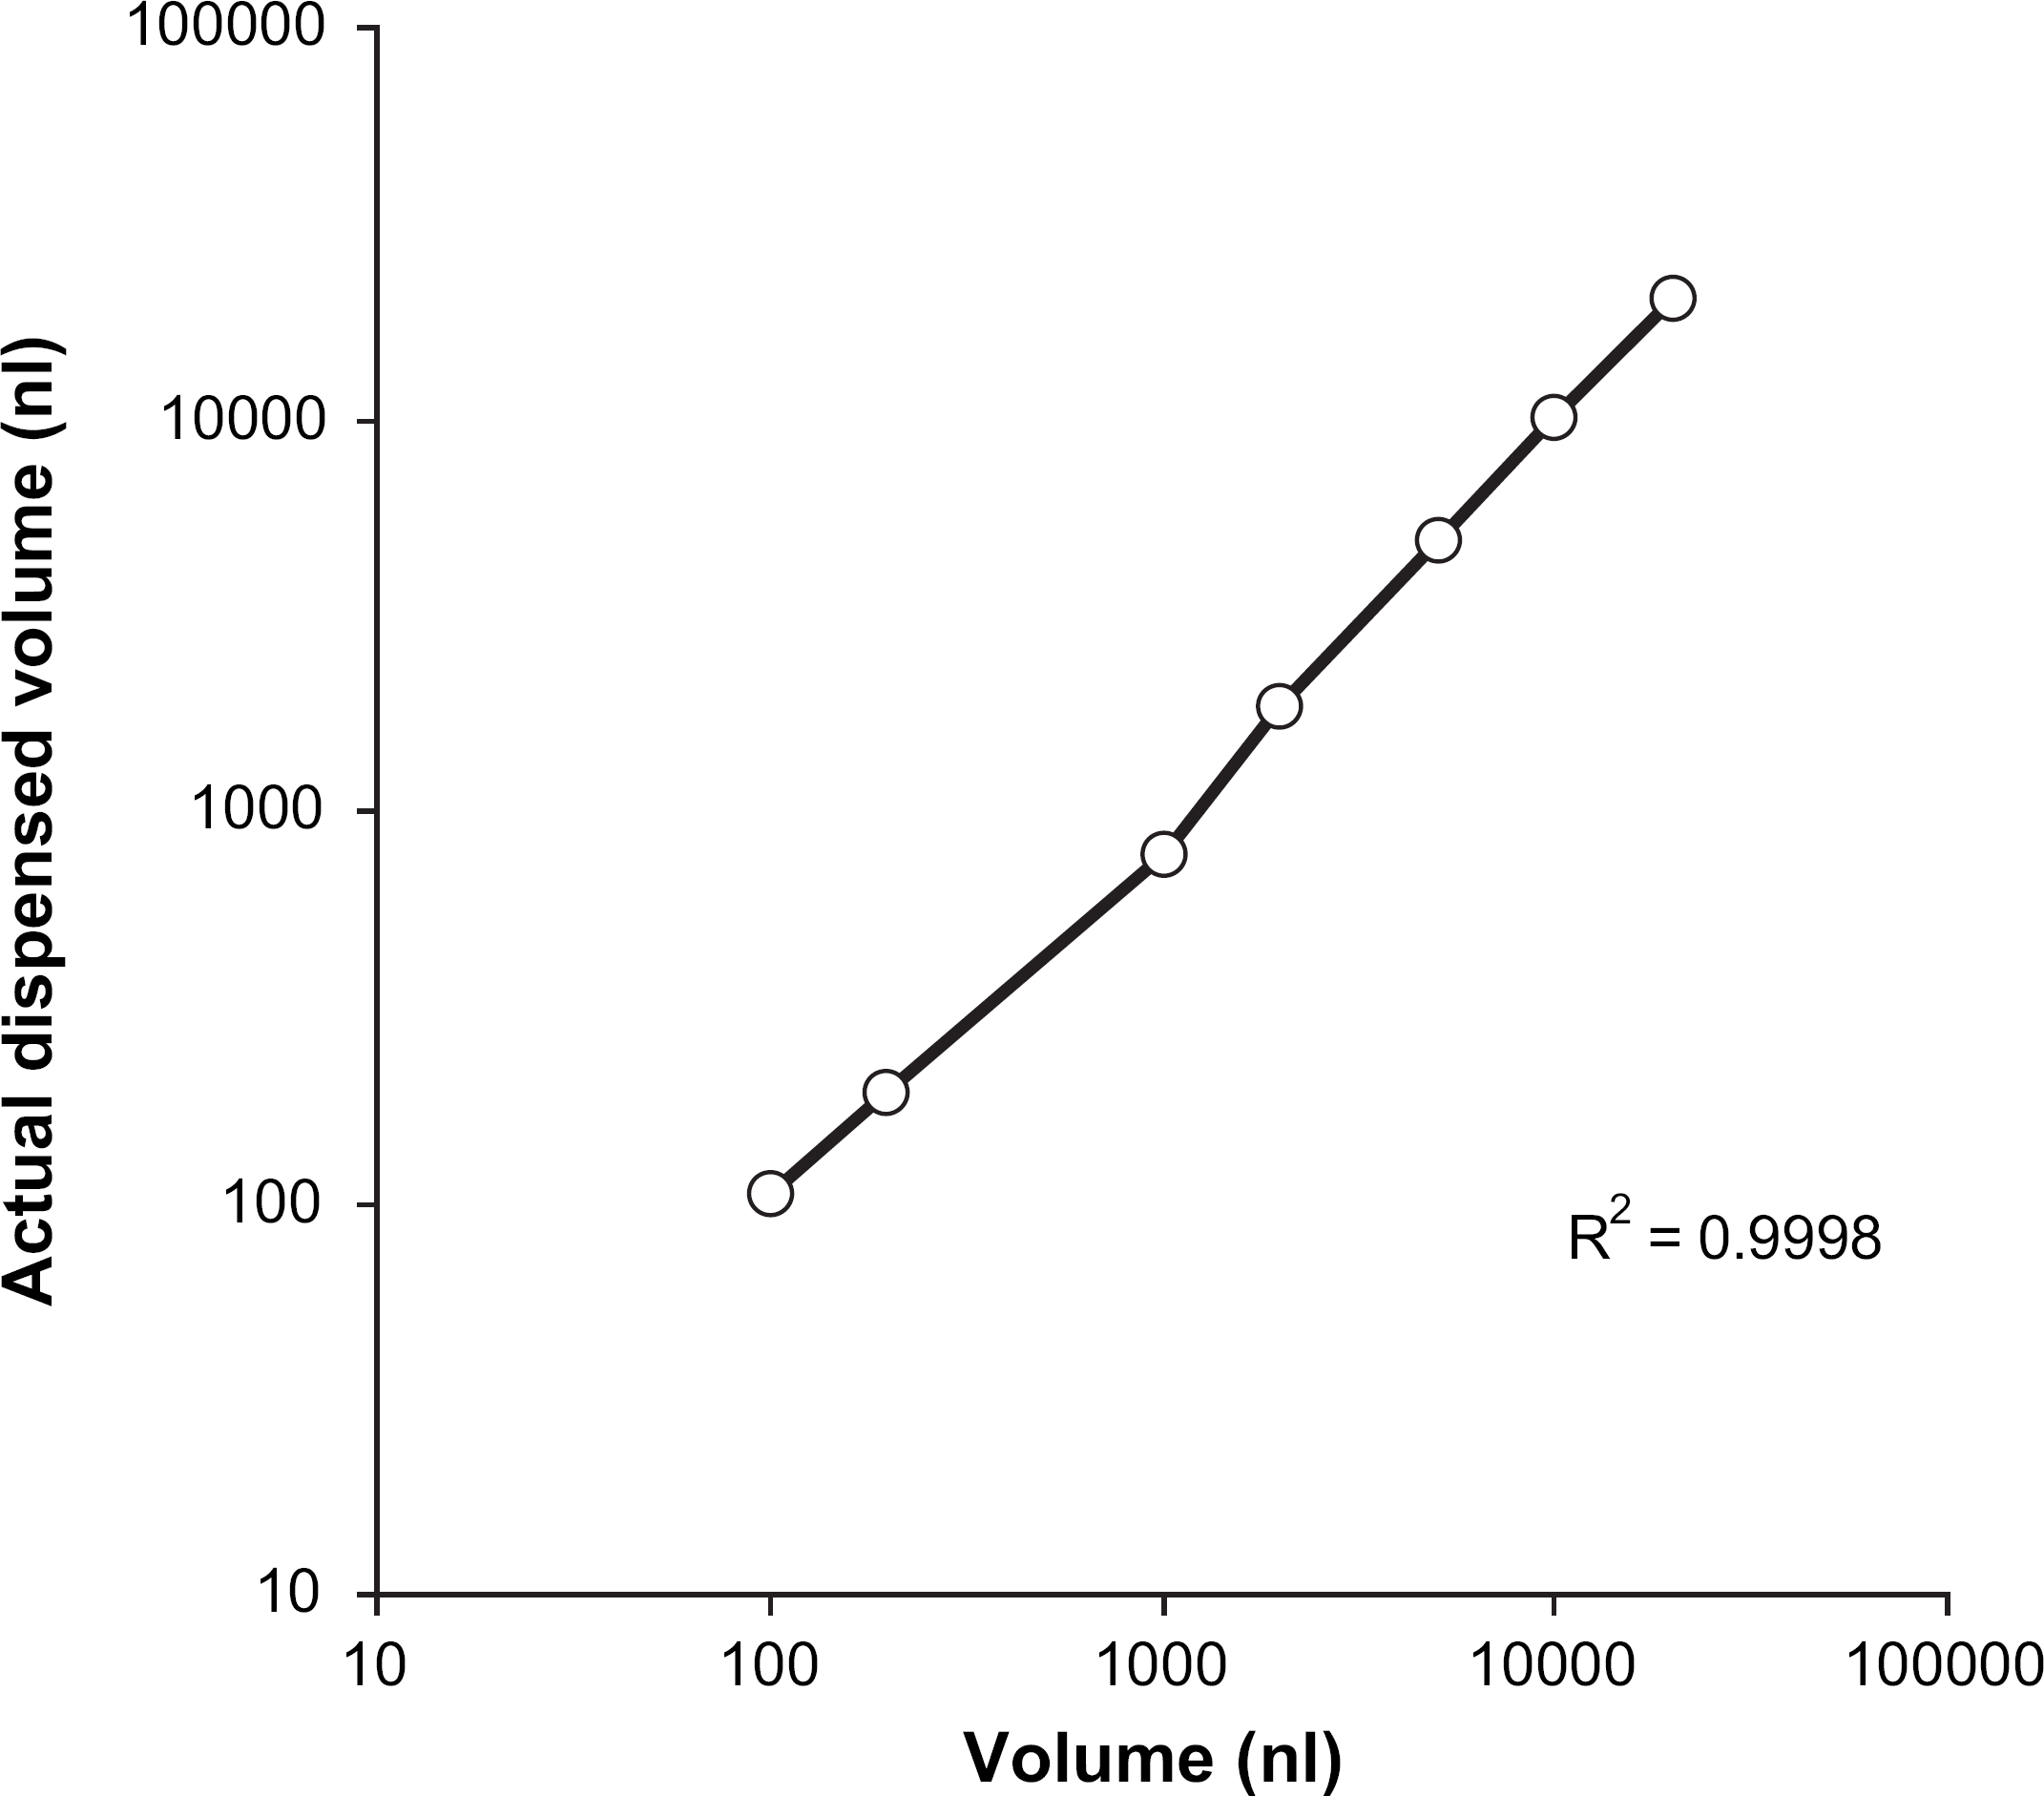
Linearity of Nanodrop dispense volumes.
Nanodrop pipetting accuracy
The water temperature was measured with a rapid response thermocouple thermometer and the density obtained. Mass over density was used to calculate dispensed volumes.
1536-Well Plate Spatial Variability
Intrawell liquid transfer variability was assessed using a tris buffered (pH 8.0) saline solution of fluorescein (3 μM). A volume of 6 μL was dispensed into each well using the Nanodrop II, and the plate analyzed using the Safire plate reader at excitation and emission wavelengths of 483 and 525 nm, respectively. To evaluate variability due to evaporation, the same plate was incubated at 37 °C for 1 h and a repeat fluorimetric analysis completed. This experiment was conducted three times to obtain average values for both the initial and 1-h readings.
The mode was calculated for both data sets. Values lying within ±1%, ±5%, and ±15% were represented by a different color in a plate heat map, with data outside ±15% colored black (Fig. 7). The coefficient of variation (%CV) was then calculated.
1536-Well Plate Evaporation
A comparison of evaporation was made between 96- and 1536-well plates using gravimetric analysis. Each plate type was tared and filled to 90% well capacity (270 μL for the 96-well plate and 10.8 μL for the 1536-well plate). Both plates were simultaneously incubated at 37 °C for 3 h in a Tecan EVO microplate hotel incubator (Fig. 1) without lids. For the first hour, the plates were weighed every 15 min, with subsequent 2- and 3-h measurements (Fig. 6). The final weights were recorded and a percentage loss calculated per well.
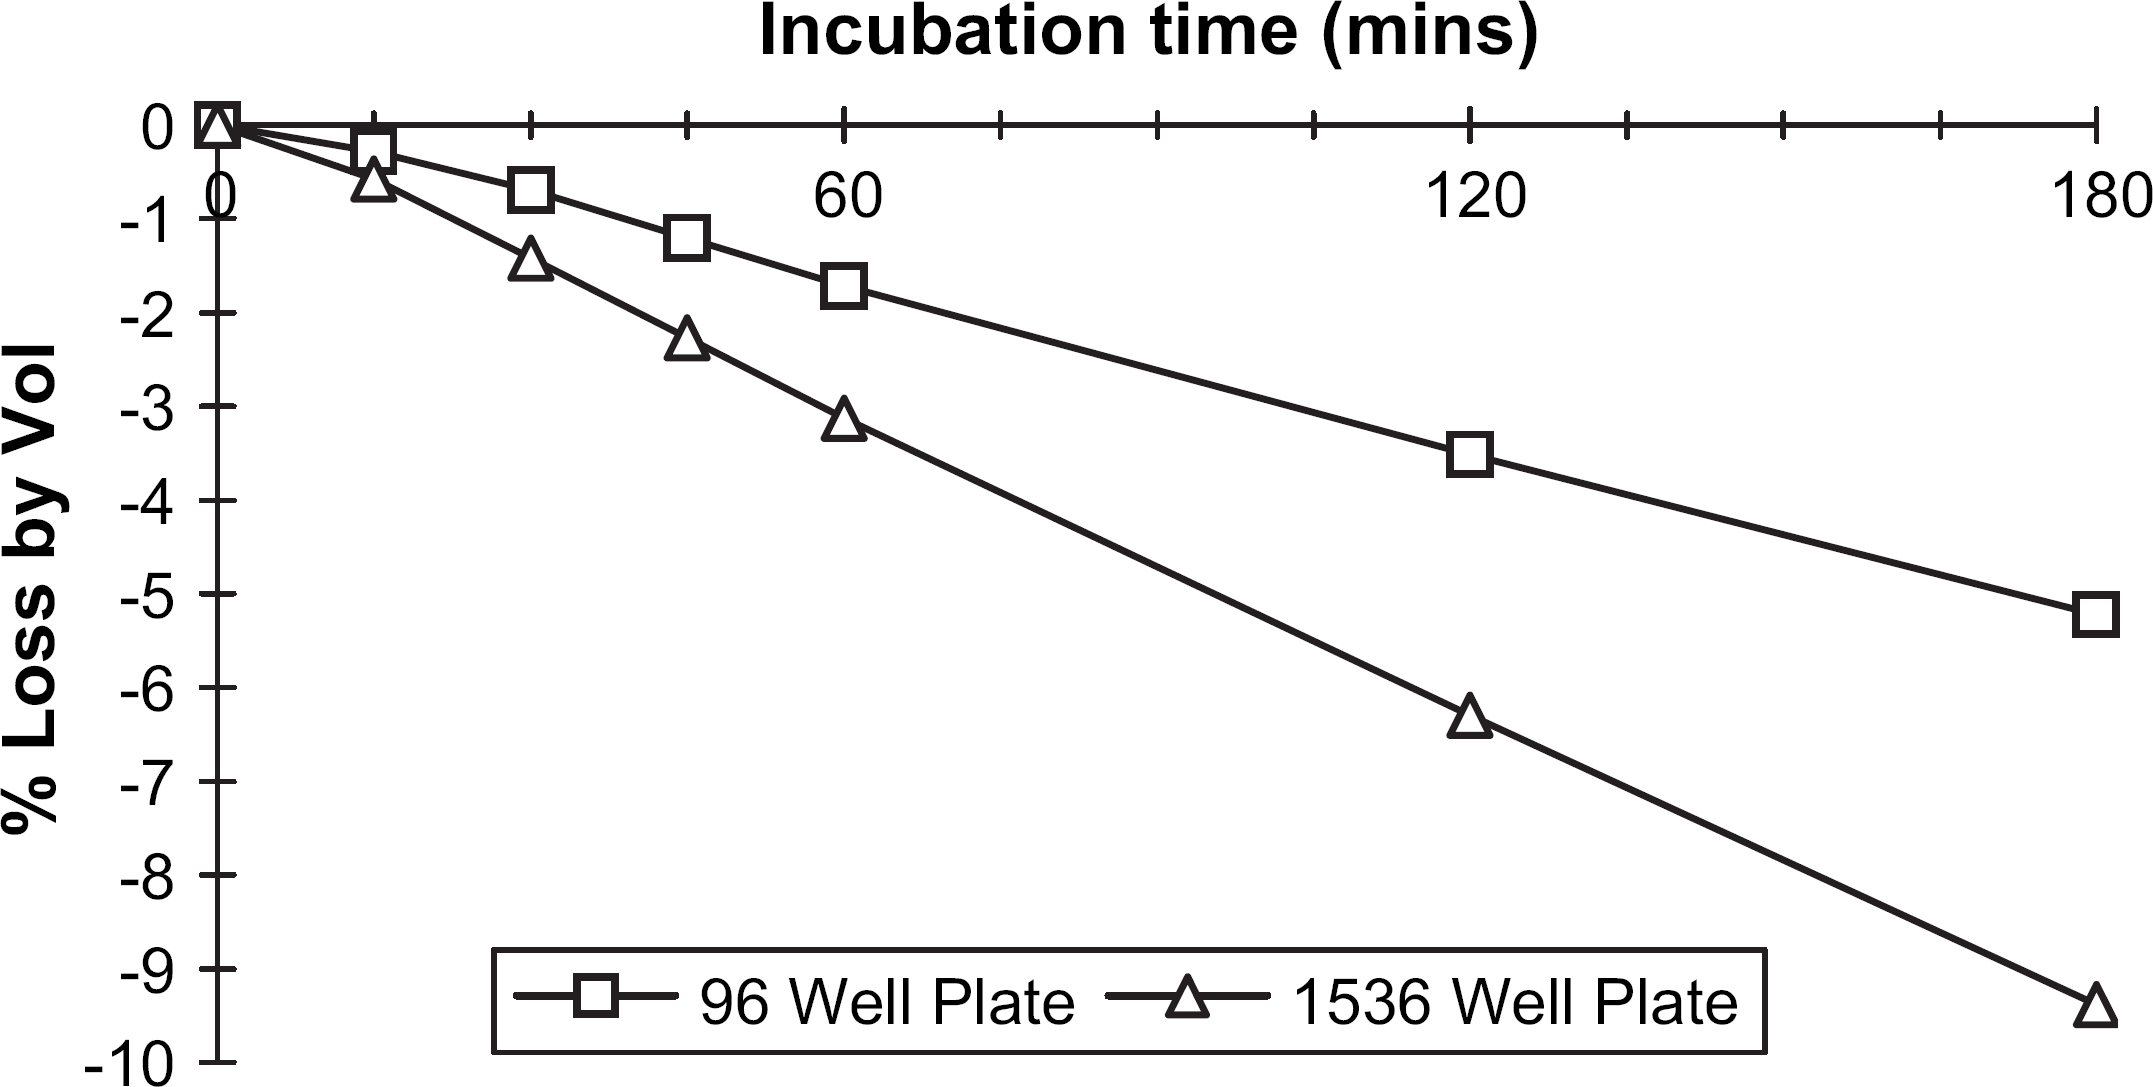
Evaporation from 96- and 1536-well microplates over 3 h at 37 °C.

Time 0 min (A) and time 60 min (B) plate maps; light green indicates values falling between ±1% of plate mode, middle green ±5% of plate mode, and dark green ±15% of plate mode. Values in black lie outside ±15%.
Intra- and Interassay Variability
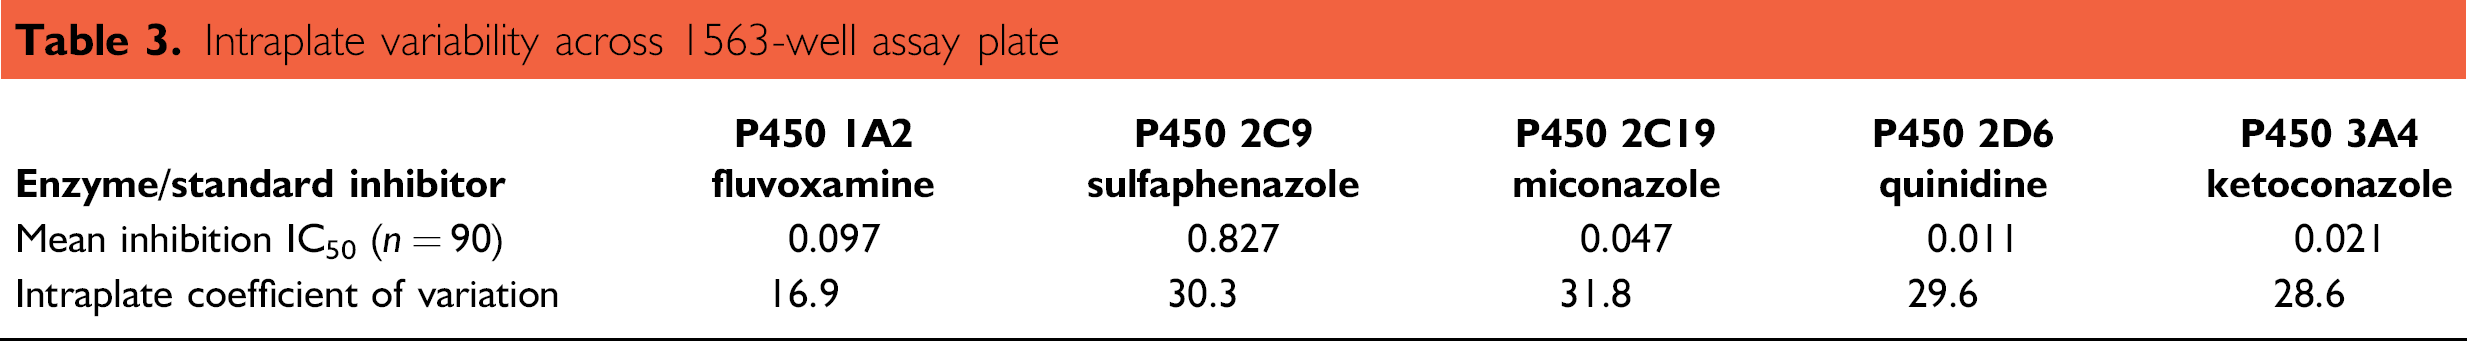
The automated P450 inhibition assay performance was assessed by determining the intravariability and intervariability, based on the calculated IC50 data. Intraplate variability was assessed by incubating each of the five standard inhibitors separately across all assay positions in the 1536-well microplates (Table 3).
Intraplate variability across 1563-well assay plate
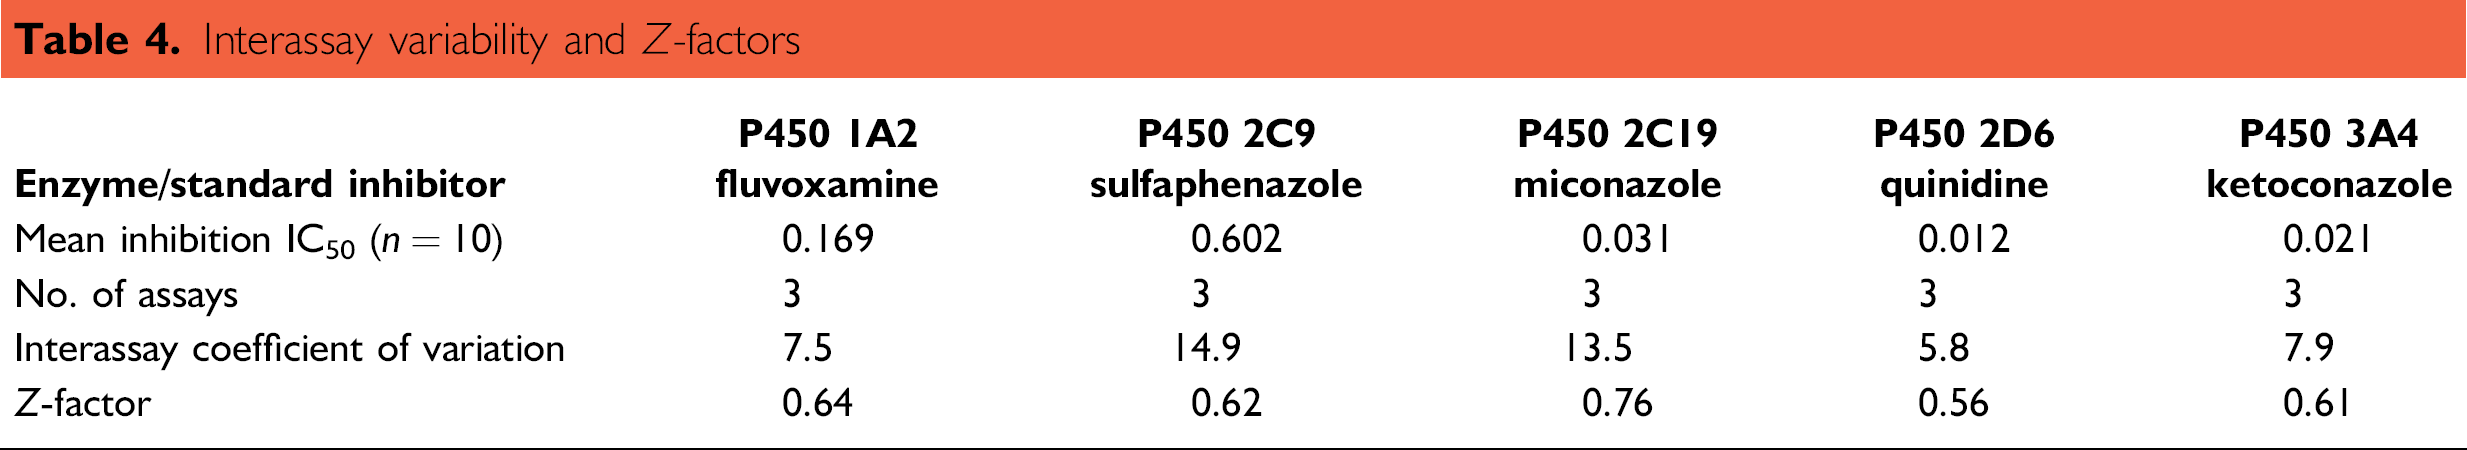
Interassay variability was assessed by performing the assay on three separate occasions (Table 4). The Z-factor 10 for each of the five P450 enzymes was calculated to determine assay robustness.
Interassay variability and Z-factors
Data Analysis
Due to the high volume of data generated by the automated assay, it was necessary to develop a bespoke Microsoft Excel (Microsoft Corporation, Redmond, WA) workbook macro to speed up data processing and reduce data manipulation errors. Raw data is exported in plain text format, and IC50 curves are plotted, with results formatted for upload to an Oracle (Oracle Corporation, Redwood Shores, CA) database in one combined process.
Results
Nanodrop Pipetting Accuracy
All actual dispense volumes were plotted and the MAPD values calculated. The results fell within the range −22% to 6%, which was deemed acceptable for this type of assay. The result obtained for the 1000-nL point (–22%) is assumed to be a random result, which may have been possible to dismiss with additional measurements that were not made at the time of experimentation. Despite the larger error found for this data point, the overall correlation coefficient (r 2) value of 0.9998 suggested suitable linearity of dispense across the range tested.
Evaporation from 1536 versus 96
A faster rate of evaporation was observed for the 1536-well plate (Fig. 6), with a final volumetric loss of less than 10% after 3-h incubation at 37 °C (5% loss from a 96-well microplate). This was deemed acceptable, and had minimal impact on the final assay IC50 results (Table 3).
1536-Well Plate Spatial Variability
The variability associated with the dispensing of liquid to 1536-well plates using the Nanodrop is represented in Figure 7. Values lying outside 1% and 5% of the plate mode are relatively uniform with an apparent random distribution, showing little evidence of significant edge bias. After 1-h incubation at 37 °C, the plate analysis suggests an increase in values lying outside 15% of the plate mode, reflecting that some edge and plate “hot zone” effects exist. Intrawell dispense variability was calculated for the three separate plates initially, with an average %CV of 3.8 (range, 3.4–4.2%). After 1-h incubation without lids at 37 °C, an average %CV of 4.8 (range, 4.3–5.5%) was observed. To test whether these deviations would significantly affect an IC50 calculated from any position in the assay plate, the five standard inhibitors were incubated across all positions for each isoform to determine intra- and interassay variability.
Inhibition Assay IC50 Values and Intra- and Intervariability
Intraplate IC50 variability (%CV) values were calculated for each standard inhibitor, and were found to be no greater than 32% for each isoform studied. This is deemed acceptable for biological screening assays where ranking of data is largely dependant on fold changes in the IC50 values (Table 3). The level of variability suggests that all available assay plate positions are comparable. The IC50 %CV figures observed are a composite of the liquid-handling precision and any error introduced from plate edge effects (temperature and evaporation deviations), as well as biological system variability.
The interassay %CV values obtained for each standard inhibitor suggest consistent performance between assays conducted on separate occasions (Table 4). For the five enzyme systems studied, the Z-factors ranged from 0.56 to 0.76. The assay signal dynamic range and data variation as a function of signal measurement are used to generate the Z-factor coefficient. This gives an indication of assay quality. Z-factor values of 0.5 to 1 indicate excellent assay performance, as described by Zhang et al. 10
Conclusion
This study demonstrates that it is possible to integrate an EVO and Nanodrop II to provide a fully automated assay platform for inhibition screening in the pharmaceutical industry. Furthermore, 1536-well microplate technology can be successfully used to miniaturize existing P450 inhibition screens and reduce the operating costs involved. 11
The introduction of this assay as a routine screen has reduced the cost of determining inhibition IC50 for one compound across the five major human P450 isoforms by approximately 20-fold, while reducing the number of times the assay is required to be run for a given weekly throughput due to the higher microplate capacity. Previously, the 96-well format assay took up to 3 h to test 13 compounds against 5 P450 isoforms. This included all liquid handling, plate manipulations, incubation time, and plate analysis, whereas the assay described here has a throughput of 50 compounds in the same time frame.
The increased volume of raw data outputted from the assay required a bespoke solution for data handling to mitigate against data processing errors. Data were automatically transferred from the instrument to analysis computer, and imported into a Microsoft Excel workbook macro to calculate IC50 values.
The integrated equipment used for the automation of the assay described here has proven reliable over greater than 1 year's operation, where the system has been run at least once a week. The successful integration of the two liquid-handling devices opens the possibility of using this instrument combination for other drug discovery applications, where gains achievable from miniaturization are desirable.
Acknowledgments
The authors would like to thank Sebastian Hallworth and Emma Davies for their contribution to the early phase investigations of this technology.
Competing Interests Statement: The authors certify that they have no relevant financial interests in this manuscript.