
Abstract
We evaluated automated nucleic acid (NA) extraction from a variety of different biological specimens using the QIAsymphony SP instrument. QIAsymphony DNA kits were used for DNA purification from human blood and from diverse human and animal tissue specimens. RNA was isolated from human blood stabilized in PAXgene Blood RNA tubes with the QIAsymphony PAXgene Blood RNA kit, and from human colon and bladder carcinoma biopsies using the QIAsymphony RNA kit. Photometric measurement, gel electrophoresis, and LabChip analysis on an Agilent 2100 Bioanalyzer (Agilent, Palo Alto, California) showed that the purified NAs were highly pure and intact, and that excellent yields were obtained. The DNA purified from blood and tissues performed well in single nucleotide polymorphism (SNP) array analysis, shown by call rates for the Affymetrix Genome-Wide Human 6.0 SNP arrays of > 99%. No significant differences were observed when array results of DNA purified either with magnetic particle technology or silica membrane technology were compared. The quality of the DNA allowed accurate allelic discrimination by TaqMan SNP PCR. Gene expression analyses of purified RNA either by “Human Endogenous Control Panel” TaqMan low-density array or on Affymetrix HG UI33 plus 2.0 GeneChips revealed high concordance between manually purified samples and those extracted on the QIAsymphony SP.
Introduction
Purification of biomolecules is a key prerequisite for molecular biology-based applications, not only in life-science applications, such as genomics and proteomics research, but also for areas like molecular diagnostics, biomedical and biosecurity research, and veterinary and human identity testing. 1 3 High-quality DNA, RNA, and proteins need to be isolated to achieve reliable results from demanding downstream assays, such as real-time PCR or microarrays.
Automated sample preparation has become a key factor for many laboratories to guarantee reproducibility of results and to save hands-on time by avoiding cumbersome, failure-prone, and expensive manual procedures. 4,5 Most automated sample preparation solutions in the market are designed for high-sample throughput and a very limited range of applications, which meets the needs of large molecular biology service providers and service units of large academic institutes or pharmaceutical companies. 6 8 The expressed need for medium sample throughput with highly flexible sample numbers in parallel with the possibility to handle diverse sample materials for biomolecule isolation is largely unmet by any instrument currently available. The challenge of developing a universal platform for different applications is to combine maximum flexibility with ease of use and high performance results. Every single application adds specific needs regarding sample types, sample input format, sample preparation procedure, and output formats.
In this study, we evaluated the QIAsymphony SP, a highly flexible system featuring more than 30 sophisticated sample preparation protocols for different applications, handling a wide range of primary and secondary tubes, automated sample barcode reading, and laser-assisted inventory check. The system introduces a new concept of convenient loading and unloading of samples, prefilled and ready-to-run reagent cartridges, consumables, waste, and eluates through different drawers. The system is operated via a touchscreen, eliminating the need for a dedicated external computer. Data transfer to or from any computer in the lab is possible either through the USB port or via ethernet.
This unique combination of hardware design features, which is not found on any existing platform, allows the integration of the QIAsymphony SP in the workflow of nearly any laboratory setting. In this study, we present performance data for a range of QIAsymphony sample preparation protocols in combination with different downstream assays, including microarrays used for genotyping and gene expression profiling.
Materials and Methods
QIAsymphony SP Instrument
Purification of nucleic acids (NAs) was automated on the QIAsymphony SP (Fig. 1A, QIAGEN, Hombrechtikon, Switzerland). The instrument operates with sealed, ready-to-run cartridges prefilled with all reagents required for the purification of up to 96 samples per run, including accessory enzymes (Fig. 1B). The cartridges are opened automatically by the instrument. Figure 1C shows the worktable overview with its compartments and functions. Samples labeled with barcodes are read automatically when sliding the sample carrier into the system. 2D barcodes on reagent cartridges are read during the inventory check. Barcodes on elution vessels can be read by using a hand-held barcode reader. Samples, reagents and consumables, waste, and eluates are separated in different drawers. Protocols and other parameters, such as elution volumes or type of labware, are selected via the integrated touchscreen. The purification procedure is designed to ensure safe, reproducible handling of potentially infectious samples, and comprises four steps: lyse, bind, wash, and elute. The QIAsymphony SP uses a magnetic head containing an array of 24 magnetic rods, and can therefore process up to 24 samples simultaneously.
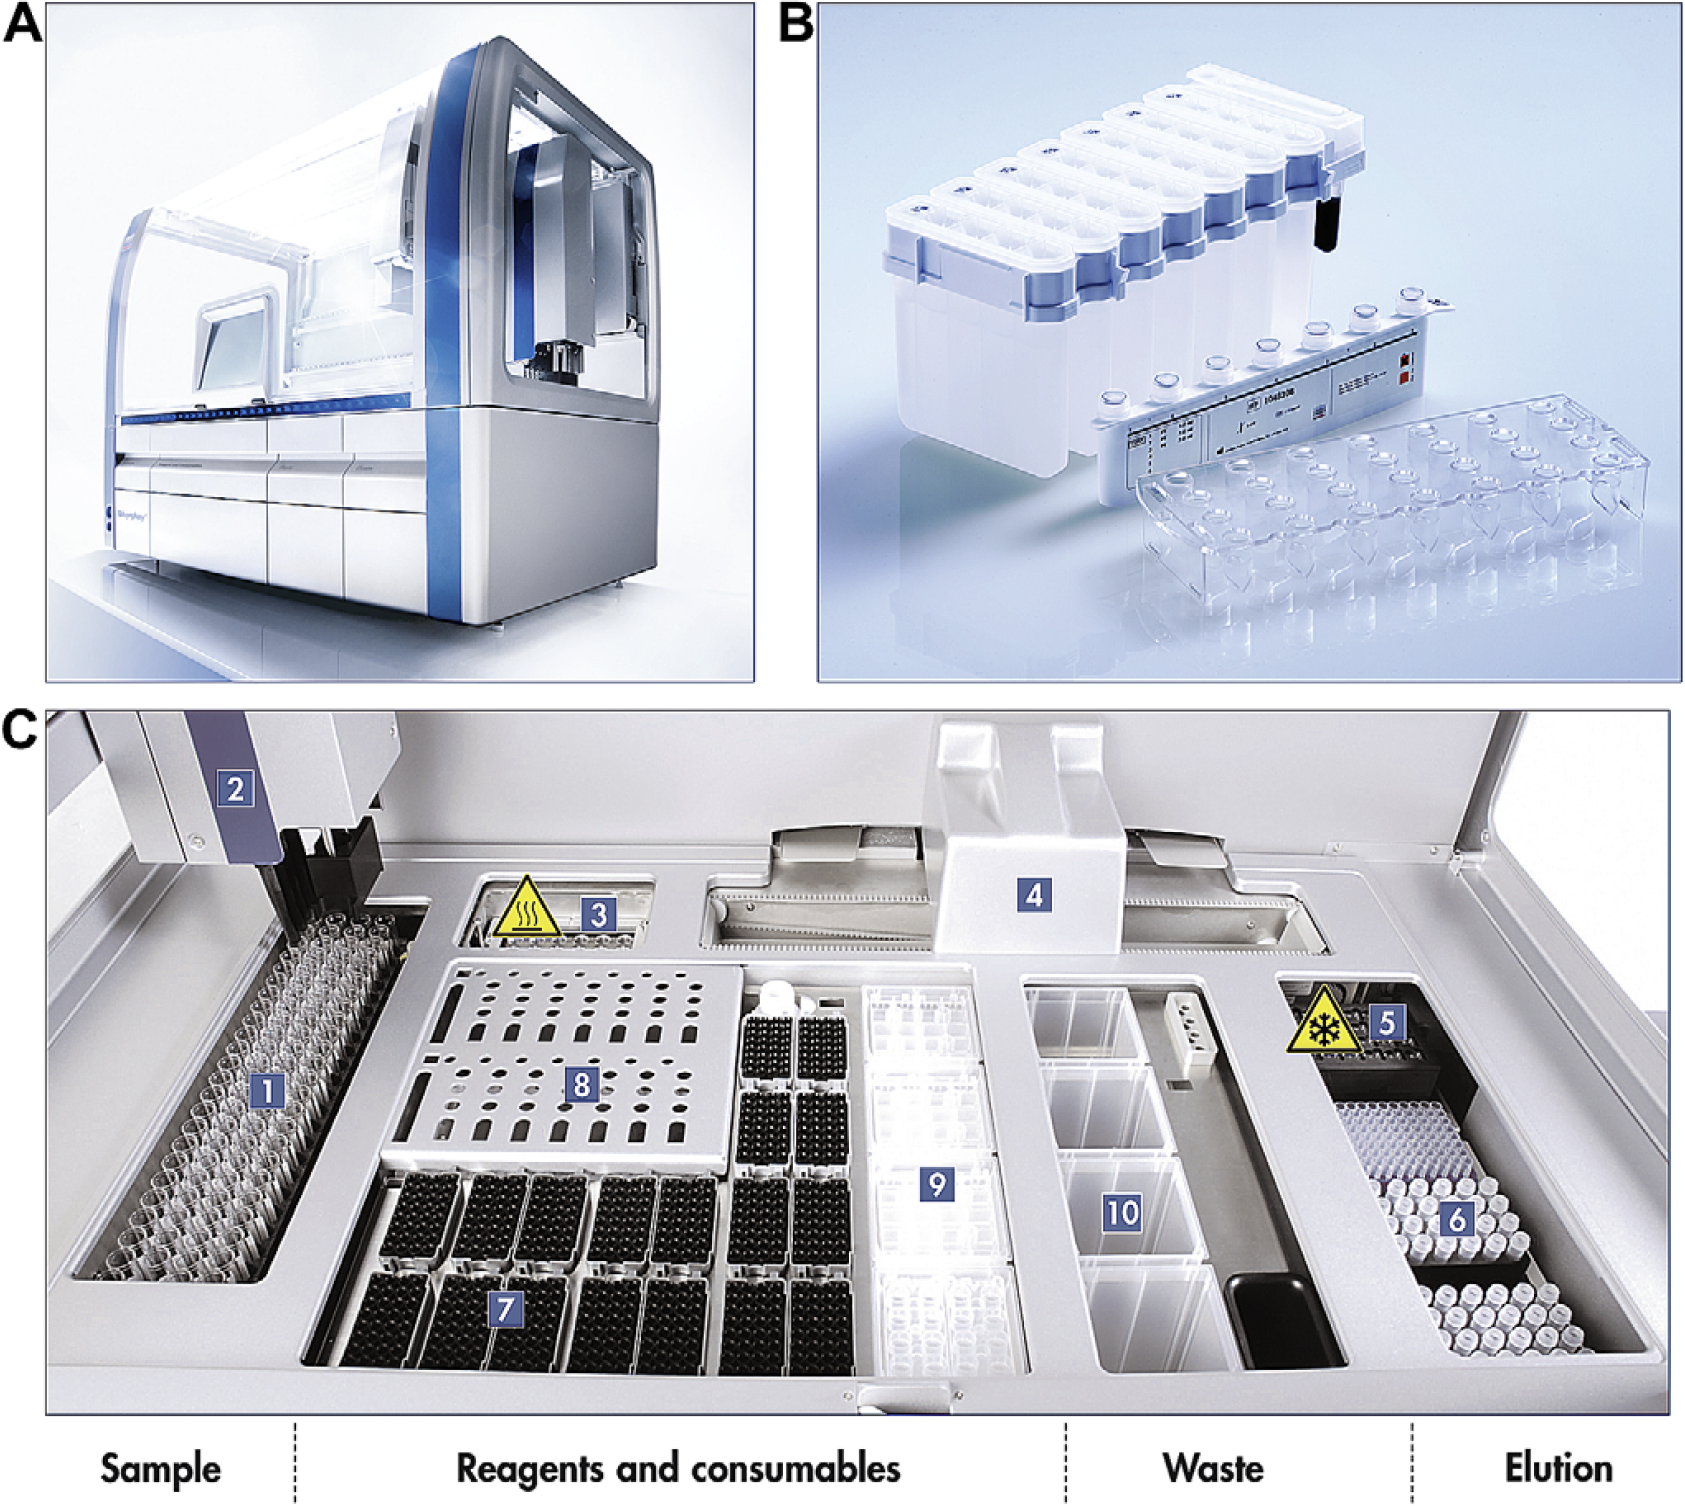
QIAsymphony SP. (A) QIAsymphony SP workstation; (B) Reagent cartridge; (C) Worktable overview. 1, Sample input; 2, robotic arm; 3, heated lysis station/shaker; 4, purification station; 5, elution slot 1 (cooled); 6, elution slots 2–4; 7, filtertips; 8, reagent cartridges; 9, sample prep cartridges and eight-rod covers; 10, waste compartment.
DNA Blood and Tissue
Human whole blood was collected in EDTA tubes and the white blood cell (WBC) counts were quantified using a Sysmex XE2100 Hematology Analyzer (Sysmex America, Inc., Mundelein, IL, USA) or the hematology system AT diff (Beckman Coulter, Miami, FL, USA). Blood was stored at −20 °C for a maximum of 30 days before use. DNA extraction was performed on the QIAsymphony SP workstation using the QIAsymphony DNA Mini and Midi Kits (QIAGEN GmbH, Hilden, Germany) in combination with the DNA Blood protocols. Extractions using the QIAamp DNA Blood protocols, either manually or on the BioRobot MDx with 200-μL input volume each, served as reference methods and were performed according to the manufacturer's instructions (QIAGEN GmbH, Hilden, Germany).
Human lung, colon, and bladder, and rat spleen, liver, and muscle tissue samples, each derived from two independent donors, were used for extraction of DNA from tissue. Human lung tissues were stabilized in Allprotect Tissue Reagent (QIAGEN GmbH, Hilden, Germany) after collection and stored at −20 °C; all other tissue samples were frozen immediately after collection. Samples were lyzed by overnight treatment with proteinase K in lysis buffer ATL (QIAGEN GmbH, Hilden, Germany). For each individual sample and donor, lysis was done in one pooled batch that was aliquoted afterwards into eight replicates for DNA extraction. The amount of tissue used per sample was 20 mg for rat spleen; 25 mg for human lung, colon, and rat liver; and 40 mg for human bladder and rat muscle. Four aliquoted lysates were extracted on the QIAsymphony SP workstation using the QIAsymphony DNA Mini Kit and the Tissue DNA High Content protocol. As a reference, the remaining aliquots from the same pools were extracted manually using the QIAamp DNA Mini Kit (QIAGEN GmbH, Hilden, Germany) according to the handbook instructions. DNA was eluted in 200-μL elution buffer in all extraction methods.
Quality and quantity of the extracted DNA was checked either on a SpectraMax Plus (Molecular Devices, Sunnyvale, CA, USA) or on a Nanodrop ND-1000 UV—Vis Spectrophotometer (NanoDrop Technologies, Wilmington, DE, USA) by spectral absorption scans from 230 to 350 nm and by agarose gel electrophoresis.
For SNP TaqMan analysis and SNP arrays, fresh blood was collected from nine donors (Donors 1–8 were used for SNP TaqMan analysis and Donors 2 and 9 were used for SNP arrays). Tissue samples were analyzed using eluates from the extractions described above. TaqMan SNP genotyping analyses were performed on samples from eight different donors with six replicates each for blood and on all human tissue samples using an assay for the rs4680 marker in the catechol-O-methyltransferase (COMT) gene (assay ID: c_25746809, Applied Biosystems, Foster City, CA, USA). All procedures were performed according to the standard protocols provided by the manufacturer.
Genome-wide SNP analyses were performed using the Affymetrix Genome-Wide Human 6.0 SNP array (Affymetrix, Santa Clara, CA, USA). Blood samples from Donor 2 extracted on either the QIAsymphony SP or the BioRobot MDx were used to compare both platforms.
Further, to show reproducibility, three SNP arrays with DNA from the same donor (Donor 9) extracted in triplicates with the QIAsymphony SP were analyzed. For tissue, two samples extracted on the QIAsymphony SP workstation and one manually extracted sample of each human tissue type were analyzed on a SNP array after standard Affymetrix protocols. The SNP call rate and the correlation matrix were determined with Affymetrix Genotyping Console 2.1.
PAXgene Blood RNA and RNA from Tissue
Human whole blood (2.5 mL) was collected in PAXgene Blood RNA Tubes according the manufacturer's instructions (PreAnalytiX, Hombrechtikon, Switzerland) and frozen at −80 °C 2 h after blood withdrawal. The frozen samples were thawed for 16 h (overnight) at room temperature in batches of 12 or 24 before processing. These samples were processed with the QIAsymphony PAXgene Blood RNA kit (PreAnalytiX, Hombrechtikon, Switzerland) on the QIAsymphony SP workstation or, as a reference, manually with the PAXgene Blood RNA kit (PreAnalytiX, Hombrechtikon, Switzerland) according to the manufacturer's instructions.
The RNA was isolated from human lung—carcinoma specimens stabilized in Allprotect Tissue Reagent (QIAGEN, GmbH, Hilden, Germany) and from snap-frozen human colon—carcinoma specimens; 12.5 and 20 mg of colon and lung tissue, respectively, were used per preparation. Master homogenates were prepared using a Dispomix Drive (Xiril AG, Hombrechtikon, Switzerland) from 200 and 320 mg, respectively, of each tissue in 6.4-mL buffer RLT plus (QIAGEN GmbH, Hilden, Germany), and split into 14 samples of 400 μL homogenate each. Twelve samples per tissue were run on the QIAsymphony SP with elution in 100 or 50 μL, respectively. From the remaining two samples of each tissue, RNA was prepared using the RNeasy Mini kit (reference samples; QIAGEN, GmbH, Hilden, Germany) according to the manufacturer's instructions, except for the use of RLT plus homogenates, and using 400 μL each of homogenate and 70% ethanol for binding to the spin column. RNA was eluted in 2 × 50 μL.
Spectral absorption scans from 230 to 350 nm were performed as described above. Additionally, integrity of the purified RNA was determined with the RNA 6000 Nano LabChip on an Agilent 2100 Bioanalyzer (Agilent, Palo Alto, CA, USA). 9 Until further analysis, the RNA was stored at −20 °C.
Two types of downstream assays were performed for gene expression analyses. Eluates were analyzed in triplicate on a “Human Endogenous Control Panel” TaqMan low-density array (LDA) with an ABI 7900 instrument (Applied Biosystems, Foster City, CA). Microarray analysis was carried out using the Affymetrix HG U133 plus 2.0 Genechip (Affymetrix, Santa Clara, CA). Thirty nanograms of total RNA from each PAXgene Blood RNA eluate was labeled using the Ovation Whole Blood Solution system and protocol (NuGen, Bemmel, The Netherlands), 10,11 and from each tissue eluate, 1 μg was labeled using the GeneChip Expression One-Cycle cDNA Synthesis Kit (Affymetrix, Santa Clara, CA) and standard protocols. The scanned GeneChips were analyzed using GCOS (Affymetrix, Santa Clara, CA) and globally scaled to 150 units.
Informed written consent was obtained from all the patients and research protocols were approved by the ethical committee of Aarhus County, Denmark.
Results
Results of this study are divided in two parts with respect to the kind of NA (DNA, RNA) that was isolated and analyzed. Within each of these two paragraphs, the first set of data was generated in the QIAGEN R&D department and represents experiments that demonstrate the general performance of the QIAsymphony with respect to quality control parameters, for example, yield (Table 1), optical density (OD) measurement profiles, agarose gels, and Agilent Bioanalyzer electropherograms (Fig. 2). The second set of data in each paragraph was generated during the external validation of the QIAsymphony instrument at AROS Applied Bio-systems. AROS is a clinical research organization working in a good laboratory practice (GLP) environment. AROS' results obtained with QIAsymphnony-purified NAs with a set of downstream applications are presented in Figures 3 –6.
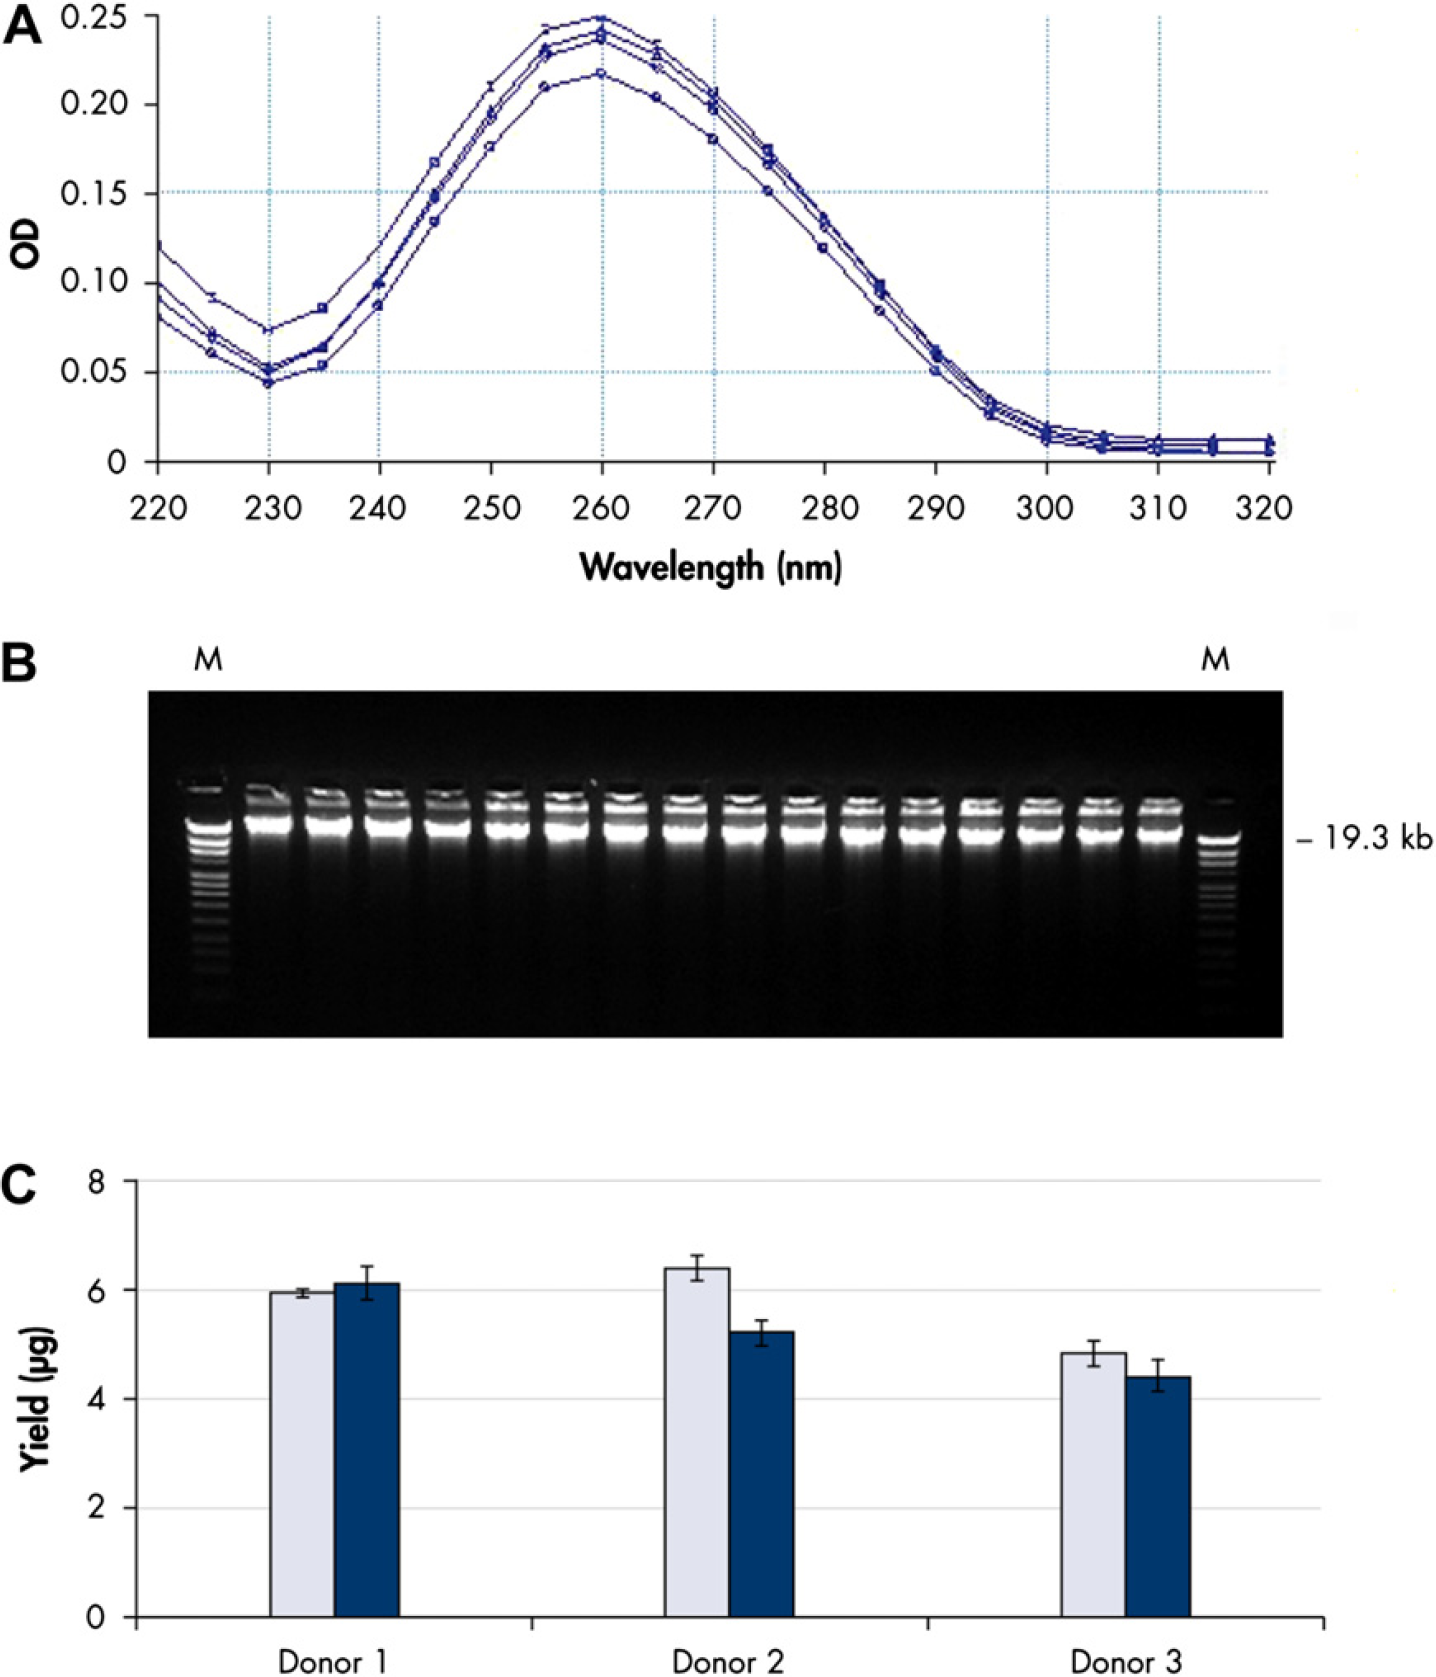
Quality of nucleic acids isolated on the QIAsymphony SP. (A) Spectrophotometric analysis of DNA isolated with the QIAsymphony DNA Blood 200 protocol; (B) electrophoresis of purified DNA from 16 different blood samples on a 0.8% agarose gel, M = DNA Molecular Weight Marker IV (Roche); (C) bar chart of DNA yields obtained from 200-μL blood each from three different blood donors either with the QIAsymphony SP (gray bars) or with the QIAamp DNA Blood Mini kit (black bars). Error bars indicate standard deviation from the mean of six replicates; (D) electropherograms and OD scans of RNA isolated from 20-mg rat kidney using the QIAsymphony RNA kit (upper panel), or RNeasy Mini kit (lower panel); (E) electropherograms of RNA purified with the QIAsymphony PAXgene Blood RNA kit. Overlaid triplicates from four donors are shown. RIN means RNA integrity number.
Observed yields for the different QIAsymphony applications
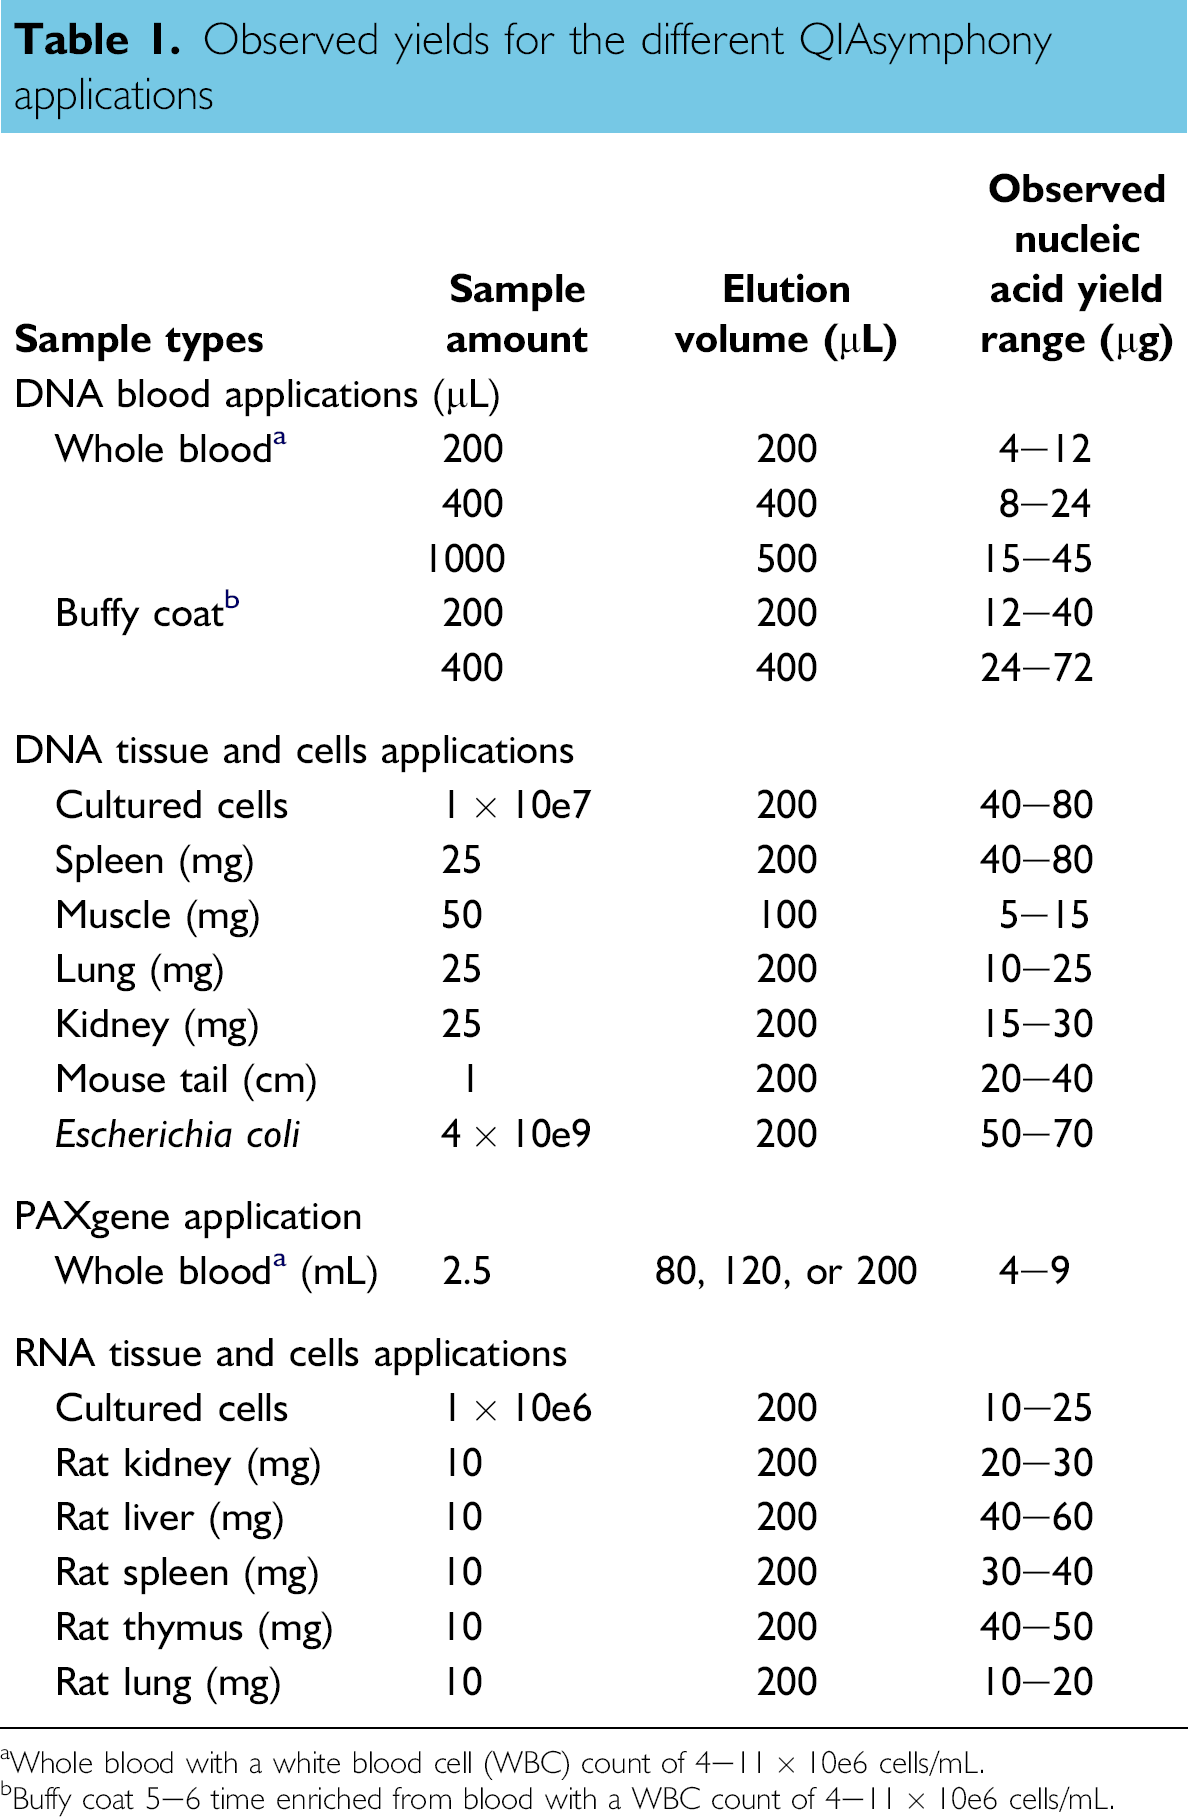
aWhole blood with a white blood cell (WBC) count of 4–1 × 10e6 cells/mL.
bBuffy coat 5–6 time enriched from blood with a WBC count of 4–11 × 10e6 cells/mL.
DNA Purification from Blood and Tissue
Typical yields obtained with the QIAsymphony DNA Kits for a range of different sample types are shown in Table 1 (upper half, DNA blood, and DNA tissue and cells applications). For human blood, DNA yields increase as a function of the blood input volume, amounting up to 45 μg from 1 mL blood. The number of WBCs in human blood varies even for healthy donors, and therefore determines the amount of DNA that can be purified. Blood samples with WBC numbers from 4.0 × 10⁶ to 1.0 × 10⁷ cells/mL were used for DNA isolation on the QIAsymphony SP system. DNA yields from 4 to 12 μg were obtained using the QIAsymphony DNA Mini Kit with the DNA Blood 200-μL protocol. With the QIAsymphony DNA Midi Kit yields ranged from 8 to 24 μg from 400-μL blood, and from 15 to 45 μg from 1-mL blood (Table 1).
The isolated DNA was highly pure (Fig. 2A) and of good integrity as shown by agarose gel electrophoresis of DNA purified from 16 different blood samples (Fig. 2B). Efficiency of DNA purification from three different blood donors was comparable with the QIAamp DNA Blood Mini Kit based on silica membrane technology (Fig. 2C).
DNA yields from different types of human and animal tissues were comparable or higher when isolations were done on the QIAsymphony SP, and variation between replicates of tissues from the same donor was lower compared with the manual purifications (data not shown). Yields varied depending on the type and donor of the tissue and ranged from 10 μg for human lung up to 79 μg for rat spleen when isolated on the QIAsymphony SP. Manual extractions varied between 9 and 50 μg. For both methods, OD 260/280-nm ratios of 1.79–2.05 indicate that DNA was highly pure.
DNA extracted on the QIAsymphony SP from eight blood donors (six replicates each) and from various human tissues was used for TaqMan SNP analyses of the COMT gene. Using the autocaller function, an unambiguous typing of homozygous AA (Donor 5; blue), GG (Donors 3, 6, 7, and 8; red), and heterozygous (Donors 1, 2, and 4; green) blood samples was obtained (Fig. 3A) with a mean quality value of 99.6%. The high stringency with which the six replicates each clustered together indicates a high reproducibility of the sample extraction with the QIAsymphony SP.
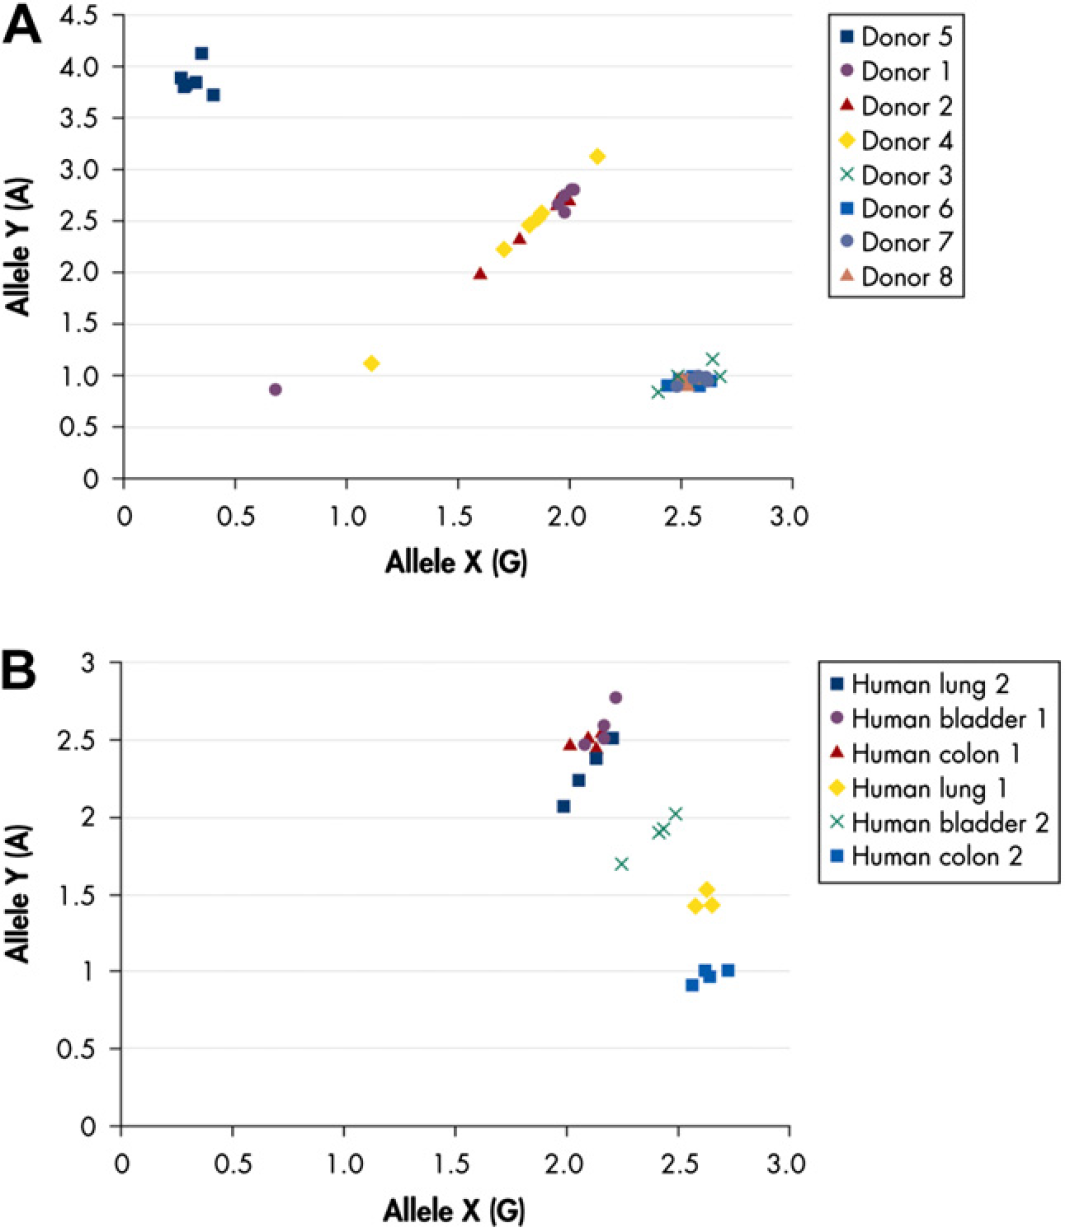
Allelic discrimination. DNA was isolated with the QIAsymphony DNA Mini kit and genotyped by TaqMan SNP analysis of the rs4680 marker in the catechol-O-methyltransferase gene. (A) Allelic discrimination plot of DNA from eight different blood donors (six replicates each); (B) allelic discrimination plot of DNA from human lung, tissue, colon, and bladder (two different donors with four replicates for each tissue type). Homozygous AA, GG, and heterozygous genotypes are indicated in blue, red, and green, respectively.
TaqMan SNP analyses of all human tissue samples also showed a clear separation of homozygote and heterozygote samples with a mean quality value of 95.6% (Fig. 3B). When compared with the blood samples, we observed a somewhat lower-quality value and larger spread of heterozygote sample points, which may be ascribed to the heterogeneous nature of cancer tissue.
We next investigated whether DNA purified from the same sample, either with magnetic particle technology or with silica membrane chromatography, differs in performance on Affymetrix Genome-Wide Human 6.0 SNP arrays. Blood from Donor 2 and human colon, lung, and bladder cancer tissue samples each from one donor were extracted with magnetic particles on QIAsymphony SP, and with silica membrane technology using either QIAGEN's BioRobot MDx or the manual QIAamp DNA Mini Kit.
Results for all samples are summarized in Table 2. High call rates of >99% and accurate gender determination were obtained for all blood samples, irrespective of the purification method. Analysis of Donor 9 in triplicate showed that DNA purification on the QIAsymphony was highly reproducible.
Results of Affymetrix SNP 6.0 arrays
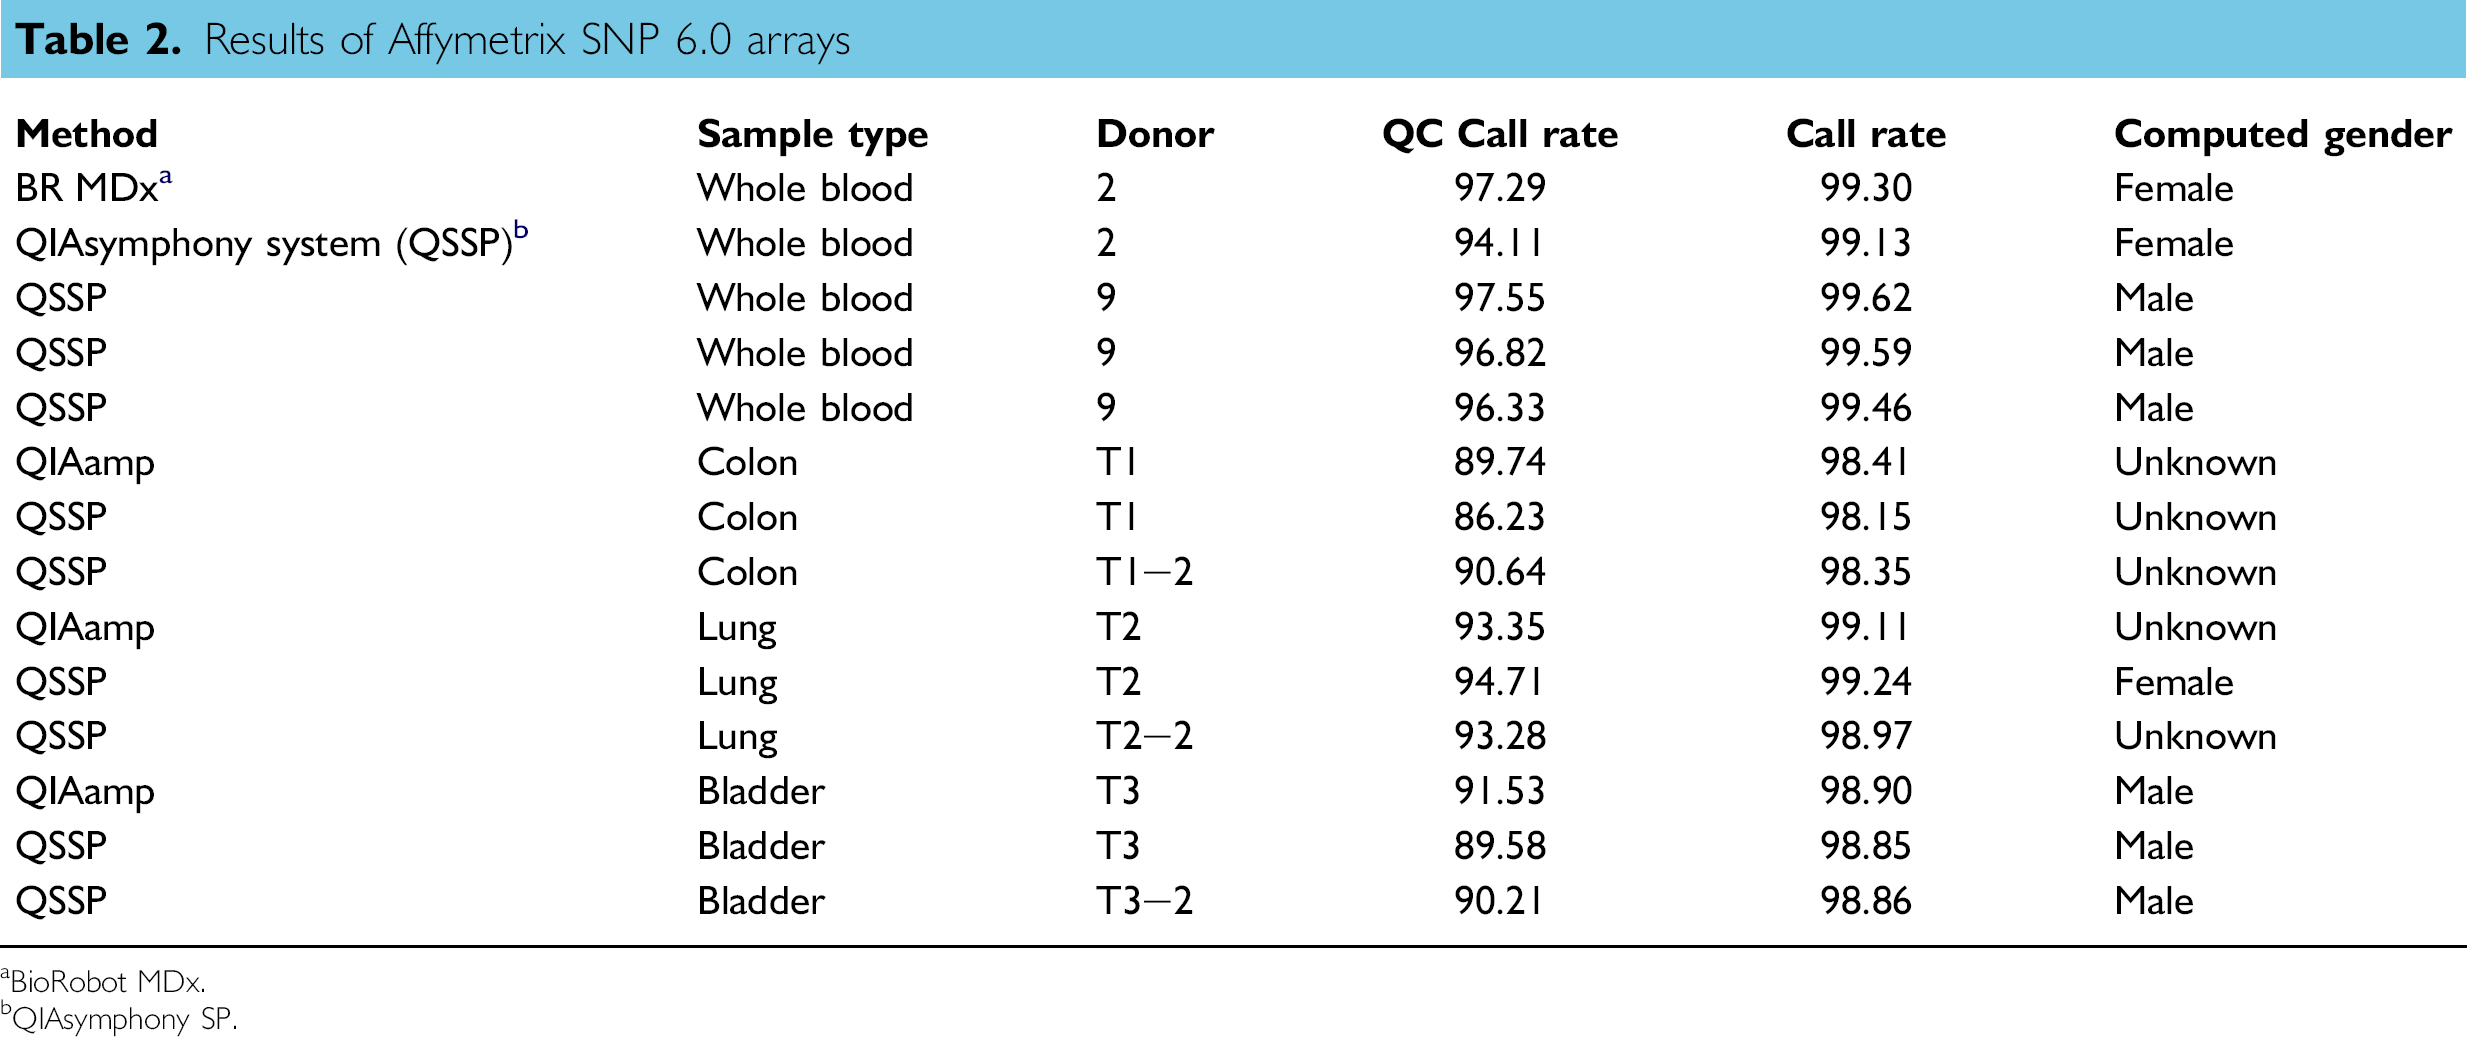
aBioRobot MDx.
bQIAsymphony SP.
SNP call rates obtained with the various human cancer tissues were >98%. As expected for cancer-tissue samples, the values were slightly lower than those obtained for blood samples because of chromosomal abnormality, and for the same reason, the computed gender determination lung sample failed in some of the samples (Table 2).
Figure 4 shows a correlation matrix of all blood and tissue samples analyzed on Affymetrix SNP 6.0 arrays. DNA from the same sample approached 100% identity, both for blood and tissue samples, and independent of the sample extraction method. DNA from unrelated samples correlated in approximately 60–70% of the SNPs, as expected.
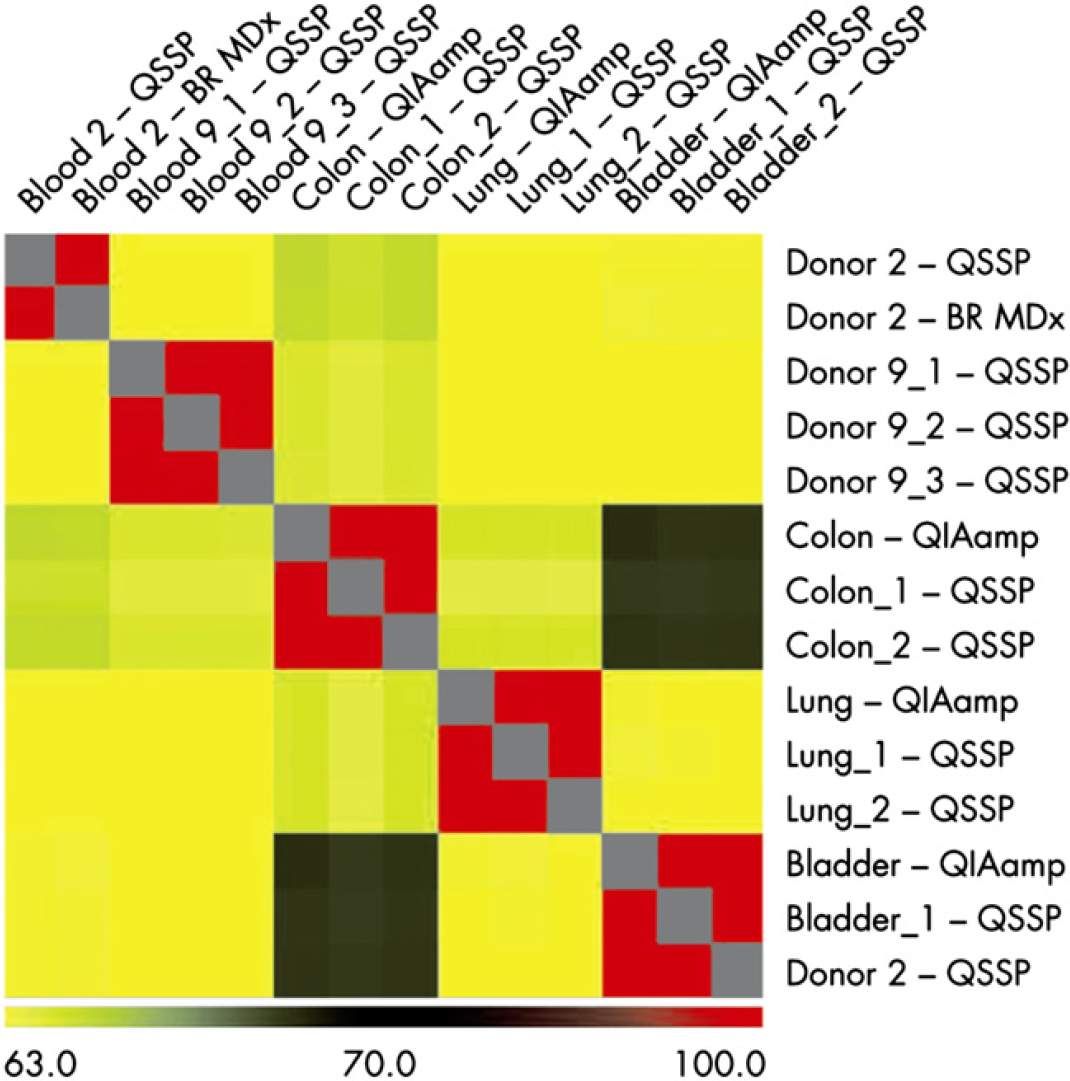
Affymetrix SNP 6.0 array correlation matrix. DNA isolated from blood and tissue samples either with the QIAsymphony system (QSSP) or with a manual (QIAamp DNA kit, QIAamp), or automated (BioRobot MDx system, BR MDx) silica membrane technology was analyzed with Affymetrix SNP 6.0 arrays. Present calls were correlated using the Affymetrix Genotyping Console 2.1. The color code at the bottom of the graph indicates the range of correlation from 63% (yellow) to 100% (red).
PAXgene Blood RNA and RNA Tissue and Cells
The PAXgene Blood RNA tubes, in combination with the different dedicated PreAnalytiX sample preparation procedures, are the widely accepted standard with respect to conservation of transcript profiles from human blood. 12 15 Blood RNA extracted from these tubes using the QIAsymphony SP was highly pure (A260 nm/A280 nm ratio between 1.8 and 2.2) and of high integrity as documented by the high RNA integrity numbers (RIN) on the Agilent BioAnalyzer (Fig. 2D). The mean RIN value of the analyzed samples was 8.1. The amounts of contaminating DNA in QIAsymphony PAXgene Blood RNA preparations was far below 0.1% of the total NA content of the eluates and therefore near the detection limit of the TaqMan real-time PCR assay used (data not shown). In human blood, white cells and immature red cells are the sources of cellular RNA. The range of these cell types for different healthy donors is very wide. It ranges from 4.8 × 10⁶ to 1.1 × 10⁷ cells/mL for white cells. 16 Consequently, the RNA yield from human whole blood is highly donor dependent, which is reflected by the range of 4–9 μg (Table 1).
RNA isolation from tissue with the QIAsymphony RNA kit was evaluated using human lung and bladder cancer biopsies. The RNeasy Mini kit was used as a benchmark for RNA quality and purification efficiency. With elution in 100 μL, RNA yields and concentration from lung were comparable to RNeasy (mean yields of 22 and 21 μg from 20 mg of tissue), whereas the colon samples produced higher yields on the QIAsymphony SP (28 vs. 17 μg from 12.5 mg). Typical RNA yields obtained with the QIAsymphony RNA kit are shown in Table 1. The mean RIN score was comparable for all preparations, between 7.2 and 8.2, which is well within expectations for cancer tissue samples. A260 nm/A280 nm ratios were all between 2.0 and 2.1, and A260 nm/A230 nm ratios were between 1.7 and 2.0 for the QIAsymphony samples (1–1.6 for RNeasy samples), indicating high purity of the isolated NA. Residual gDNA content was determined with a specific (beta-actin) TaqMan assay (data not shown). No amplification signal was recorded after 40 PCR cycles from any of the QIAsymphony RNA samples, indicating virtually complete absence of DNA.
The most common downstream analysis methods for RNA are expression profiling assays using real-time-PCR or reverse transcriptase (RT)-PCR and microarrays. 4,17 Therefore, eluates from eight PAXgene Blood RNA samples, consisting of two replicates from two human donors processed by the QIAsymphony SP and the corresponding manual references were analyzed in triplicate on a Human Endogenous Control Panel TaqMan LDA (Fig. 5A). The same assay was prepared with eluates from eight samples (two replicates from colon, four replicates from lung) and the corresponding RNeasy Mini Kit eluates (Fig. 5B). This LDA consists of assays representing 16 human genes that are commonly used as endogenous control genes in expression analysis. To normalize the data, glycerinaldehydephosphate dehydrogenase (GAPDH) was used as reference gene. The cycle threshold (CT) values obtained from all samples correlated closely, and the delta CT values of samples descendent from the same donor are within a range of one CT. Therefore, we concluded that there is no significant difference in RT-PCR performance of QIAsymphony SP and manually extracted samples.
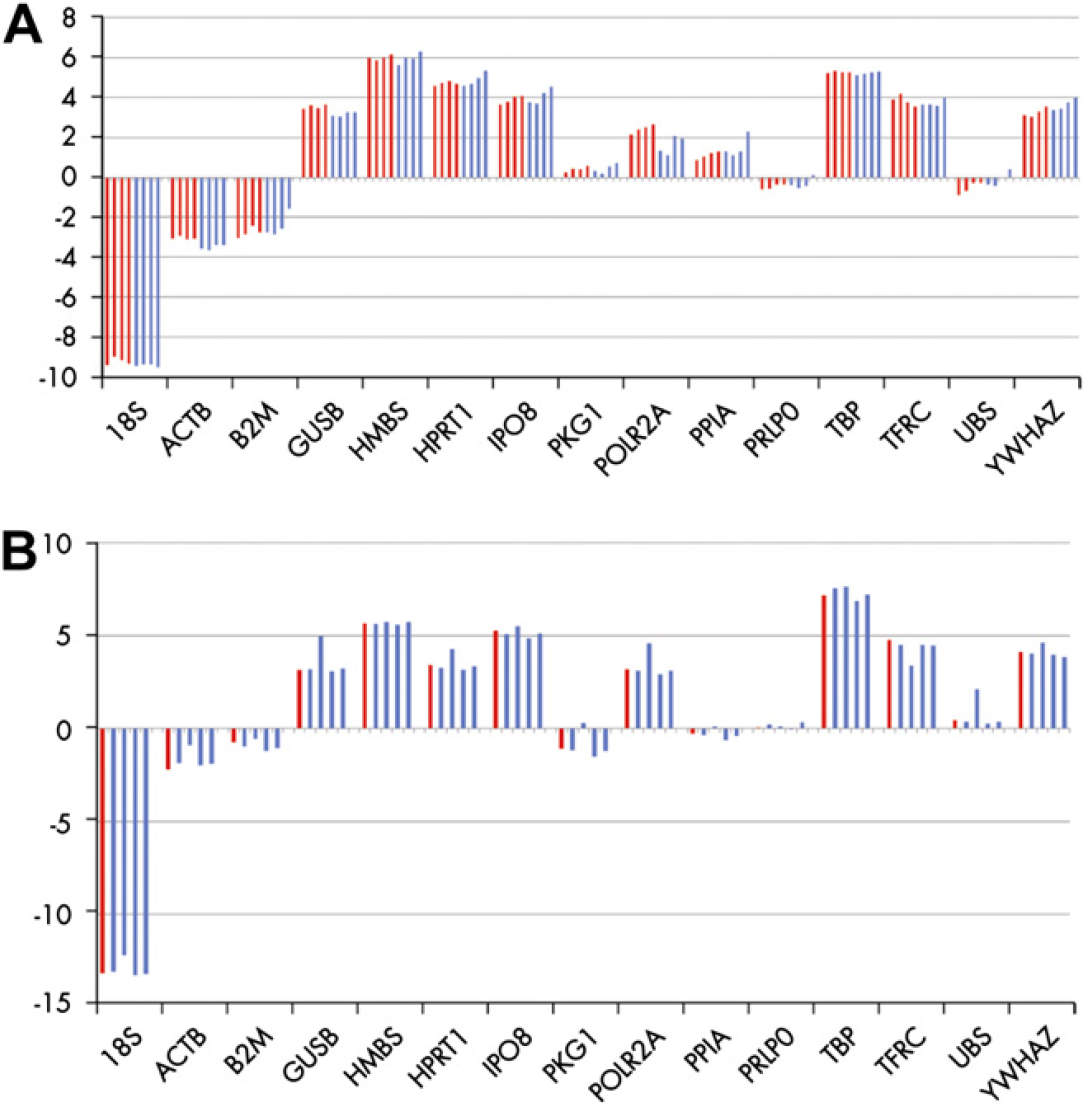
Human Endogenous Control Panel TaqMan low-density array (LDA). Gene expression levels of 15 transcripts contained in the Human Endogenous Control Panel TaqMan LDA were analyzed. Results are plotted as ratios of the GAPDH expression, which served as an endogenous control. (A) RNA isolated manually (blue) or on the QIAsymphony SP (red) from two different blood donors and (B) lung samples.
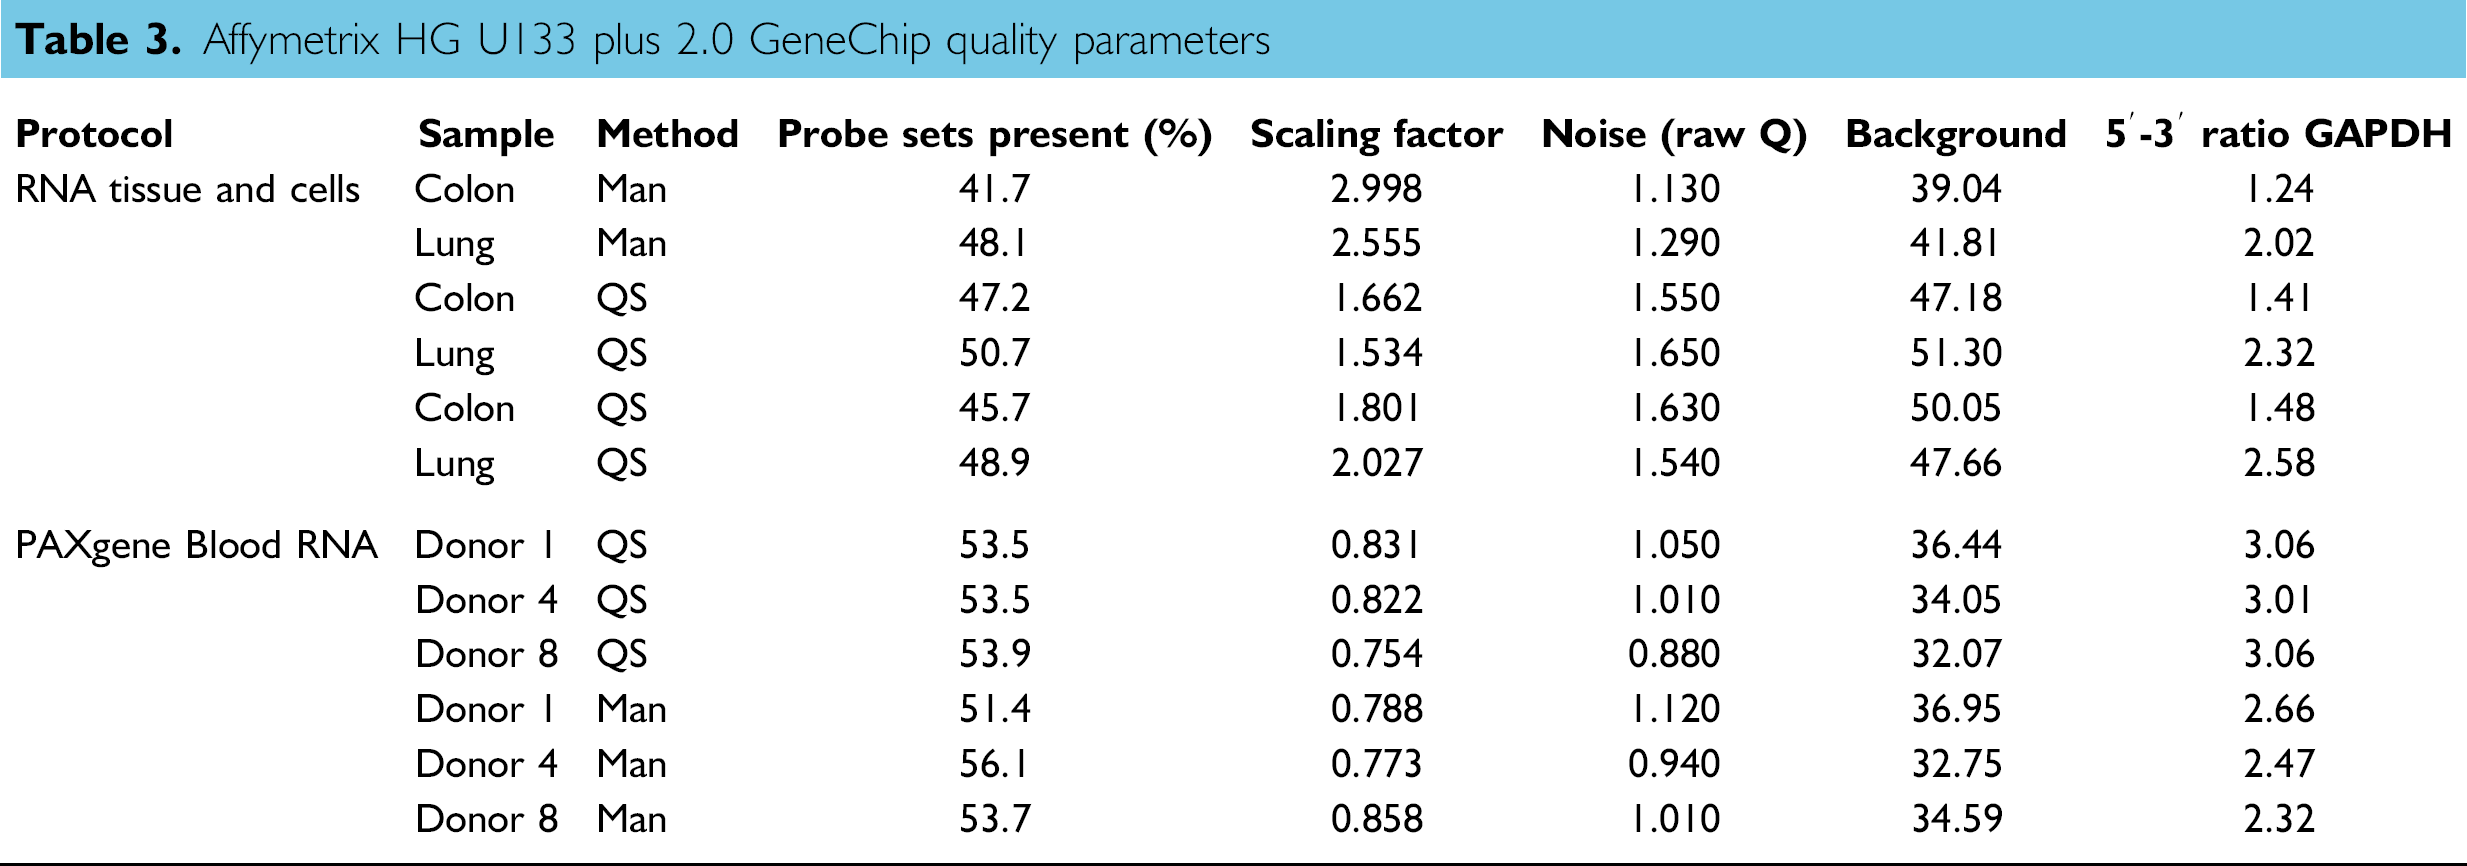
Eluates of blood samples of three donors processed either with the QIAsymphony SP or with the manual PAXgene Blood RNA preparation and human tissue samples consisting of duplicates from two different tissues processed with the QIAsymphony SP and corresponding samples processed with the RNeasy Mini Kit were analyzed on the Affymetrix HG U133 plus 2.0 GeneChip. For the six microarrays hybridized with blood samples, we saw equally high present call rates, 53.3% for QIAsymphony and 53.6% for the manual preparations, and similar scaling factor, noise, and background values (Table 3). For the tissue samples, present call rates, noise, and background were all slightly higher for the QIAsymphony than the reference preparations. The 5′–3′ ratios of GAPDH and especially β-actin are usually higher using the NuGen kit compared with Affymetrix labeling kit, and this was also seen in this experiment. However, the values were all within the normal range for the NuGen kit. All array quality control (QC) parameters (present calls, scaling factor, background, 5′–3′ ratio) hybridized with tissue RNA were well within the expected range, with present call rates, signal intensities, and also background marginally higher for the QIAsymphony isolated samples (Table 3).
Affymetrix HG U133 plus 2.0 GeneChip quality parameters
We performed a Pearson's correlation of the MAS5 analyzed microarray data after reducing the microarray data sets from 54.675 to 42.774 probe sets by deleting those that were scored as absent in all samples. As seen on the plot (Fig. 6A), data of samples of the same origin were best correlated to each other. A correspondence analysis (COA) of the same data sets was carried out to get a more detailed picture. The COA displays a low-dimensional projection of the data, where samples with similar profiles are located close to each other in the plot. As seen on the plot (Fig. 6B), the samples were located in three clusters separating lung, colon, and blood samples. As expected, we further saw a far less pronounced separation between QIAsymphony- and silica membrane—extracted samples for lung and colon within these organ-specific clusters. Similarly, the effect of different extraction methods within the PAXgene stabilized blood cluster was less pronounced than the influence of different blood donors.
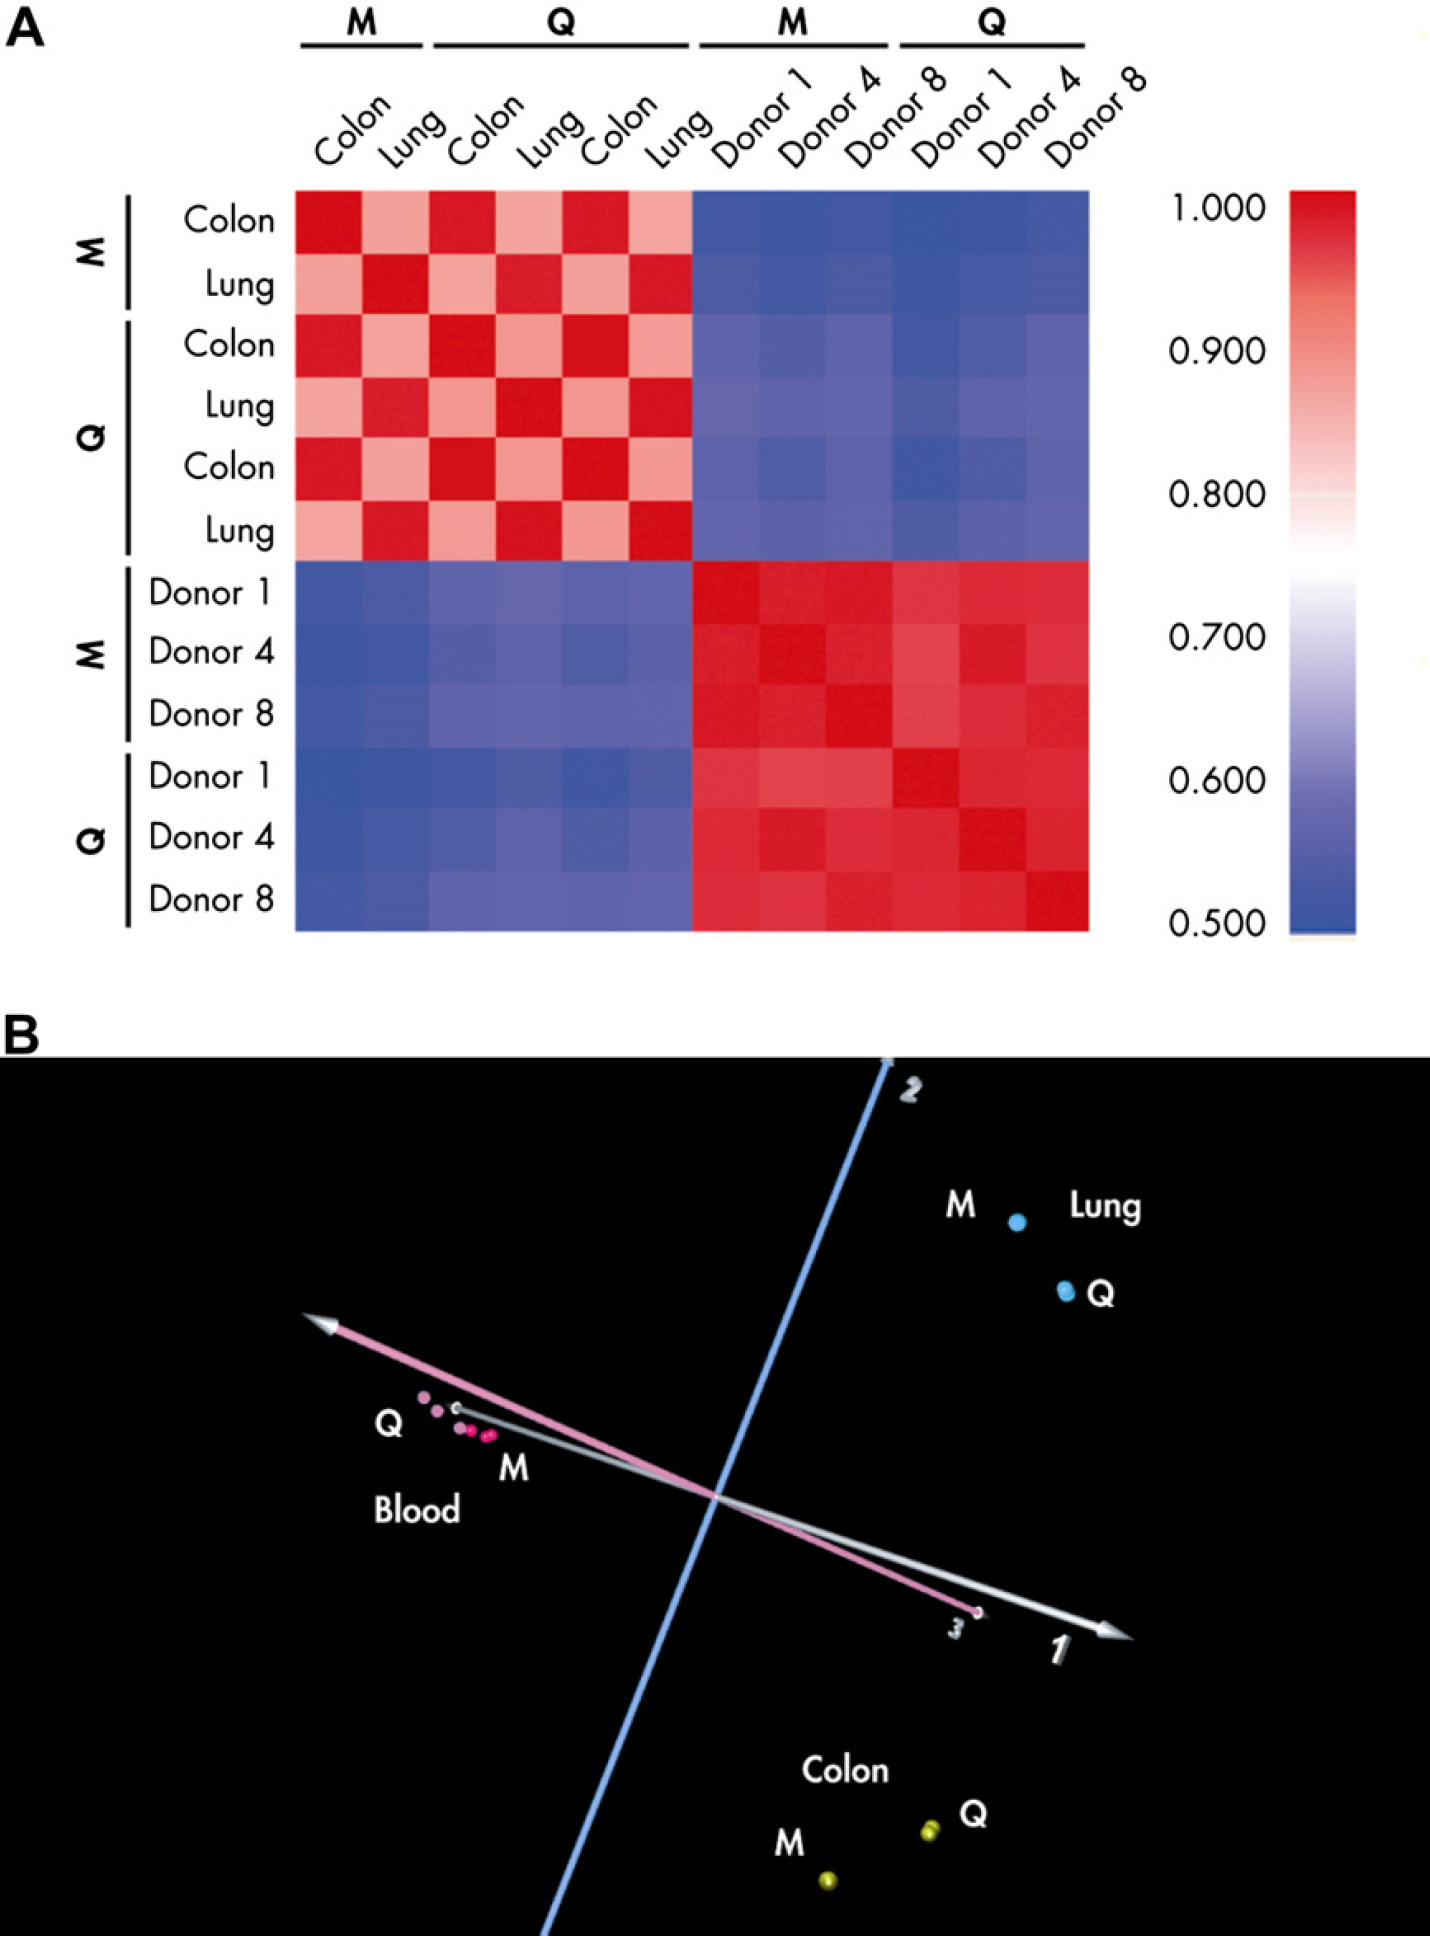
A) Pearson's correlation, and (B) correspondence analysis of MAS 5 analyzed microarray data. RNA from human lung, colon, and blood was analyzed on Affymetrix HG U133 plus 2.0 GeneChips (see text for further details). The color code at the right of (A) indicates the range of correlation from 0.5 (blue) to 1.0 (red). Sphere color code in (B) cyan: lung; yellow: colon; red and pink: blood. “M” refers to manual extraction and “Q” to QIAsymphony SP extraction.
Discussion
This study was designed to test the QIAsymphony SP system's ability to purify both DNA and RNA from a wide variety of biological sample materials. High yield and quality allow the usage of the purified NAs in demanding downstream applications, such as PCR- and microarray-based analyses for SNP, gene copy number variant (CNV), and RNA transcript level. The QIAsymphony SP system is based on a novel magnetic particle technology, and to validate system performance, identical specimens were extracted in parallel using established silica membrane chromatography methods.
Primary QC metrics showed equivalent quality between methods both for DNA and RNA. Thus, the purity as determined by A260 nm/A280 nm ratio was excellent. Agarose gel electrophoresis demonstrated high molecular weight DNA, and Agilent Bioanalyzer analyses demonstrated highly intact RNA. The most important quality metric for DNA for PCR-based methods is that the preparation is free of enzyme inhibiting substances. For Affymetrix SNP microarray analysis, the size of the extracted DNA is also important. Our data reveals no difference in quality between DNA extracted on the QIAsymphony system (QSSP) and the manual and automated reference purification procedure in microarray-based SNP and CNV analyses. We therefore conclude that the novel QIAsymphony SP achieves the same high standards for NA quality known from established NA extraction methods based on silica membrane technology.
The DNA QC metrics are also applicable to RNA. However, because absence of DNA contamination is important for many downstream applications, this aspect should also be analyzed in RNA preparations. Furthermore, integrity of the purified RNA and reproducibility of the isolation are highly important for quantification of individual transcripts. The overall integrity of total RNA, of which 28S and 18S rRNA account for >95%, can be estimated by RIN scores on the Agilent Bioanalyzer. The integrity of mRNA and the reproducibility of its extraction may be estimated by analyzing a number of housekeeping genes using TaqMan LDAs. Analysis of both RNA quality parameters showed similar results for all comparable preparations.
A more detailed picture of the similarity between different samples can be obtained by gene expression profiling on microarrays. As could be expected from purity, intactness, and LDA analysis of the RNA preparations, the primary QC metrics on the microarrays such as sensitivity measured in percentage of present calls and GAPDH 3′–5′ ratio also gave similar results.
The COA is a statistical technique for determining the key variables in a multidimensional data set that explain the differences in the observations. It can be used to simplify the analysis and visualization of multidimensional data sets. 18 The COA and Pearson's correlation of the microarray results highlighted that samples primarily clustered according to tissue type and to a much smaller extent according to the RNA isolation method. Because the magnetic particle-based purification protocols on the QIAsymphony differ significantly from the silica membrane—based reference methods used in this study, we had expected a much larger isolation method impact to be revealed in high-resolution data analysis methods like COA. 19 21 Our data indicate that silica-particle and silica-membrane isolation methods can be used to compare gene expression profiles (Fig. 6). For optimal results, we nevertheless recommend that RNA extraction methods should not be changed between samples that are directly compared with each other.
The QSSP proved well suited for medium- to high-throughput laboratories. Laboratory staff can choose from a variety of primary and secondary labware formats. Two identical or different prefilled reagent cartridges can be loaded onto the instrument allowing up to four different purification protocols to be performed in the same run of 96 samples. QIAsymphony SP enables continuous sample loading and ensures process safety by barcode reading and tracking of samples, inventory scanning, liquid-level and clot detection, and tip guards that function as drop catchers. The worktable can be decontaminated with the integrated UV light. Data transfer to and from the instrument occurs either via ethernet or through the USB port. The QIAsymphony SP is readily implemented in AROS laboratories in a GLP environment that is usually required for clinical trials.
In addition to the applications tested in this study, a variety of protocols for other targets and sample materials, such as viruses and pathogens, forensic samples, and recombinant proteins, are available.
QIAsymphony SP is the first module in a new series of modular instruments, which can be integrated to automate entire workflows—from sample to result. The next module, an automated assay setup system, is currently under development.
Acknowledgment
We thank Nicole Janßen, Maren Wengeler, Franziska Heese, Sandra Hammerschmidt, Christel Kiss, Esther Gaser, and Charlotte Lauritsen for excellent technical assistance.
Disclaimer: For up-to-date licensing information and product-specific disclaimers, see the respective QIAGEN kit handbook or user manual. QIAGEN kit handbooks and user manuals are available at www.qiagen.com or can be requested from QIAGEN Technical Services or your local distributor.
Competing Interests Statement: The authors disclose the following: Thorsten Voss, Katharina Beller, Mario Scherer, Janina Kramer, Thomas Deutschmann, Cordula Homberg, Martin Schlumpberger and Christian Lenz are employed by QIAGEN and have stock options or bond holdings in the company's pension plan. Mogens Kruhøffer is employed and has ownership interest in AROS Applied Biotechnologies.