
Abstract
An automated tandem mass spectrometry—based analysis using precursor ion and neutral loss scans in a triple quadrupole (QqQ) mass spectrometer has been used to identify and quantify changes in the abundances of glycerophospholipids extracted from retina and erythrocytes in a rat streptozotocin model of type I diabetes, 6 and 36 weeks after the induction of diabetes, compared with age-matched nondiabetic controls. The utility of an “internal standard” method compared with an “internal standard free” method for quantification of differences in the abundances of specific lipid ions was evaluated in both retina and erythrocyte lipid extracts. In retina, equivalent results were obtained by using the internal standard and internal standard free methods for quantification. In erythrocytes, the two methods of analysis yielded significantly different results, suggesting that factors intrinsic to particular sample types may influence the outcome of label-free lipidome quantification approaches.
Overall increases (∼25–35%) in the abundances of major retina glycerophospholipid classes were demonstrated in rats at 6 weeks of diabetes, relative to control animals. However, at 36 weeks of diabetes, subsequent overall decreases in retina glycerophosphatidylcholine (GPCho) and glycerophosphatidylethanolamine (GPEtn) abundances of 16% and 33%, respectively, were observed. Additionally, retina and erythrocyte GPCho lipids at both 6 and 36 weeks of diabetes exhibited increased incorporation of linoleic acid(18:2n6) and a decrease in docosahexaenoic acid (DHA(22:6n3)) content. Finally, an approximately fivefold increase in the abundances of specific glycated GPEtn (Amadori-GPEtn) lipids were observed in the retina of 36-week diabetic rats, with a corresponding 1.6-fold increase of Amadori-GPEtn lipids in diabetic erythrocytes.

Introduction
The identification of biomarkers that enables the early detection and prognosis of disease or that facilitates measurement of the efficacy of response to a specific therapeutic intervention, holds great promise in advancing the capabilities of individualized medicine. 1 –3 At this time however, there are only a few bio-markers for complex diseases, such as diabetes or cancer, which provide sufficient information for a variety of potential diagnostic decisions. Recent technological advances in mass spectrometry (MS) have enabled large-scale biomarker discovery efforts to be initiated, particularly in the field of proteomics, 4 without prior requirement for detailed insights into the mechanisms responsible for the disease. However, there are a number of technical issues that currently limit the potential of MS—based protein biomarker identification approaches. Foremost among these is the analytical challenge presented by the enormous dynamic range associated with protein expression, particularly in plasma, which is in a constant state of spatial and temporal flux, as well as the great mixture complexity resulting from the diversity of transcriptional, translational, and posttranslational modifications associated with protein expression throughout the cell cycle. 5 In recent years therefore, efforts have also been directed toward identification of other classes of biological molecules, including lipids, as potential biomarkers of specific disease states. 3,6 Lipids are a diverse group of compounds, including fatty acyls, sterols, glycerolipids, glycerophospholipids, and sphingolipids, that play key biological roles as the main structural component of cell membranes, in energy storage and metabolism, and in cell signaling. A large number of studies have demonstrated that the disruption of lipid metabolism or signaling pathways can play a key role in the onset and progression of human disease. 7 –12 Thus, a comprehensive analysis of the changes in lipid profiles that occur between normal and diseased cells, tissues, or organs, and correlation of the changes observed in the end organs of the disease with those occurring in a more readily accessible blood fraction, such as erythrocytes, may enable the identification and characterization of specific lipids that can serve as effective biomarker signatures of disease.
Diabetic retinopathy is a debilitating complication of diabetes leading to blindness. Evidence of retinopathy is present in 65% of diabetic patients after 10 years of the disease. 13 It is widely accepted that diabetes-induced changes in the end organs of diabetic complications occur well before clinical manifestations of the complications can be observed. Moreover, using currently available treatment options, diabetes-induced changes in the end organs are irreversible after a certain point, even after the achievement of metabolic control. However, recent studies in animal models clearly demonstrate that there is both a circulating blood component and an end-organ component of diabetic complications, and that correcting either of these components, at an early state in disease development, can ameliorate diabetic retinopathy. 14
There is emerging evidence for the role of lipids in retinal pathology. Retina has the highest levels of long-chain n3 and n6 polyunsaturated fatty acids (LCPUFAs), including arachidonic acid (ARA(20:4n6)) and docosahexaenoic acid (DHA(22:6n3)), observed in the body. 15 –19 Numerous previous studies have recognized the important role of n3 and n6 LCPUFAs as key modulators of retinal development, 11,12,20,21 and in the onset and progression of retinal diseases. For example, a case—control study from the Age-Related Eye Disease Study research group has demonstrated that total dietary n3 LCPUFA intake, including DHA(22:6n3), was inversely associated with neovascular age-related macular degeneration, whereas the intake of n6 LCPUFAs, including ARA(20:4n6), was directly associated with the prevalence of the disease. 11 Another ocular disease, open angle glaucoma, has also been shown to be inversely associated with n3 polyunsaturated fatty acid (PUFA) levels. When compared with their healthy siblings, glaucoma patients had reduced eicosapentaenoic acid and DHA(22:6n3) in red blood cell phospholipids and triglycerides. 22 Low levels of DHA(22:6n3) in the erythrocytes of X-linked—inherited Retinitis Pigmentosa patients have been shown to be negatively associated with the severity of the disease. 23 –25 A recent study has demonstrated that the DHA(22:6n3) content of certain GPCho, GPEtn, and glycerophosphatidylserine (GPSer) lipid molecular species were significantly lower in the retina of a rat model of Smith—Lemli—Opitz syndrome, relative to controls, and that these changes occurred in the absence of n3 fatty acid deficiency in plasma or liver. 9 DHA(22:6n3) deficiency has also been shown to result in a decrease in visual acuity during infant development, 20,21 whereas a recent in vivo study has revealed that an increase in dietary DHA(22:6n3) in take can be protective against neovascularization in animal models of oxygen-induced retinopathy of prematurity. 12
Early stage diabetic retinopathy has been recognized as a low-grade chronic inflammatory disease. 26 –31 Using a well-established human retinal endothelial cell-culture system, the primary cell type associated with diabetic retinopathy, it has recently been demonstrated that the n6 PUFAs linoleic acid(18:2n6) and ARA(20:4n6) induced inflammatory adhesion molecule expression and leukocyte adhesion, 32 whereas the n3 PUFA DHA22:6n3 exhibited an anti-inflammatory effect by inhibiting cytokine-induced Nuclear Factor κB activation and nuclear translocation, as well as adhesion molecule expression. 33,34
These studies clearly demonstrate the important role of lipids in retinal health and disease. However, there is surprisingly little information available that quantitatively describes the changes in global lipid profiles, or the specific molecular lipid species that undergo changes in abundance, upon development of diabetic complications in the retina. 35 –37 More importantly, there have been no studies carried out to date to correlate the lipid profile changes in the end organs of diabetic complications with those occurring in the blood cell or plasma of these subjects.
The limitations of techniques traditionally used for lipid analysis (e.g., thin-layer chromatography and gas chromatography) have generally precluded comprehensive lipid analysis from the limited amount of material that can typically be obtained from either post-mortem human retina samples or the retinas obtained from animal models of the disease (e.g., rats and mice). However, the development of electrospray ionization (ESI) and matrix-assisted laser desorption/ionization techniques, 38 –46 coupled with the use of high-resolution MS analysis, 47 –49 or tandem MS methods using product ion scan or selective precursor ion (PI) and neutral loss (NL) scan mode analysis strategies, 39 –43,50 –52 have enabled the application of “shotgun” lipidomics approaches for rapid and sensitive monitoring of the molecular compositions and abundances of individual lipid species in complex lipid extracts obtained from limited quantities of sample tissue and with minimal sample preparation. The application of selective PI scan and NL scan MS/MS methods, based on detection of the characteristic product ions formed via cleavage of either a particular lipid head group or fatty acyl chain esterified to the glycerol backbone, from which information regarding the identity and structure of the lipid may be elucidated, have been particularly attractive for the rapid identification and characterization of multiple isobaric lipid species that may be present at a given m/z value. As the level of background chemical noise is significantly reduced in PI and NL scan MS/MS spectra compared with that in a conventional mass spectrum, these methods are also attractive for use in the rapid identification of low abundance lipid species, such as ceramides, cholesteryl esters, mono-, di-, and tri-acylglycerols, or modified lipid species, such as Amadori-glycerophosphatidylethanolamine (Amadori-GPEtn) or glycerophosphatidylinositol (GPIns) mono-, bis-, or trisphosphate, that may often be present at or below the level of chemical noise in the mass spectra.
Quantitation of lipidomic data has typically been achieved by ratiometric comparison of the abundance of lipid ions of interest against that of a known exogenous lipid species added to the sample (i.e., an “internal standard”), after isotopic correction. Most of these approaches have entailed the use of synthetic exogenous lipid standards representative of a particular lipid class of interest. The synthetic lipids may be added during 41,53,54 or after 40,43,55 lipid extraction, and typically all lipid molecular species of a given class are quantified against a single synthetic internal standard of the same lipid class. Although relatively straightforward, this approach does not take into account potential differences in ionization efficiency of lipids of differing acyl chain lengths and degree of unsaturation, which can be pronounced in samples with a high total lipid concentration, 56,57 or correct for different collision-induced dissociation (CID—MS/MS fragmentation efficiencies as a function of PI mass under the constant collision energy conditions typically used in PI and NL scan MS/MS methods. The correction for differences in ionization or dissociation efficiencies across the molecular species of a given lipid class may be performed by inclusion of several internal standards per lipid class, thereby covering a wide range of fatty acyl total carbons and total double bonds, or through normalization to multiple external calibration curves. 56,58,59 The use of multiple internal standards consisting of stable isotope-labeled lipid species has also been demonstrated to provide accurate quantitation of lipids with a high degree of variability in the number of total carbons and total double bonds. 60 However, the use of this strategy may not be feasible for analyzing large numbers of different molecular species across diverse lipid classes, as an untenable number of internal standards would be required.
In contrast to internal standard-dependent methods of lipidome quantification, the feasibility of performing quantitative analysis based on a statistical comparative analysis of lipid ion intensities and relative abundances from lipid extracts of experimental treatments relative to those obtained from control samples, in the absence of any internal standard, has also been demonstrated. 61 Such “internal standard free” approaches are critical when an internal standard for a lipid class of interest, such as modified lipids, is not readily (i.e., commercially) available. In proteomics-based quantification, numerous studies in recent years have also shown that “internal standard free” or “label-free” methods, involving quantification of relative protein abundances based on PI area intensity measurements using high-resolution MS or by “spectral counting” using the number of spectra identified for a given protein from multidimensional LC—MS/MS analyses of different biological samples, can provide comparable results to stable isotope labeling methods for abundant proteins. 62,63
Materials and Methods
Materials
All solvents used were HPLC grade. Methanol (MeOH), water, sodium chloride, and common laboratory reagents were purchased from J.T. Baker (Phillipsburg, NJ). The Ammonium hydroxide (NH4OH) and chloroform (CHCl3) were from EMD Chemicals (Gibbstown, NJ). 2-Propanol was from Fisher Scientific (Pittsburgh, PA). Lipid standards were obtained from Avanti Polar Lipids (Alabaster, AL).
Animals
All procedures for the use and care of animals for laboratory research were approved by the All University Committee for Animal Use and Care at Michigan State University. Male Wistar rats were maintained on Purified Rodent Diet #110900 (Dyets, Bethlehem, PA) and water ad libitum. Rats weighing 237–283 g were made diabetic with a single intraperitoneal injection of 65 mg streptozotocin (STZ) per kg body weight. Age-matched nondiabetic control rats received a single intraperitoneal injection of citrate buffer vehicle (pH 4.5). Body weight gains and blood glucose for the control and STZ diabetic groups were measured biweekly. Diabetes was confirmed by blood glucose higher than 15 mM and a decrease in the body weight gain. Insulin injections were given daily at 0–3 units NPH insulin, beginning 2 weeks after STZ injection, and were adjusted to achieve slow weight gain while still allowing hyperglycemia in the 20–25 mM range.
At either 6 or 36 weeks post-STZ treatment, the rats were sacrificed under anesthesia (isoflurane/Vapomatic). The chest cavity was opened to expose the heart, and 5–10 mL of rat blood was collected by heart puncture into EDTA-containing tubes. The right atrium was carefully snapped to provide drainage and the animals expired from exsanguination.
To obtain retinas, eyes were enucleated and rinsed three times in ice-cold phosphate buffered saline, opened by a circumferential incision just below the ora serrata, and the anterior segment and vitreous were discarded. With the aid of a dissecting microscope, the retina was gently lifted off the eyecup using an eye spatula, weighed, placed in a precleaned glass vial, and snap frozen in liquid nitrogen. To obtain erythrocytes, whole blood was centrifuged at 1300 × g in a swinging bucket rotor. Plasma and buffy coat were removed, and packed erythrocytes were snap frozen in liquid nitrogen. Retinas and erythrocytes were stored in the dark at −80 °C until lipid extraction.
Retina Tissue Lipid Extraction
Lipids were extracted from frozen rat retinas as previously described, 64 using a modified Folch method. Lipid extracts were resuspended in 50 μL/mg tissue of 2-propanol: MeOH: CHCl3 (4:2:1v/v/v) and stored under nitrogen in glass vials in the dark at −80 °C until further use.
Erythrocyte Lipid Extraction
Erythrocyte lipids were extracted using a modified Rose and Oklander method. 65 A 100 mg of packed erythrocytes were lysed on ice for 15 min in 500 μL of HPLC-grade water, then combined with 6.8 mL of 80% 2-propanol, vortexed, and incubated for 1 h on ice with occasional mixing. A 3.2 mL of 100% CHCl3 was added, and the mixture was incubated for 1 additional hour on ice with occasional mixing. Phases were separated by centrifuging samples for 30 min at 2000 × g in a swinging bucket rotor. The lower phase was collected, and the remaining aqueous phase was re-extracted as before with 3.2 mL of 100% CHCl3. The lower phases were pooled, dried under nitrogen, and further dried overnight in a speedvac (Thermo Savant, Waltham, MA). Lipid extracts were resuspended in 5 μL/mg cells of 2-propanol:-MeOH:CHCl3 (4:2:1v/v/v) and stored under nitrogen in glass vials in the dark at −80 °C until further use.
Identification and Quantitation of Lipid Molecular Species
Immediately before analysis, aliquots of crude retina or erythrocyte lipid extracts were further diluted 1:20 and 1:50, respectively, in 2-propanol: MeOH: CHCl3 (4:2:1 v/v/v) containing 20 mM NH4OH. Additionally, a mixture of synthetic GPCho and GPEtn lipids was added to the retina and erythrocyte lipid extracts from 36-week STZ diabetic and age-matched nondiabetic rats to serve as internal standards. The final concentrations of the internal standards used in the analysis were GPCho(14:0/14:0) at 1 μM and GPEtn(14:0/14:0) at 0.65 μM.
All samples were centrifuged, then loaded into Whatman Multichem 96-well plates (Fisher Scientific, Pittsburgh, PA) and sealed with Teflon Ultra-Thin Sealing Tape (Analytical Sales and Services, Pompton Plains, NJ). The samples were then introduced to a triple quadrupole (QqQ) mass spectrometer (Thermo Scientific model TSQ Quantum Ultra, San Jose, CA) via a chip-based nano-electrospray ionization (nESI) source (Advion NanoMate, Ithaca, NY) operating in infusion mode using an ESI HD_A chip, a spray voltage of 1.4 kV, a gas pressure of 0.3 psi, and an air gap of 2 μL. The ion transfer tube of the mass spectrometer was maintained at 150 °C. All MS and MS/MS spectra were acquired automatically for 2.5–10 min at a rate of 500 m/z sec−1 by methods created using Xcalibur software (Thermo, San Jose, CA). In MS mode, the Q1 peak width was maintained at 0.5 Da. For NL and PI MS/MS scans, the peak widths of both Q1 and Q3 were maintained at 0.5 Da. For product ion scan mode MS/MS experiments, Q1 and Q3 were operated with peak widths of 1.0 Da. The Q2 collision gas pressure was set at 0.5 mtorr. Collision energies were individually optimized for each NL, PI, or product ion scan mode MS/MS experiment of interest using commercially available lipid standards whenever possible. GPCho and GPEtn lipid ions were identified as their [M + H]+ ions by positive ion mode CID—MS/MS by PI scanning for m/z 184 or by scanning for the NL of 141 m/z, 41 respectively. As GPEtn ions were detected as both [M + H]+ and [M + Na]+ ions, the presence of sodiated GPEtn ions at particular m/z were determined by PI scanning for the sodiated GPEtn-specific ion at m/z 164, as previously described. 64 Glycated (Amadori) GPEtn lipid ions were identified as their [M + H]+ ions by positive ion mode CID-MS/MS by scanning for the NL of 303 m/z. 66 GPSer and GPIns molecular species were identified as their [M-H]− ions by negative ion mode CID—MS/MS, by scanning for the NL of 87 m/z, or by PI scanning for m/z 241, 41 respectively. Characterization of the fatty acid constituents of identified lipids was achieved by CID—MS/MS product ion scans at the specific m/z values of the [M—H]−, [M + Cl]−, or [M + CH3OCO2]− PIs of identified lipids observed in negative ion mode, or by negative ion mode PI scan
CID—MS/MS experiments to selectively monitor for specific deprotonated fatty acid anions. A five-point Gaussian smooth was applied to all spectra before data analysis.
Quantitative comparison of differences in lipid ion abundances between control and diabetic retina or erythrocyte samples was performed by two different methods. In the “internal standard free” method, GPCho, GPEtn, GPSer, and GPIns lipids identified from retina and erythrocyte extracts from age-matched control and diabetic rats, 6 weeks post-STZ treatment, and GPCho and GPEtn lipids identified from retina and erythrocyte extracts from age-matched control and diabetic rats, 36 weeks post-STZ treatment were quantified by determining peak areas using the Lipid Mass Spectrum Analysis (LIMSA) v.1.0 software peak model fit algorithm. 67 The LIMSA software was used in conjunction with a user-defined database of hypothetical lipid compounds for automated peak finding and correction for 13C isotope effects. Where applicable, peak areas of GPEtn [M + H]+ and [M + Na]+ ions of the same lipid molecular species were summed to account for possible variability in the amount of sodium present across samples.
In the “internal standard” method, GPCho and GPEtn lipids identified from retina and erythrocyte extracts from age-matched control and diabetic rats, 36 weeks post-STZ treatment were quantitated ratiometrically by comparison with the peak area of a synthetic lipid internal standard of the lipid class of interest. The LIMSA software peak model fit algorithm was used as described above for peak finding and isotope correction, followed by automated comparison of each isotopically corrected peak area with that of the appropriate internal standard to arrive at an “absolute” value for each identified lipid species. Quantitated values assigned to GPEtn molecular species were additionally corrected for the presence of GPEtn [M + Na]+ ions, when present, as described above.
For both methods, mass spectra of each lipid extract were initially acquired at a range of different dilutions to determine the dilution range at which linearity in the response of specific lipids was observed, and to ensure that the ratio of specific lipid ion abundances compared with other lipids within the mixture, or compared with an internal standard, remained constant. However, as no attempts were made to quantitatively correct for different ESI responses of individual lipids due to concentration, acyl chain length, or degree of unsaturation, 56 or to quantitatively correct for different CID—MS/MS fragmentation efficiencies as a function of PI mass, we report here only the relative change in the abundance of the experimentally observed lipid between the control and diabetic sample groups, and not the absolute concentrations.
Measurement of variability introduced by the sample-handling steps after lipid extraction was obtained by performing PI m/z 184 and NL m/z 87 CID—MS/MS scans on triplicate dilutions of a given lipid extract from rat retinas at the 6-week time point, with subsequent comparison of quantitated peak areas across the triplicate dilutions. Measurement of variability introduced by the instrumentation (i.e., the ion source and mass spectrometer) was obtained by analyzing individual sample dilutions in triplicate as described above.
Statistical Analysis
Data are presented as mean ± standard deviation (SD). Fold change comparisons in the GPCho, GPEtn, GPSer, and GPIns lipid ion abundances between diabetic and control retina or erythrocyte extracts were considered statistically significant if the fold change exceeded ±1.645 SDs (90% confidence interval). Student's t-test with two-tailed distribution, two-sample unequal variance was used to evaluate differences between diabetic and control animals for individual lipid molecular species of Amadori-GPEtn, with P < 0.05 considered statistically significant.
Results and Discussion
Analyses of crude lipid extracts isolated from the whole retina and erythrocytes of age-matched control and type 1 diabetic male Wistar rats, 6 or 36 weeks after induction of diabetes with STZ, were performed by introduction of the extracts to a triple quadrupole mass spectrometer via infusion using a chip-based nESI source, followed by automated MS and MS/MS analysis in both positive and negative ion modes to identify and quantify GPCho, GPEtn, GPSer, and GPIns lipids. The use of an animal model, such as the rat, for studying changes in global retina lipid profiles as a function of the onset and progression of disease is attractive for several reasons, including the ability to control or systematically evaluate the effect of a number of variables, such as genetic background, environment, age, and diet, that are known to alter the presence and abundance of particular lipid species at any given time.
Analysis of GPCho Lipids Extracted from Control and Diabetic Retina and Erythrocytes, 6 Weeks Post-STZ Treatment
Representative mass spectra, obtained by using a PI scan mode CID—MS/MS experiment in positive ion mode to identify the [M + H]+ PIs of GPCho lipids in whole retina and erythrocytes of age-matched control and type 1 diabetic male Wistar rats, 6 weeks after treatment with STZ, via detection of the characteristic phosphocholine product ion at m/z 184, are shown in Figure 1. The complementary information provided from the GPCho lipid class specific PI scan, as well as fatty acyl group specific PI MS/MS scans or product ion MS/MS scan experiments of the [M + Cl]− or [M + CH3OCO2]− PIs in negative ion mode, 68 were used to fully elucidate the identity of the head group, as well as the identities of the fatty acyl chains (number of total carbons and double bonds), within the lipid of interest (data not shown). The most abundant GPCho lipid molecular species within the control rat retina (Fig. 1A) was found to contain an n3 polyunsaturated DHA22:6 fatty acid (i.e., GPCho(18:0/22:6), m/z 834.4). Other abundant DHA22:6n3 containing GPCho lipids were also observed, including GPCho(16:0/22:6) at m/z 806.4, a 44:12 GPCho species containing DHA22:6n3 fatty acids at both the sn1 and sn2 positions of the lipid glycerol backbone (GPCho(22:6/22:6), m/z 878.4), and very long-chain fatty acid-containing GPCho lipids (GPCho(32:6/22:6), m/z 1018.6 and GPCho(34:6/22:6), m/z 1046.6). A variety of n6 polyunsaturated linoleic acid(18:2n6) and ARA(20:4n6) containing GPCho lipids were also identified, including GPCho(16:0/18:2) at m/z 758.4, GPCho(18:0/18:2) at m/z 786.4, GPCho(16:0/20:4) at m/z 782.4, and GPCho(18:0/20:4) at m/z 810.4. Finally, several abundant GPCho lipids containing saturated palmitic acid(16:0) and stearic acid(18:0), and the n9 monounsaturated oleic acid(18:1) were observed, including GPCho(16:0/16:0) at m/z 734.4, GPCho(16:0/18:1) at m/z 760.4, and GPCho(18:0/18:1) at m/z 788.4.
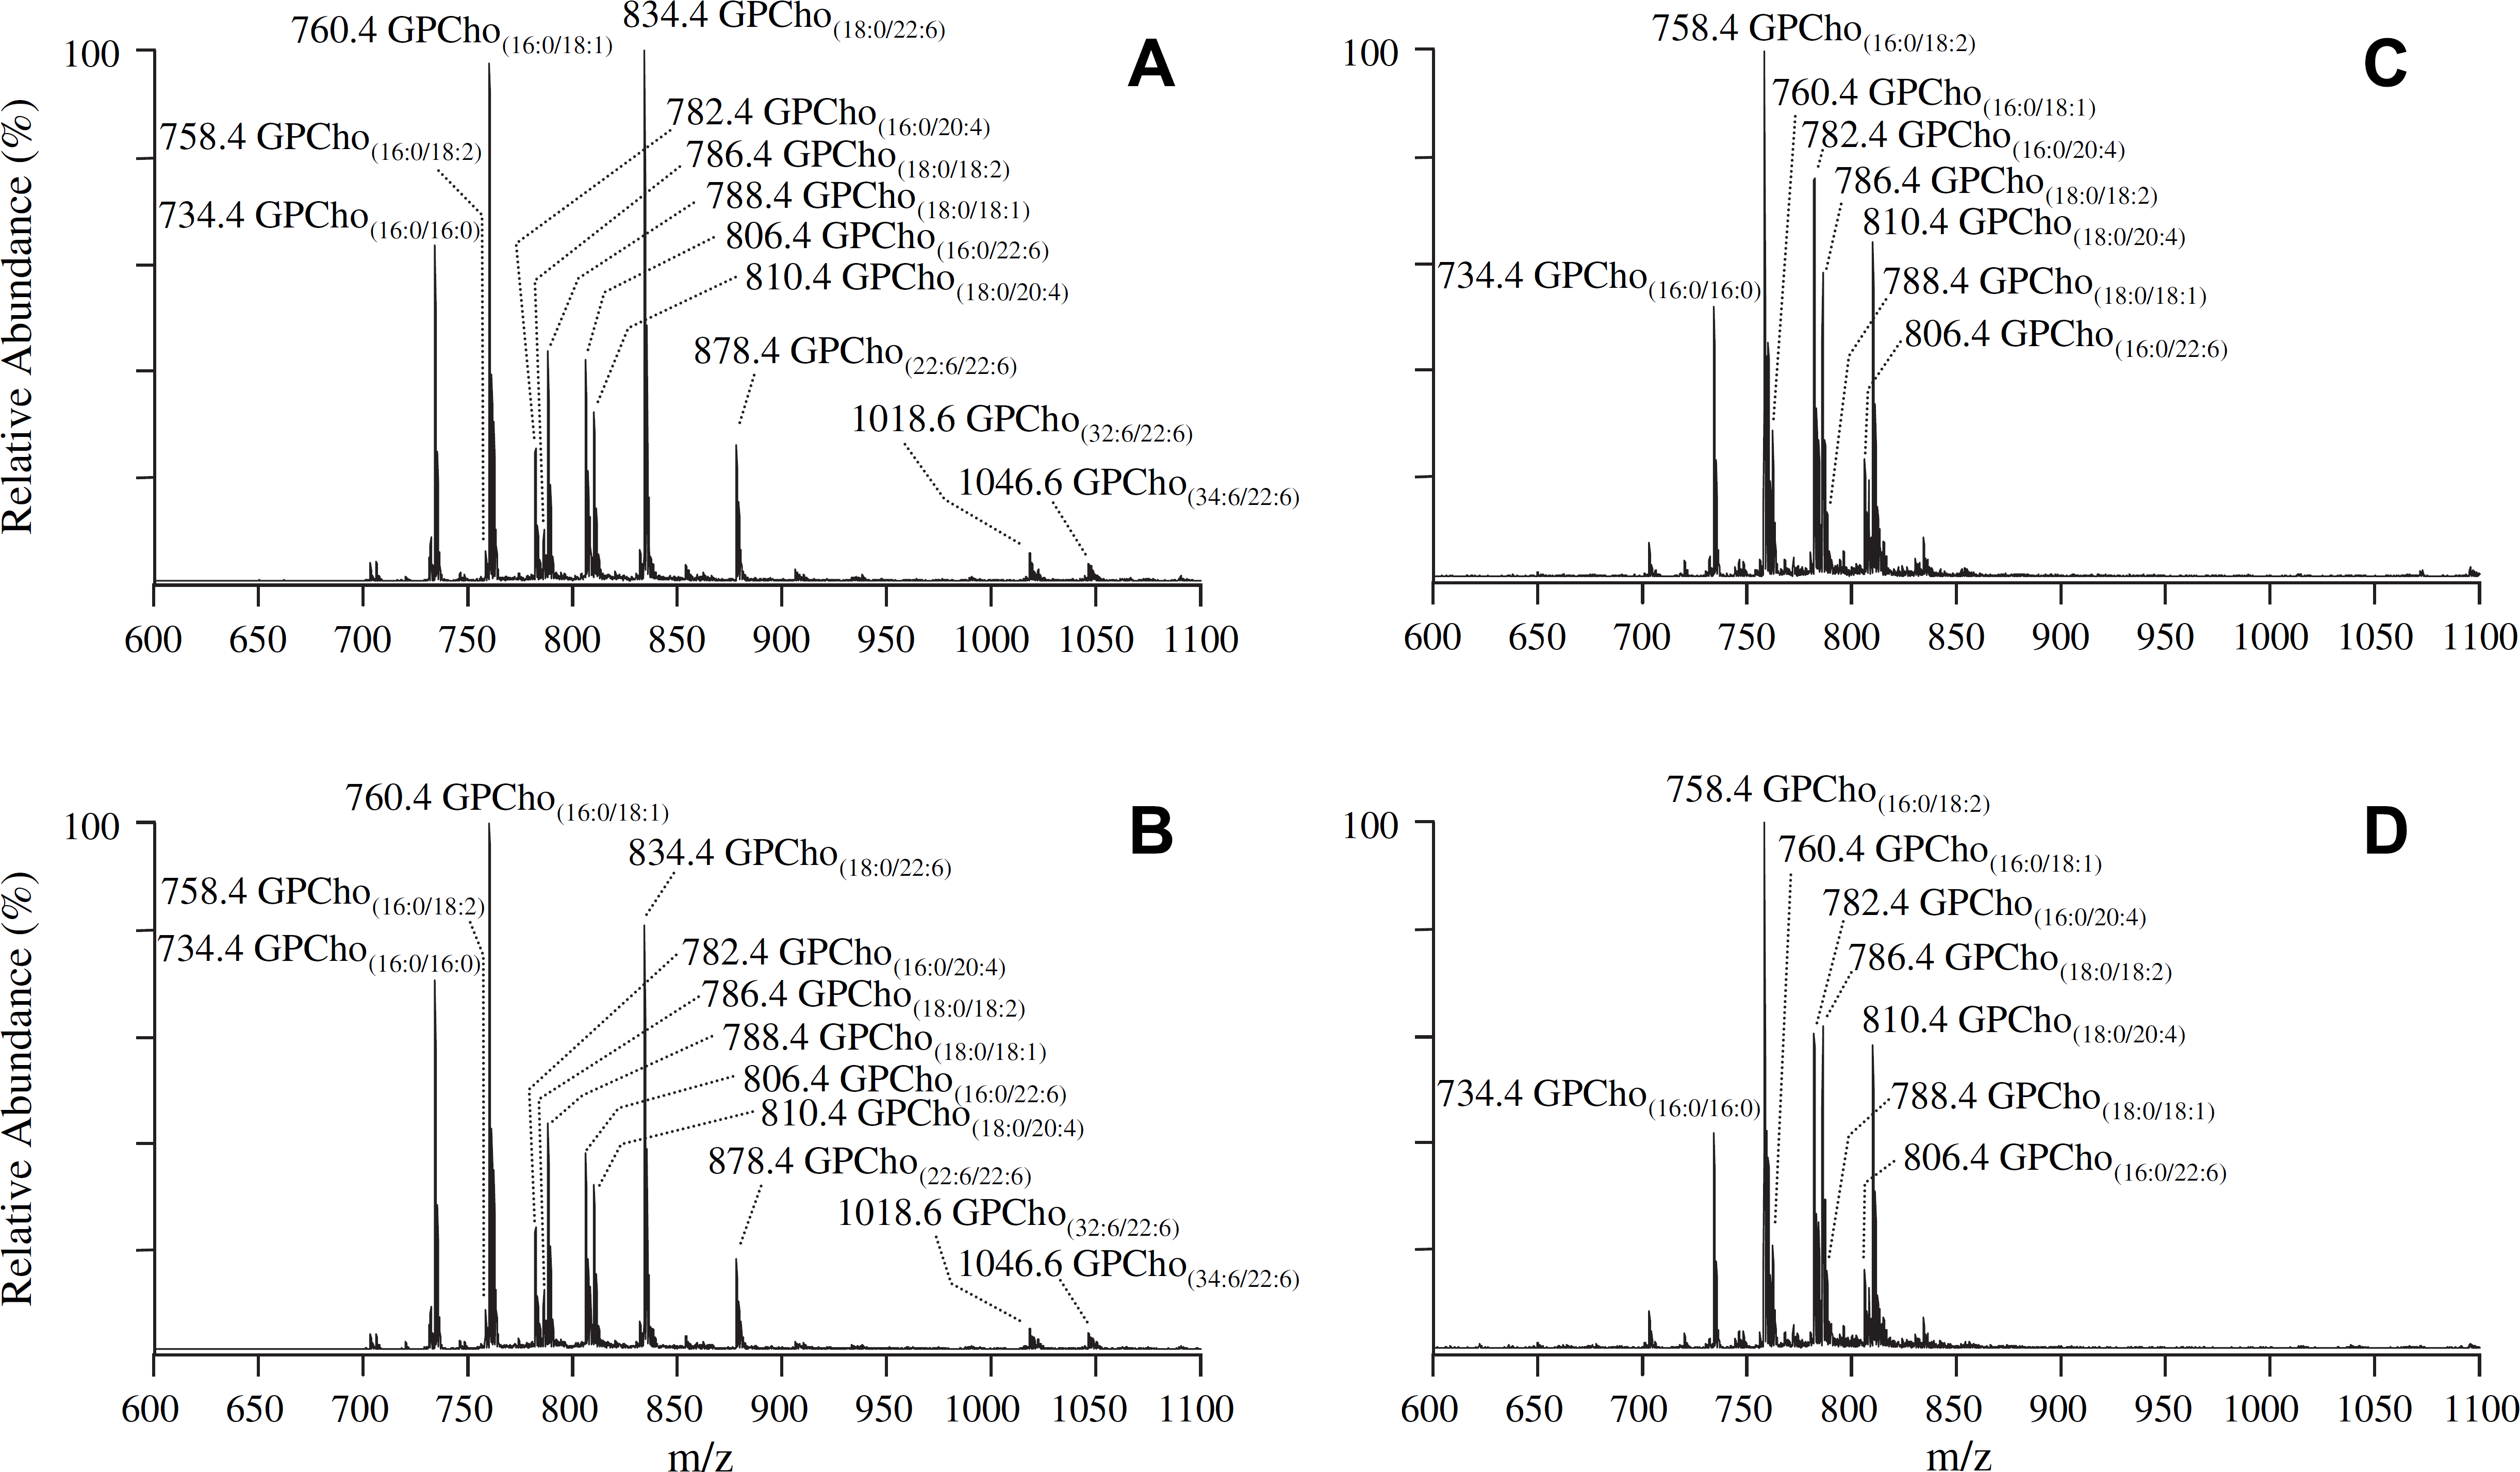
Positive ion mode electrospray ionization (ESI)—MS/MS analysis ofglycerophosphocholine (GPCho) lipids isolated from age-matched control and diabetic rat retina and erythrocyte samples, 6 weeks after treatment with streptozotocin. (A) Control retina, (B) diabetic retina, (C) control erythrocytes, and (D) diabetic erythrocytes. Spectra were obtained by precursor ion (PI) scanning for the characteristic phosphocholine ion at m/z 184 to identify [M + H]+ Pls. Selected regions from m/z 600 to 1100 of representative spectra, obtained from control and diabetic lipid extracts, containing the major GPCho lipids, are shown.
Analysis of lipid extracts from three separate control rat retinas resulted in essentially identical spectra to those shown in Figure 1A, with percent standard deviations (% SD) ranging from 5% to 20% (with an average % SD of 11%), indicative of the minimal biological variability between these animals. This was expected given that these samples were obtained from animals with identical genetic backgrounds that were maintained under essentially identical conditions. However, to evaluate the variability introduced by the sample-handling steps after initial lipid extraction, as well as the run-to-run variability associated with the MS analysis, a series of experiments were also performed by triplicate dilution and analysis of a single control retina lipid extract, and by triplicate analysis of a single diluted control retina lipid extract. The % SDs determined from these experiments, ranging from 6% to 14% with an average of 9% for the former, and from 4% to 12% with an average of 8% for the later, were both smaller than the biological variability, indicating that the analysis methodology would be sufficiently reproducible and stable to enable quantitative determination of differences in the retina between control and diabetic sample groups (see below).
Although the molecular species identified from the diabetic rat retina (Fig. 1B) were all consistent with those in the control retina, the relative abundances of individual lipids were observed to vary between control and diabetic states (compare Fig. 1A, B, respectively, and Fig. 2A). Changes in the relative abundances of individual lipids between control and diabetic erythrocyte lipid extracts were also observed (compare Fig. 1C, D, respectively, and Fig. 2B). Note, however, that the composition and abundances of the GPCho lipids from the erythrocyte extracts were quite different from those in the retina.
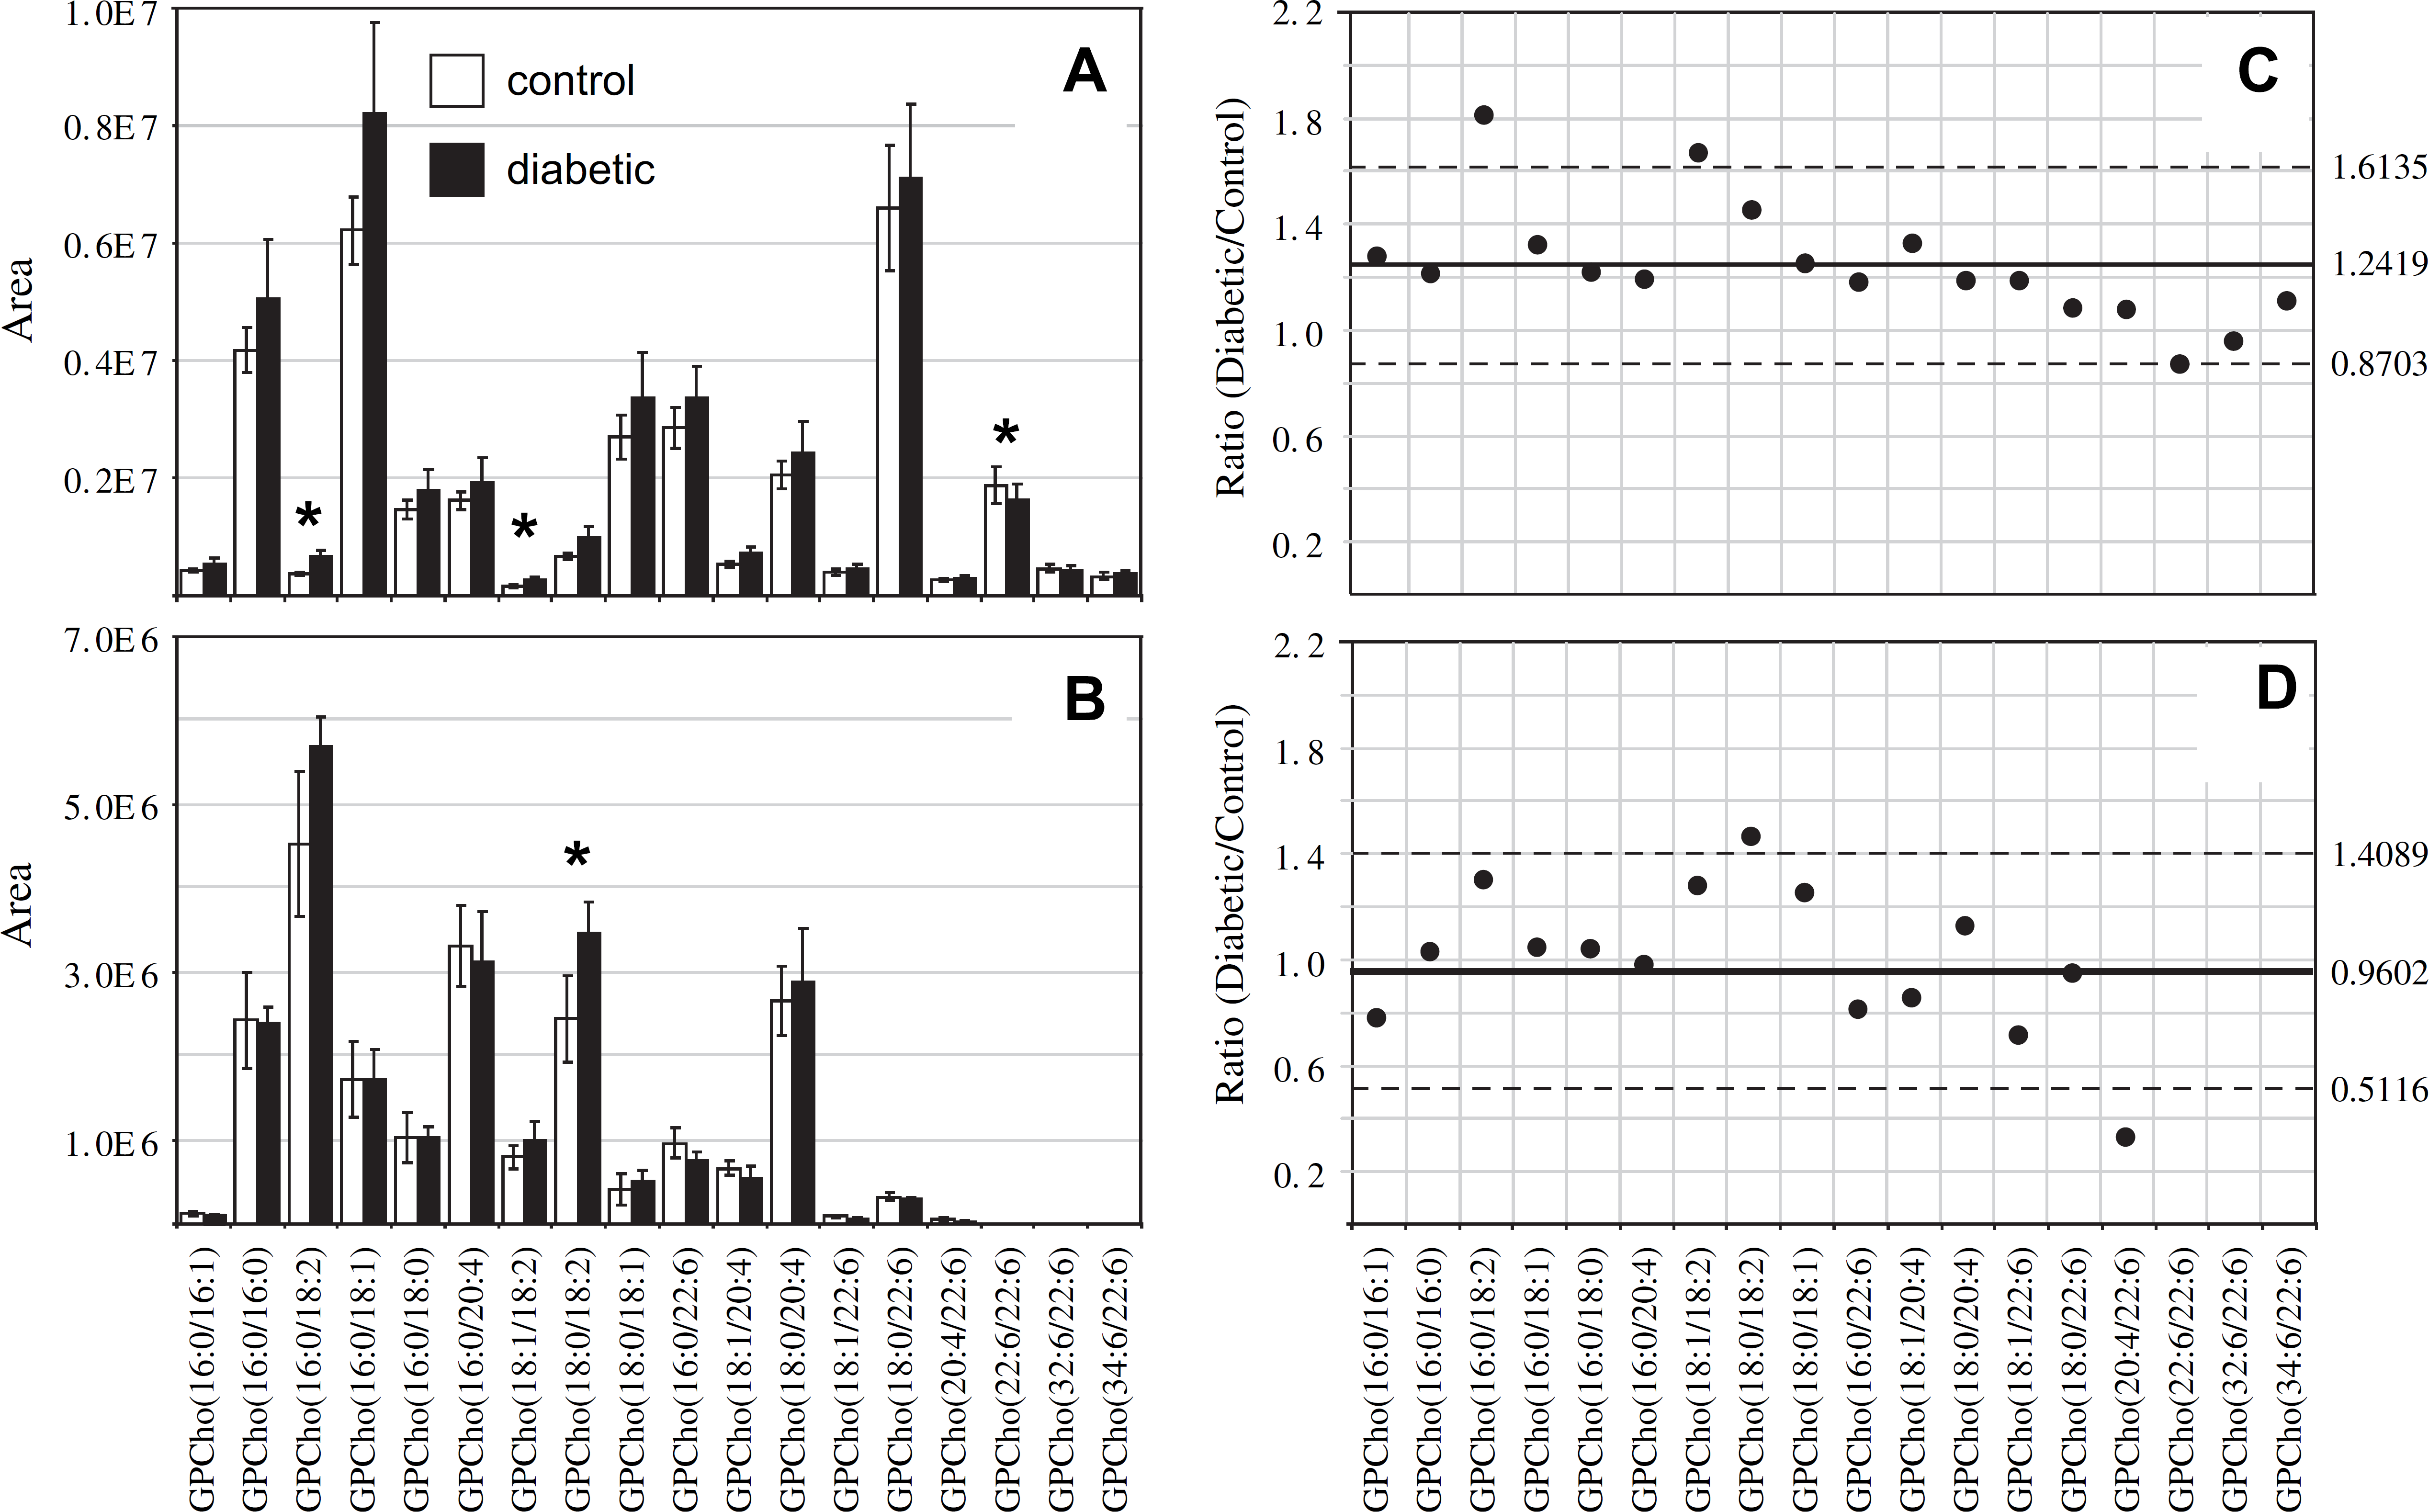
Ratiometric analysis of changes in glycerophosphocholine (GPCho) lipid ion abundances between age-matched control and diabetic rat retina and erythrocyte samples, 6 weeks after treatment with streptozotocin. Data values are displayed as mean ± standard deviation (SD) from n = 3 control and n = 4 diabetic rats. (A) Comparison of age-matched control and diabetic rat retina from Figure 1A, B. (B) Comparison of age-matched control and diabetic rat erythrocytes from Figure 1C, D. (C) Visualization of the fold change (expressed as the ratio of diabetic/control lipid area intensity) observed for individual GPCho lipid ions between age-matched control and diabetic rat retina from panel A. (D) Visualization of the fold change (expressed as the ratio of diabetic/control lipid area intensity) observed for individual GPCho lipid ions between age-matched control and diabetic rat erythrocytes from panel B. The solid line indicates the mean of the measurements, whereas the dashed lines indicate ±1.645 SD (i.e., 90% confidence intervals).
Interestingly, the average GPCho lipid ion abundances in the diabetic retina lipid extracts were found to be approximately 25% higher than the age-matched control extracts (average ratio of diabetic/control of 1.2419 with a SD of ±0.2259) (Fig. 2C). This increase is likely due to diabetes-induced upregulation of lipogenic gene expression, consistent with that previously reported by Brucklacher et al. 69 Notably, the average abundances of two n6 polyunsaturated linoleic acid-containing GPCho lipids were significantly higher in the diabetic retina compared with the control retina (i.e., GPCho(16:0/18:2) with a 1.81-fold change and GPCho(18:1/18:2) with a 1.67-fold change), where significance was defined as being outside the 90% confidence interval defined by ±1.645 SD, whereas one n3 polyunsaturated DHA22:6n3 containing lipid (GPCho(22:6/22:6)) was found to undergo a significant decrease between diabetic and control retina samples, with a diabetic/control ratio of 0.86.
Comparison of the erythrocyte extract GPCho lipid ion abundances between age-matched control and diabetic rats, 6 weeks after STZ treatment, determined that the average GPCho ion abundances remained essentially constant (Fig. 2D). However, the level of one n6 PUFA containing GPCho lipid (GPCho(18:0/18:2)) was observed to give rise to a significant 1.41-fold increase, whereas a very low abundance GPCho(20:4/22:6) lipid was found to be lower in the diabetic erythrocyte (ratio of diabetic/control of 0.31). However, given the low abundance of this lipid in both control and diabetic extracts, we have not assigned any significance to this change in abundance. Overall, these results are consistent with previous studies that have found that the values of n6 PUFAs, linoleic acid(18:2n6), and ARA(20:4n6) in the plasma and erythrocyte membrane lipids in diabetic children and diabetic young adults versus age-matched healthy controls were significantly higher in diabetic subjects than in controls, whereas the n3 PUFA DHA22:6n3 was significantly lower. 70,71 Furthermore, the trends observed here are generally consistent between the GPCho lipids observed in the retina and erythrocyte samples, with an increase in the relative abundance of lipids containing oleic acid(18:1n9) and linoleic acid(18:2n6) fatty acids, and a decrease in lipids containing DHA22:6n3 fatty acids.
Analysis of GPEtn Lipids Extracted from Control and Diabetic Retina and Erythrocytes, 6 Weeks Post-STZ Treatment
The identification and quantitative analysis of GPEtn lipids by CID—MS/MS represents a particular challenge. Both protonated ([M + H]+) and sodiated ([M + Na]+) GPEtn PIs are typically observed in a mass spectrum of a crude lipid extract, and sodiated GPEtn PIs may overlap at the same m/z value with protonated GPEtn precursors (e.g., [GPEtn(18:0/20:4) + Na]+ at m/z788.5195 and [GPEtn(18:2/22:6) + H]+ at m/z 788.5219). As both protonated and sodiated GPEtn PIs give rise to the NL of phosphoethanolamine (141 Da) upon CID—MS/MS, 42,72 a NL m/z 141 scan cannot be used to differentiate between the presence of these two species. However, we have recently reported that the dissociation of sodiated ([M + Na]+) GPEtn PIs also give rise to a phosphoethanolamine + Na+ product ion at m/z 164, allowing the presence of the sodiated PI to be readily determined by using a PI m/z 164 scan. 64 Thus, in the analysis method used here, both NL m/z 141 and PIm/z 164 scans were used, as well as fatty acyl group specific PI scans in negative ion mode, to confirm the presence and identity of GPEtn lipids at specific m/z values. Only the identity of the most abundant GPEtn lipid that was found at a specific m/z value is reported.
The most abundant GPEtn lipid molecular species identified from the age-matched control and diabetic rat retinas, 6 weeks after STZ treatment, were found to contain DHA(22:6n3) and ARA(20:4n6) (i.e., GPEtn(18:0/22:6) at m/z 792.3, GPEtn(16:0/22:6) at m/z 764.5, GPEtn(22:6/22:6) at m/z 836.3, and GPEtn(18:0/20:4) at m/z 768.5) (Fig. 3A), whereas those in the control and diabetic rat erythrocytes were found to contain linoleic acid(18:2n6) and ARA(20:4n6) (i.e., GPEtn(16:0/18:2) at m/z 716.5, GPEtn(16:0/20:4) at m/z 740.5, GPEtn(18:1/18:2) at m/z 742.5, GPEtn(18:0/18:2) at m/z 744.5, GPEtn(18:1/20:4) at m/z 766.5, and GPEtn(18:0/20:4) at m/z 768.5) (Fig. 3B). All of these are consistent with the acyl chain compositions found in the GPCho lipids described above. Also similar to that observed from the GPCho lipid analysis, an approximately 33% increase in the average GPEtn lipid ion abundance was observed for the diabetic rat retina extracts compared with the control extracts (Fig. 3C). A decrease in the abundance of the GPEtn(22:6/22:6) lipid was observed in the diabetic rat retina extracts (with a diabetic/control ratio of 0.77), consistent with the change in the abundance of the GPCho(22:6/22:6) lipid described above. However, the magnitude of this change was not found to be significant at this time. An increase in the abundance of a lipid identified as GPEtn(18:0/22:5), containing docosapentaenoic acid(22:5n3), was observed between diabetic and control retina extracts. However, as this lipid was very low in abundance, and could potentially overlap with the M + 2 isotope peak from the highly abundant GPEtn(18:0/22:6) lipid, we have not assigned any significance to this change.
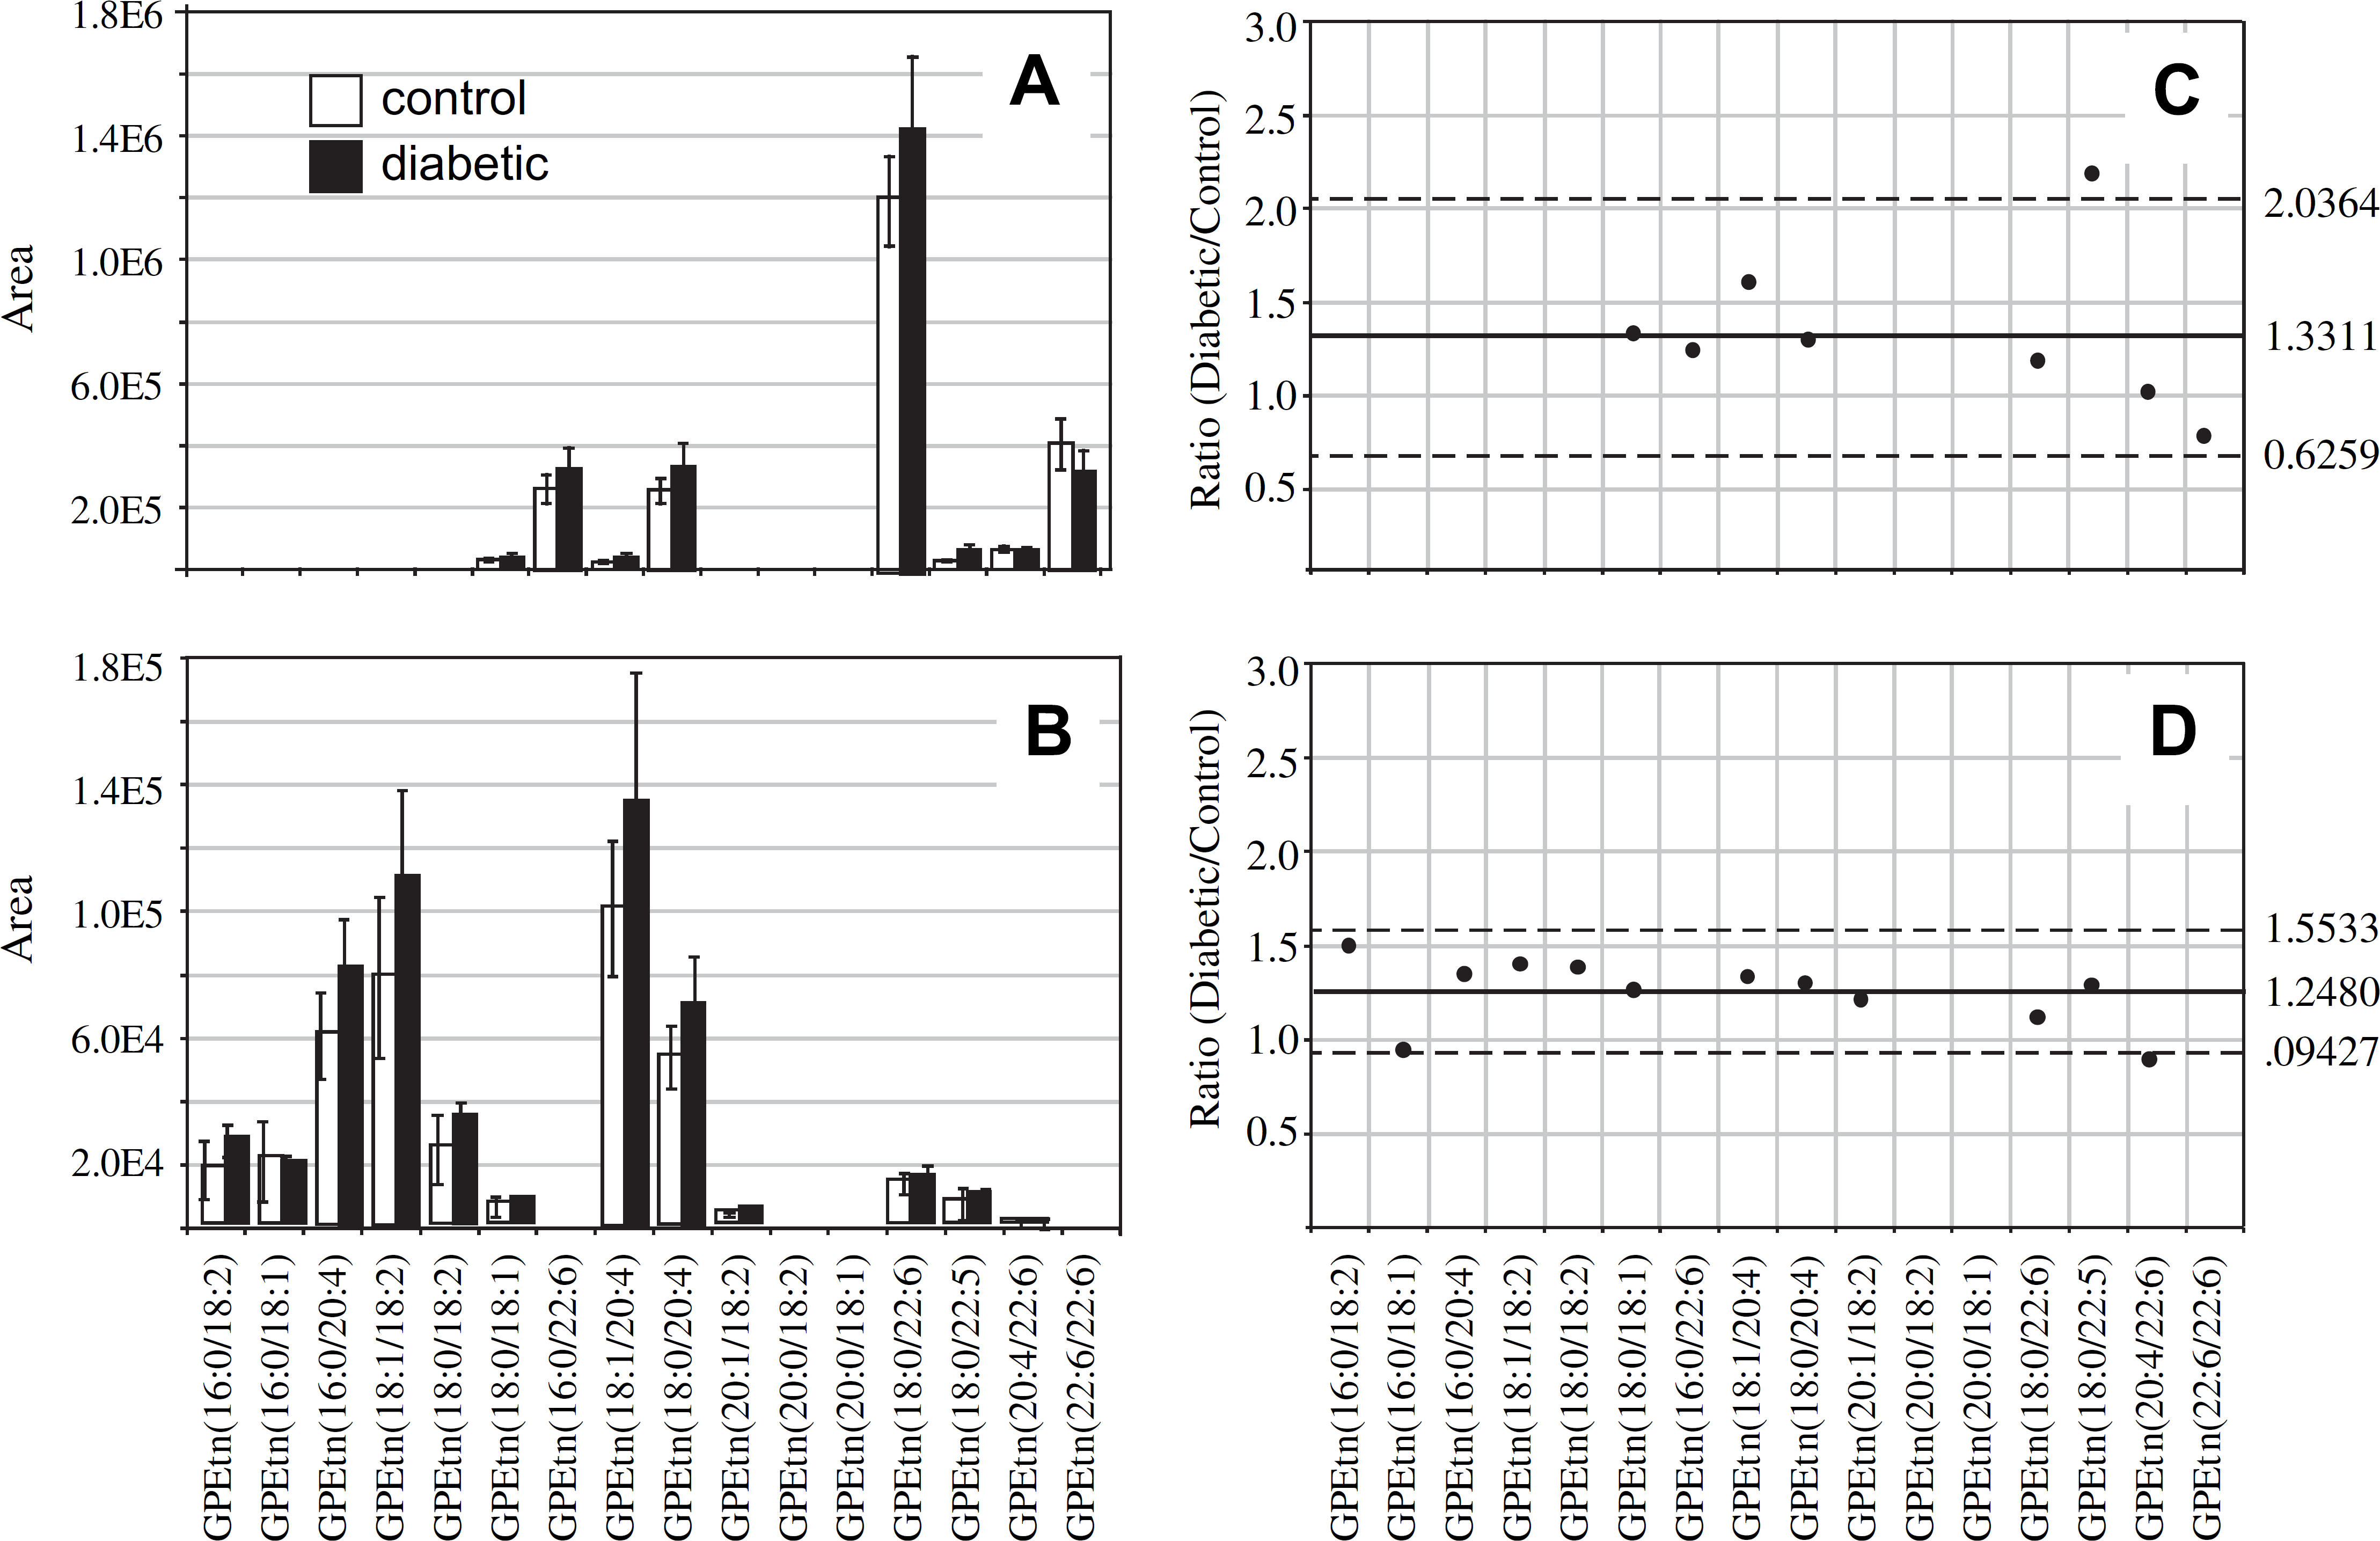
Ratiometric analysis of changes in glycerophosphoethanolamine (GPEtn) lipid ion abundances between age-matched control and diabetic rat retina and erythrocyte samples, 6 weeks after treatment with streptozotocin. Data were obtained by positive ion mode electrospray ionization (ESI)—MS/MS analysis, via scanning for the characteristic neutral loss of phosphoethanolamine (m/z 141) to identify [M + H]+ or [M + Na]+ precursor ions. Data values are displayed as mean ± standard deviation (SD) from n = 3 control and n = 4 diabetic rats. (A) Comparison of age-matched control and diabetic rat retina. (B) Comparison of age-matched control and diabetic rat erythrocytes. (C) Visualization of the fold change (expressed as the ratio of diabetic/control lipid area intensity) observed for individual GPEtn lipid ions between age-matched control and diabetic rat retina from panel A. (D) Visualization of the fold change (expressed as the ratio of diabetic/control lipid area intensity) observed for individual GPEtn lipid ions between age-matched control and diabetic rat erythrocytes from panel B. The solid line indicates the mean of the measurements, whereas the dashed lines indicate ±1.645 SD (i.e., 90% confidence intervals).
Comparison of the GPEtn lipid ion abundances determined from the erythrocyte extracts of age-matched control and diabetic rats, 6 weeks after STZ treatment (Fig. 3D), found that the average abundances were approximately 25% higher in the diabetic samples. This is in contrast to the results observed for the GPCho lipids extracted from erythrocytes. However, similar to that determined from the GPCho lipid analysis, the GPEtn(20:4/22:6) lipid was found to be lower in abundance in the diabetic erythrocyte (ratio of diabetic/control of 0.88). Once again however, due to the low abundance of this lipid, we have not assigned any significance to this change. Overall however, the trends observed were generally consistent between the GPEtn and GPCho lipids observed in the retina and erythrocyte samples, that is, an increase in the relative abundance of lipids containing n6 PUFA and a decrease in the relative abundance of those containing n3 PUFA.
Analysis of GPSer and GPIns Lipids Extracted from Control and Diabetic Retina and Erythrocytes, 6 Weeks Post-STZ Treatment
Similar to that found in the GPCho and GPEtn retina lipids, an increase in the average GPSer and GPIns lipid ion abundances were observed between control and diabetic rat retina extracts (1.32- and 1.39-fold change, respectively) (Figs. 4A, C and 5A, C, respectively). The average GPSer lipid ion abundances were observed to remain essentially unchanged between the control and diabetic rat erythrocyte extracts, whereas the average GPIns erythrocyte lipid ion abundance increased (1.34-fold change) (Figs. 4B, D and 5B, D, respectively). With the exception of the low abundance GPSer(18:0/18:2) lipid, that underwent a 1.31-fold increase between the control and diabetic erythrocyte extracts (see Fig. 4B, D), consistent with that observed for the equivalent but more abundant GPCho(18:0/18:2) lipid species (see Fig. 2B, D), none of the GPSer or GPIns lipids in either the retina or erythrocyte extracts were found to undergo a significant change between control and diabetic states.
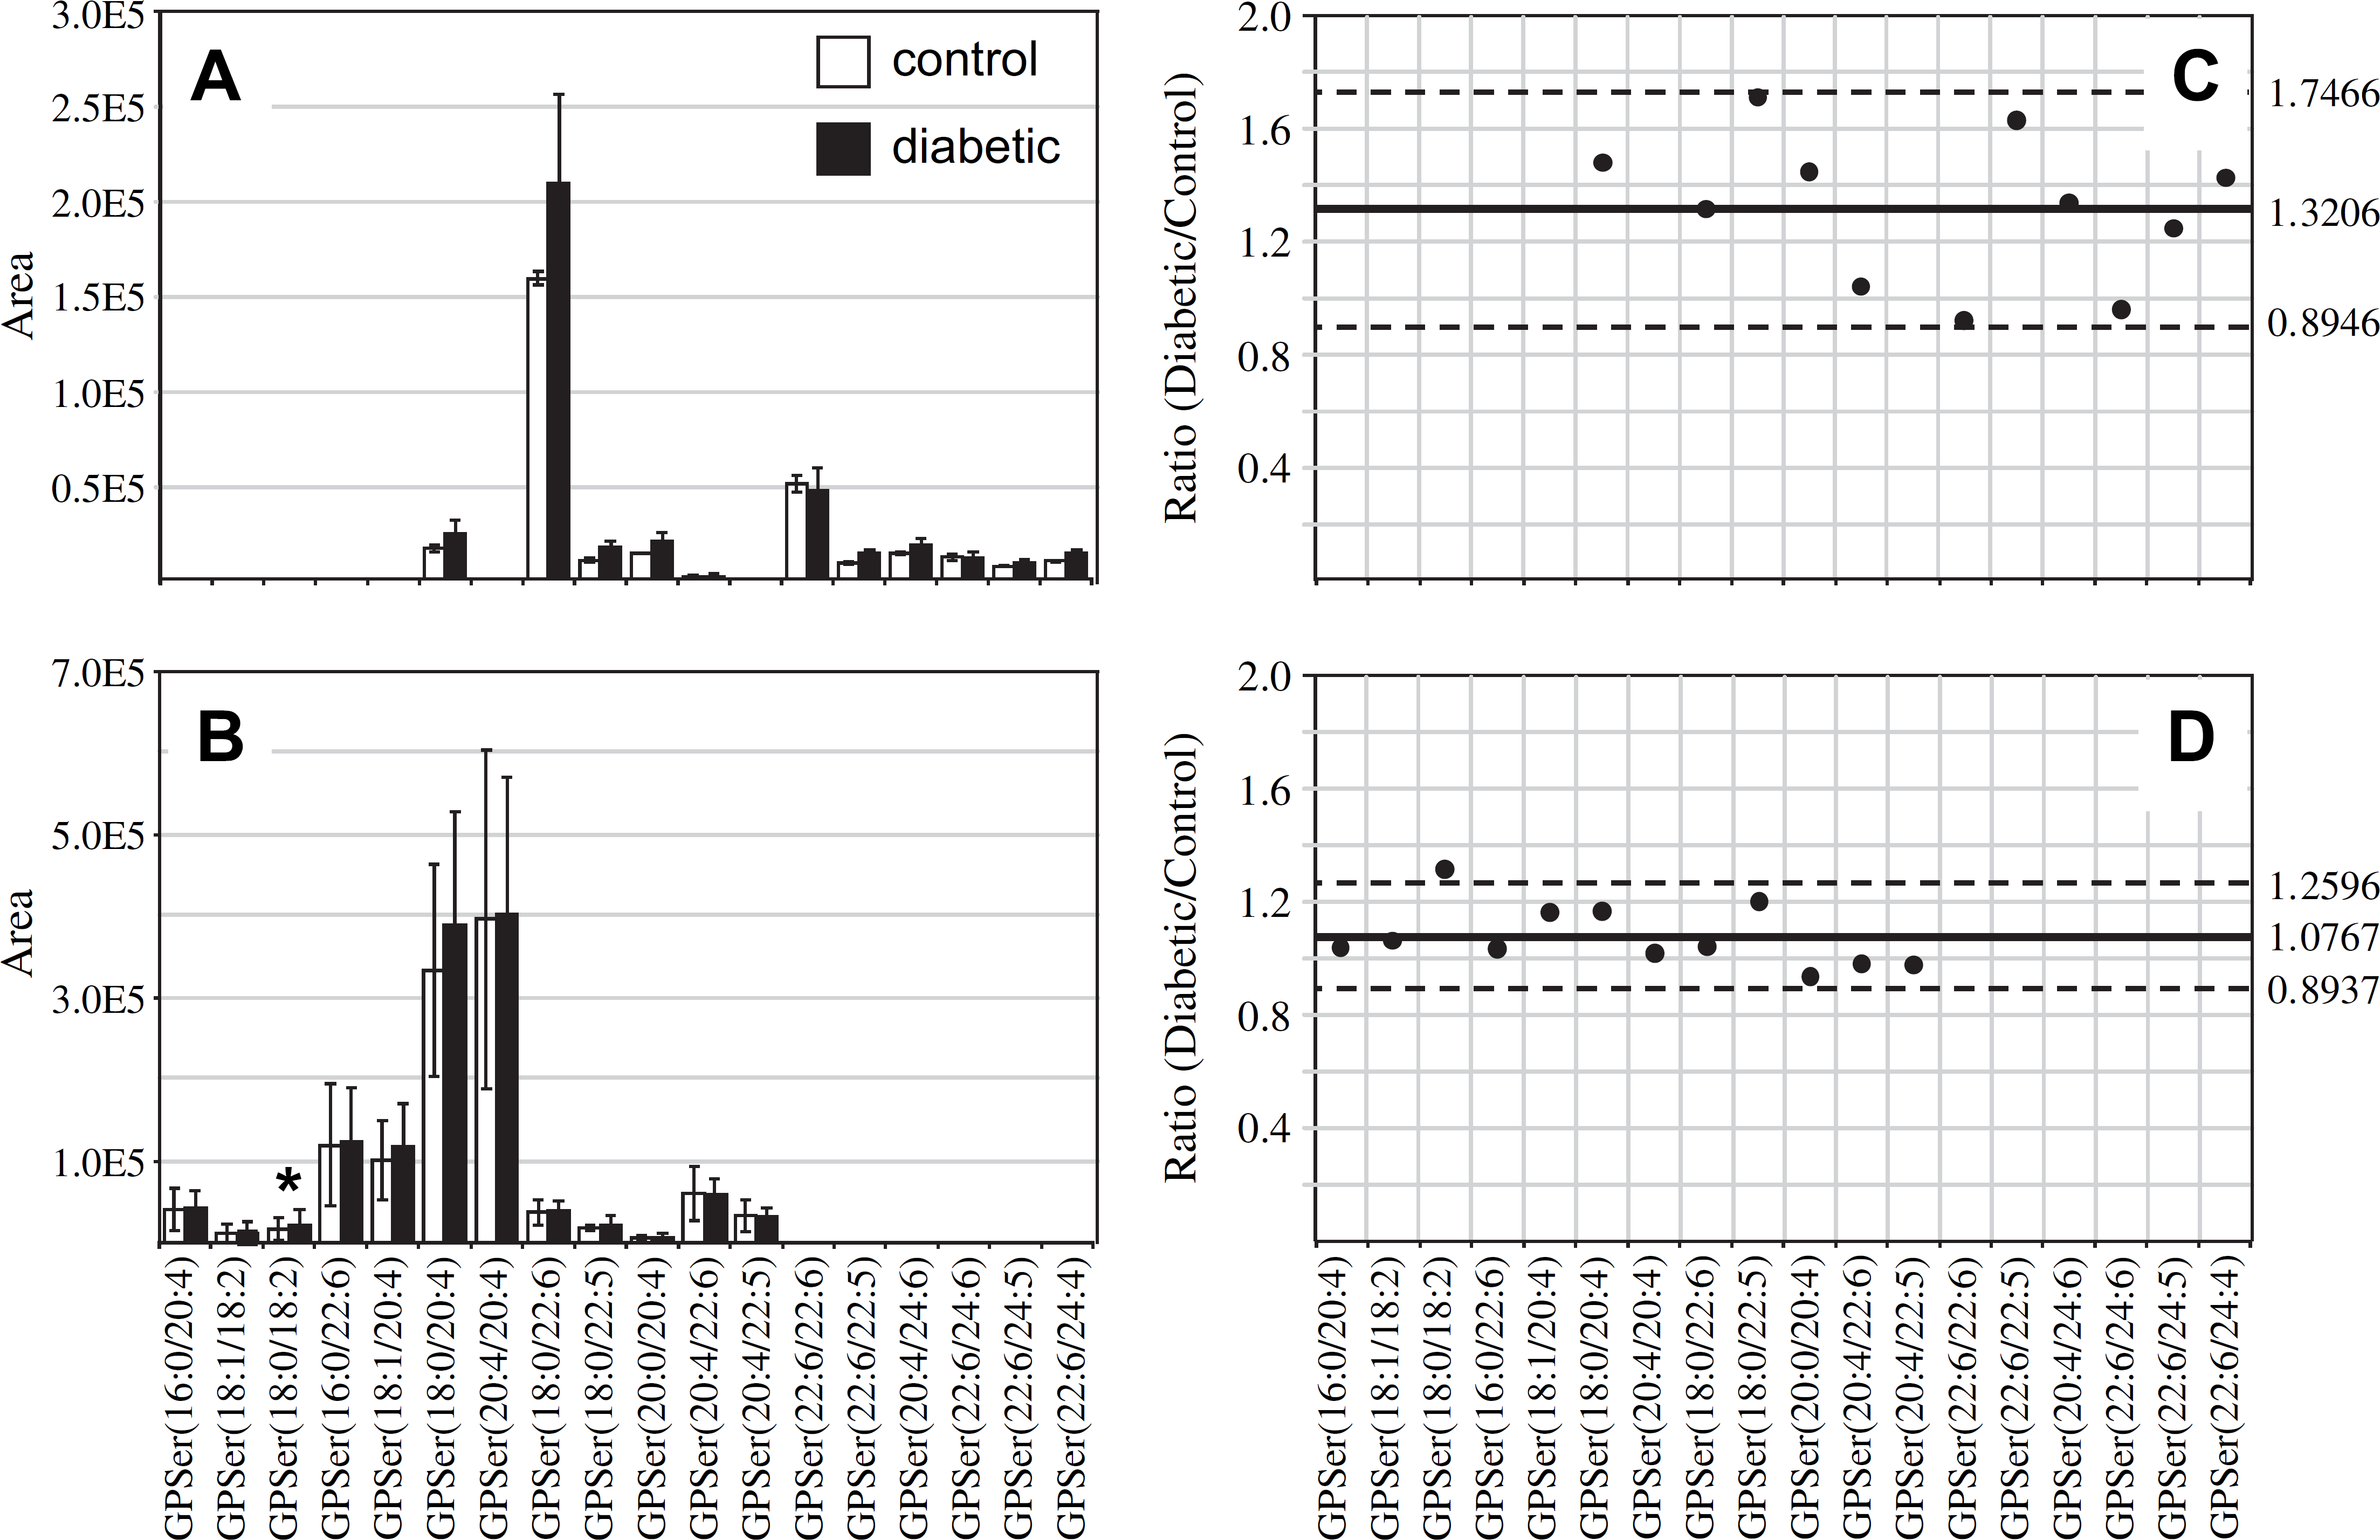
Ratiometric analysis of changes in glycerophosphoethanolamine (GPSer) lipid ion abundances between age-matched control and diabetic rat retina and erythrocyte samples, 6 weeks after treatment with streptozotocin. Data were obtained by negative ion mode electro-spray ionization (ESI)—MS/MS analysis, via scanning for the characteristic neutral loss of dehydroalanine (m/z 87) to identify [M—H]− precursor ions. Data values are displayed as mean ± standard deviation (SD) from n = 3 control and n = 4 diabetic rats. (A) Comparison of age-matched control and diabetic rat retina. (B) Comparison of age-matched control and diabetic rat erythrocytes. (C) Visualization of the fold change (expressed as the ratio of diabetic/control lipid area intensity) observed for individual GPSer lipid ions between age-matched control and diabetic rat retina from panel A. (D) Visualization of the fold change (expressed as the ratio of diabetic/control lipid area intensity) observed for individual GPSer lipid ions between age-matched control and diabetic rat erythrocytes from panel B. The solid line indicates the mean of the measurements, whereas the dashed lines indicate ±1.645 SD (i.e., 90% confidence intervals).
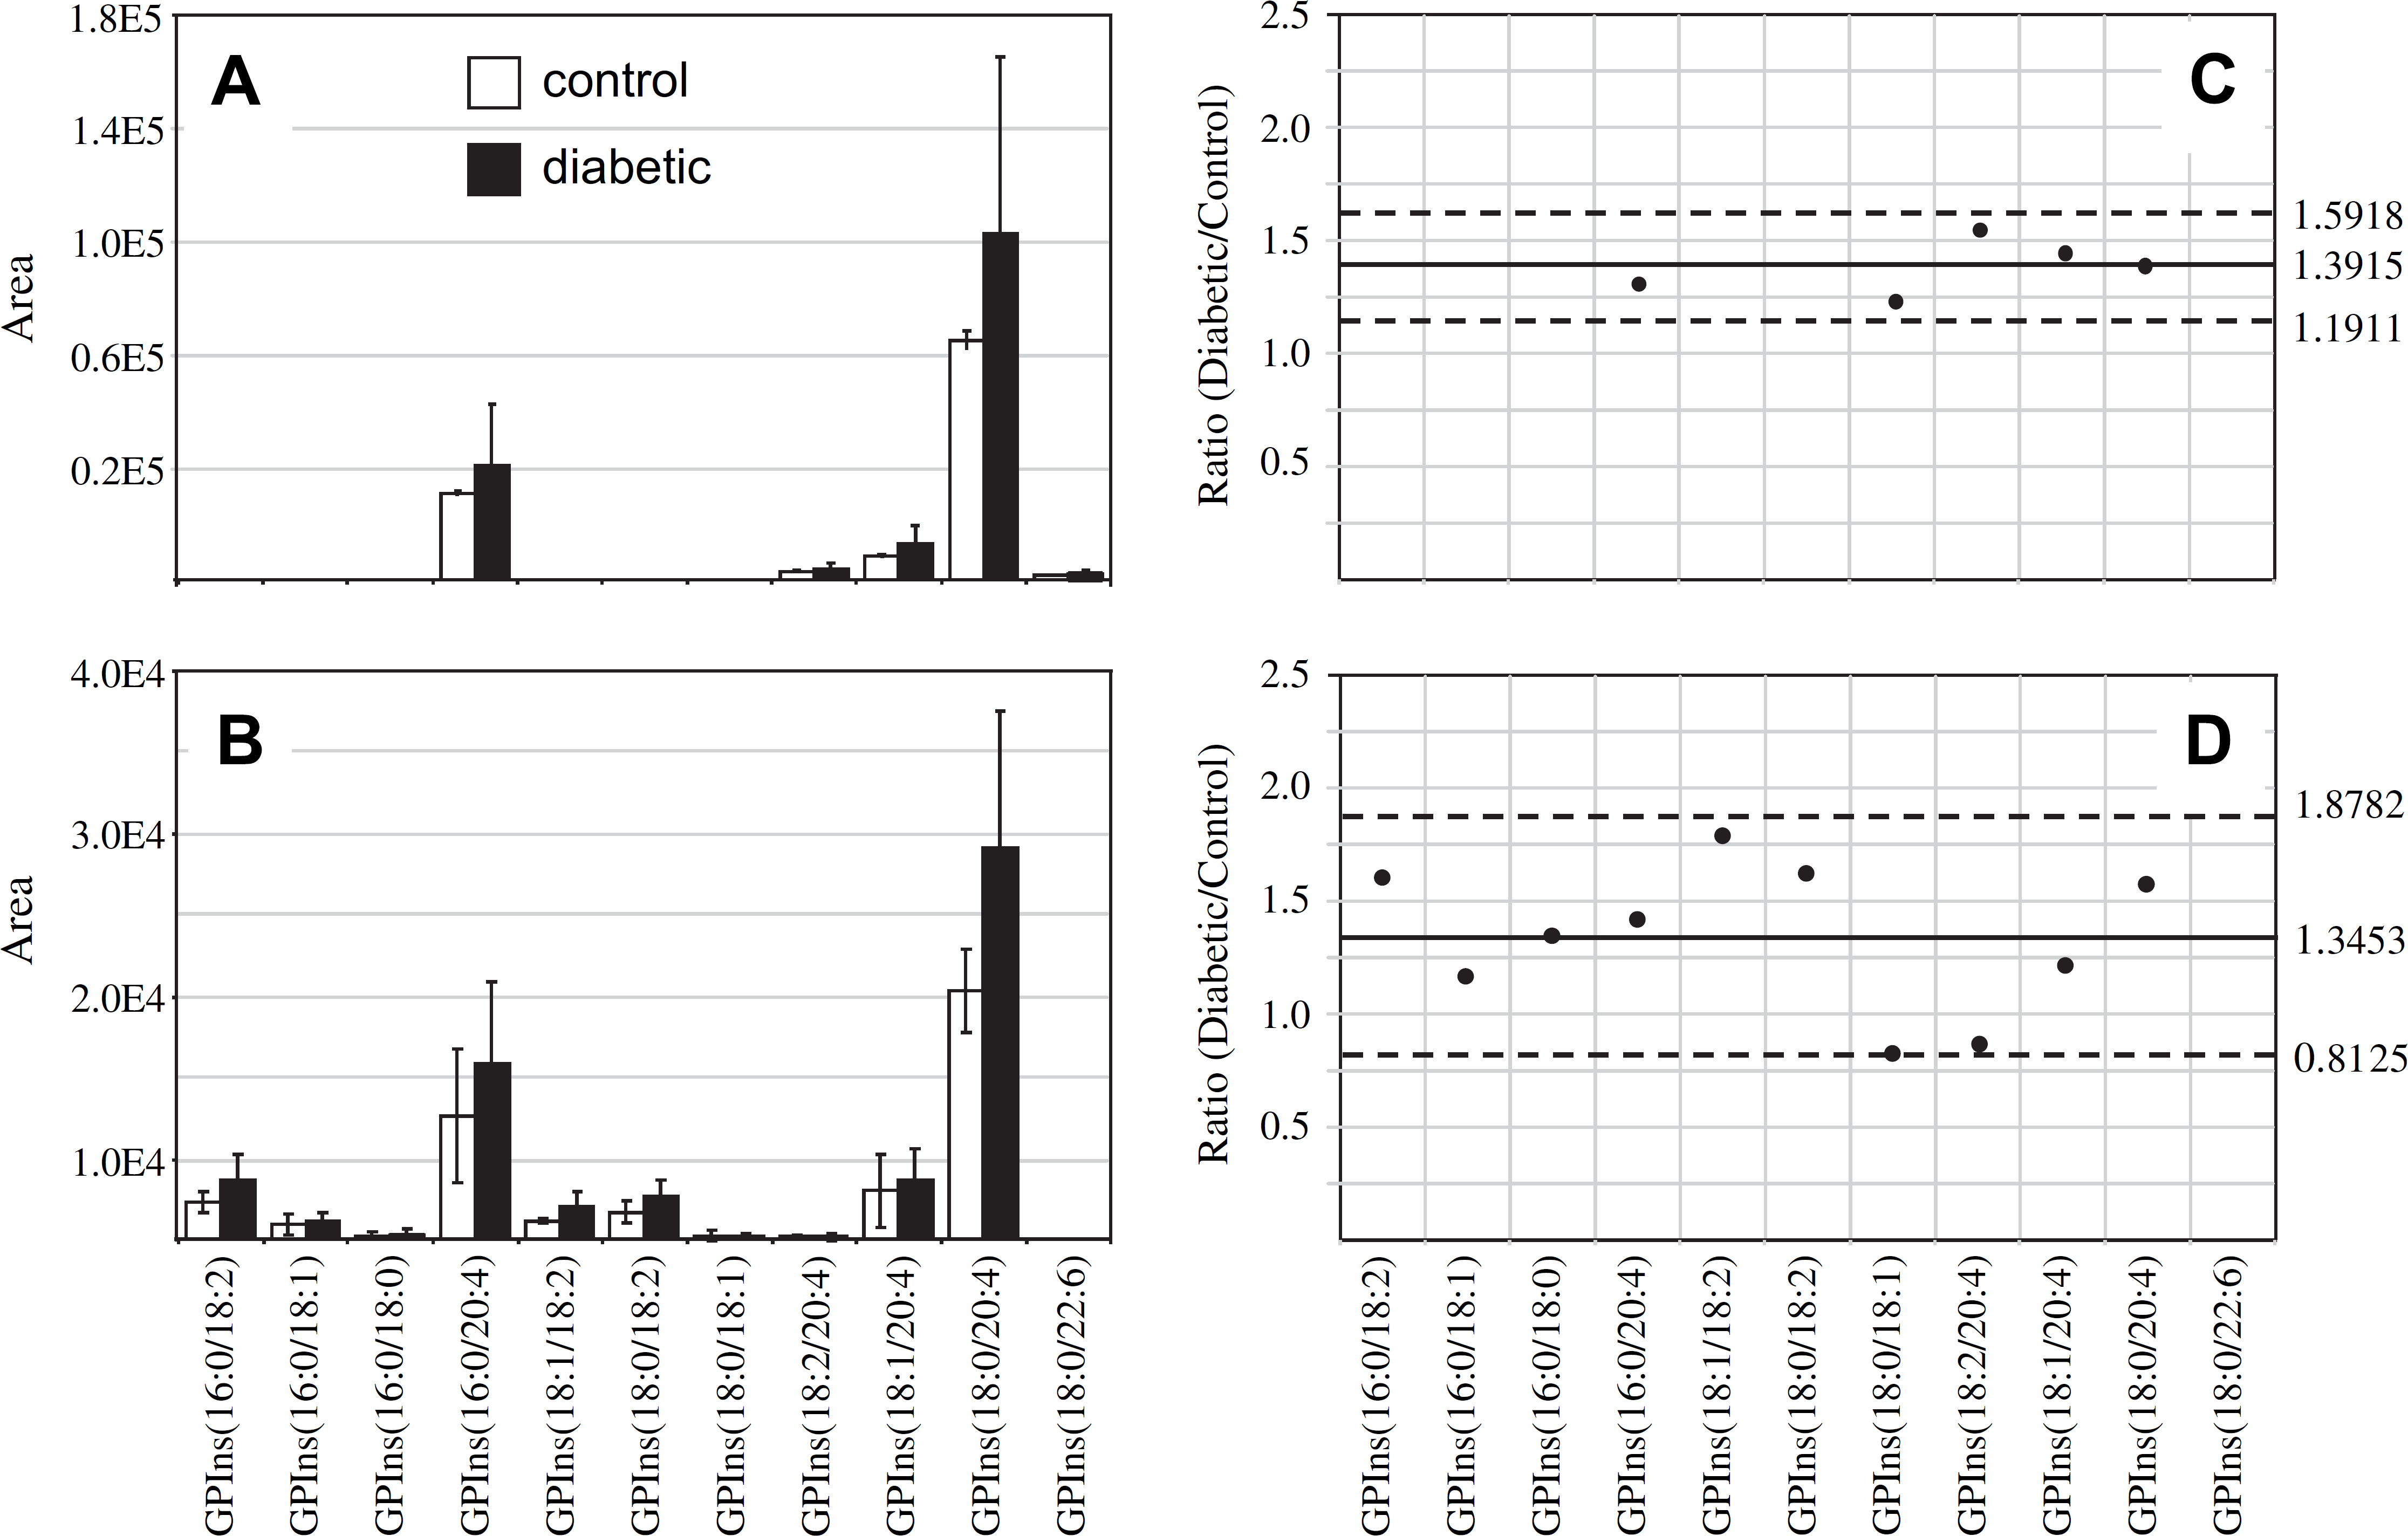
Ratiometric analysis of changes in glycerophosphoinositol (GPIns) lipid ion abundances between age-matched control and diabetic rat retina and erythrocyte samples, 6 weeks after treatment with streptozotocin. Data were obtained by negative ion mode electrospray ionization (ESI)—MS/MS analysis, via scanning for the characteristic phosphoinositol ion at m/z 241 to identify [M—H]− precursor ions. Data values are displayed as mean ± standard deviation (SD) from n = 3 control and n = 4 diabetic rats. (A) Comparison of age-matched control and diabetic rat retina. (B) Comparison of age-matched control and diabetic rat erythrocytes. (C) Visualization of the fold change (expressed as the ratio of diabetic/control lipid area intensity) observed for individual GPIns lipid ions between age-matched control and diabetic rat retina from panel A. (D) Visualization of the fold change (expressed as the ratio of diabetic/control lipid area intensity) observed for individual GPIns lipid ions between age-matched control and diabetic rat erythrocytes from panel B. The solid line indicates the mean of the measurements, whereas the dashed lines indicate ±1.645 SD (i.e., 90% confidence intervals).
Analysis of GPCho and GPEtn Lipids Extracted from Control and Diabetic Retina and Erythrocytes, 36 Weeks Post-STZ Treatment
Given that the GPSer and GPIns lipids were observed at very low abundance in both the retina and erythrocyte extracts at the 6-week time point after STZ treatment, and were not observed to yield significant changes between control and diabetic samples, all further analysis of retina and erythrocyte lipid extracts from control and diabetic rats, 36 weeks post-STZ treatment, was performed only on the GPCho and GPEtn lipids. Before further dilution and subsequent MS analysis of the lipid extracts, internal standards consisting of GPCho(14:0/14:0) and GPEtn(14:0/14:0) were added. This enabled a direct comparison of the quantitative results obtained by analysis using the “internal standard free” method, with those obtained using an “internal standard” method.
For the retina GPCho lipid extracts, essentially identical results were obtained from each method. The SDs obtained using the “internal standard” method ranged from 12.0% to 27.7% with an average of 17.4% for the control extracts and from 10.2% to 23.6% with an average of 18.6% for the diabetic extracts (Fig. 6A), whereas the SDs for the “internal standard free” method ranged from 18.4% to 26.9% with an average of 21.3% for the control extracts and from 13.5% to 24.6% with an average of 18.5% for the diabetic extracts (Fig. 6B). However, in contrast to the results obtained from the 6 weeks post-STZ treatment GPCho retina lipid extracts (Fig. 2A), where an approximately 24% increase in the average ion abundance was observed between diabetic and control samples, a decrease of approximately 16% in the average ion abundance between diabetic and control samples was observed at 36 weeks post-STZ treatment, using both the internal standard and “internal standard free” approaches (Fig. 6C, D, respectively). These data suggest that the increase in retina glycerophospholipid ion abundances observed at the 6-week time point after the onset of diabetes (postulated above to be due to diabetes-induced upregulation of lipogenic gene expression) are offset at the later time point, potentially due to an increase in retinal permeability associated with diabetic macular edema, which would decrease the ratio of lipid/water in the retina. 73 However, despite the overall decrease in average GPCho lipid abundances in the diabetic retina, the same molecular GPCho lipid species that were observed to be either significantly higher or lower in abundance in the diabetic retina compared with the control retina at the 6-week time point (i.e., GPCho(16:0/18:2), GPCho(18:1/18:2), and GPCho(22:6/22:6)) were also found to be significant at the 36-week time point.
In contrast to that determined from the retina samples, the results obtained from the extracted erythrocyte GPCho lipids, 36 weeks post-STZ treatment, using the internal standard (Fig. 7A) and the “internal standard free” (Fig. 7B) methods yielded significantly different results. Although the results obtained using the internal standard method indicated that the average GPCho lipid ion abundances were essentially unchanged between diabetic and control groups (Fig. 7C), the “internal standard free” approach indicated an approximate increase in average ion abundances of 26% (Fig. 7D). Diabetic ketoacidosis is known to result in a decrease in diabetic blood pH, and in the absence of buffering of tissue/cell homogenates, may effect extraction efficiencies or ionization efficiencies for lipids extracted from diabetic erythrocytes compared with control erythrocytes, or introduce other unanticipated matrix effects during MS analysis. Note that the quantitative results obtained using the “internal standard free” and internal standard methods were both taken from the same experimental data sets, that is, for the “label-free” method, each lipid extract contained the internal standard but this was not used for normalization of ion abundances. Thus, the observed differences between the “internal standard free” and internal standard quantification results may not be due to altered extraction efficiencies. Even though buffering of the lipid extracts before MS analysis was performed via the inclusion of 20 mM NH4OH, it was not determined whether the pH of the extracts were identical between diabetic and control erythrocyte lipid extracts. Thus, the differences in quantitative results that were determined using the two methods are likely due to higher ESI efficiencies or other matrix-related effects associated with the diabetic erythrocytes. Interestingly, as described above, no discrepancy in lipid ion abundances was observed between the internal standard and “internal standard free” methods for the 36-week retina samples. This is consistent with results from a previous study, suggesting that the retina is protected from perturbations due to diabetic ketoacidosis. 74 Differences in the abundances of several individual GPCho molecular lipid species were determined between the diabetic and control erythrocyte extracts, 36 weeks post-STZ treatment. For example, GPCho(18:1/22:6) was found to undergo a significant decrease using both “internal standard” and “internal standard free” quantitative methods, whereas GPCho(16:0/18:1) was determined to undergo a significant increase, albeit only in the “internal standard free” quantitative method. However, the validity of the GPCho changes in the erythrocyte lipid profiles at the 36-week time point, determined using the “internal standard free” method, must be questioned.
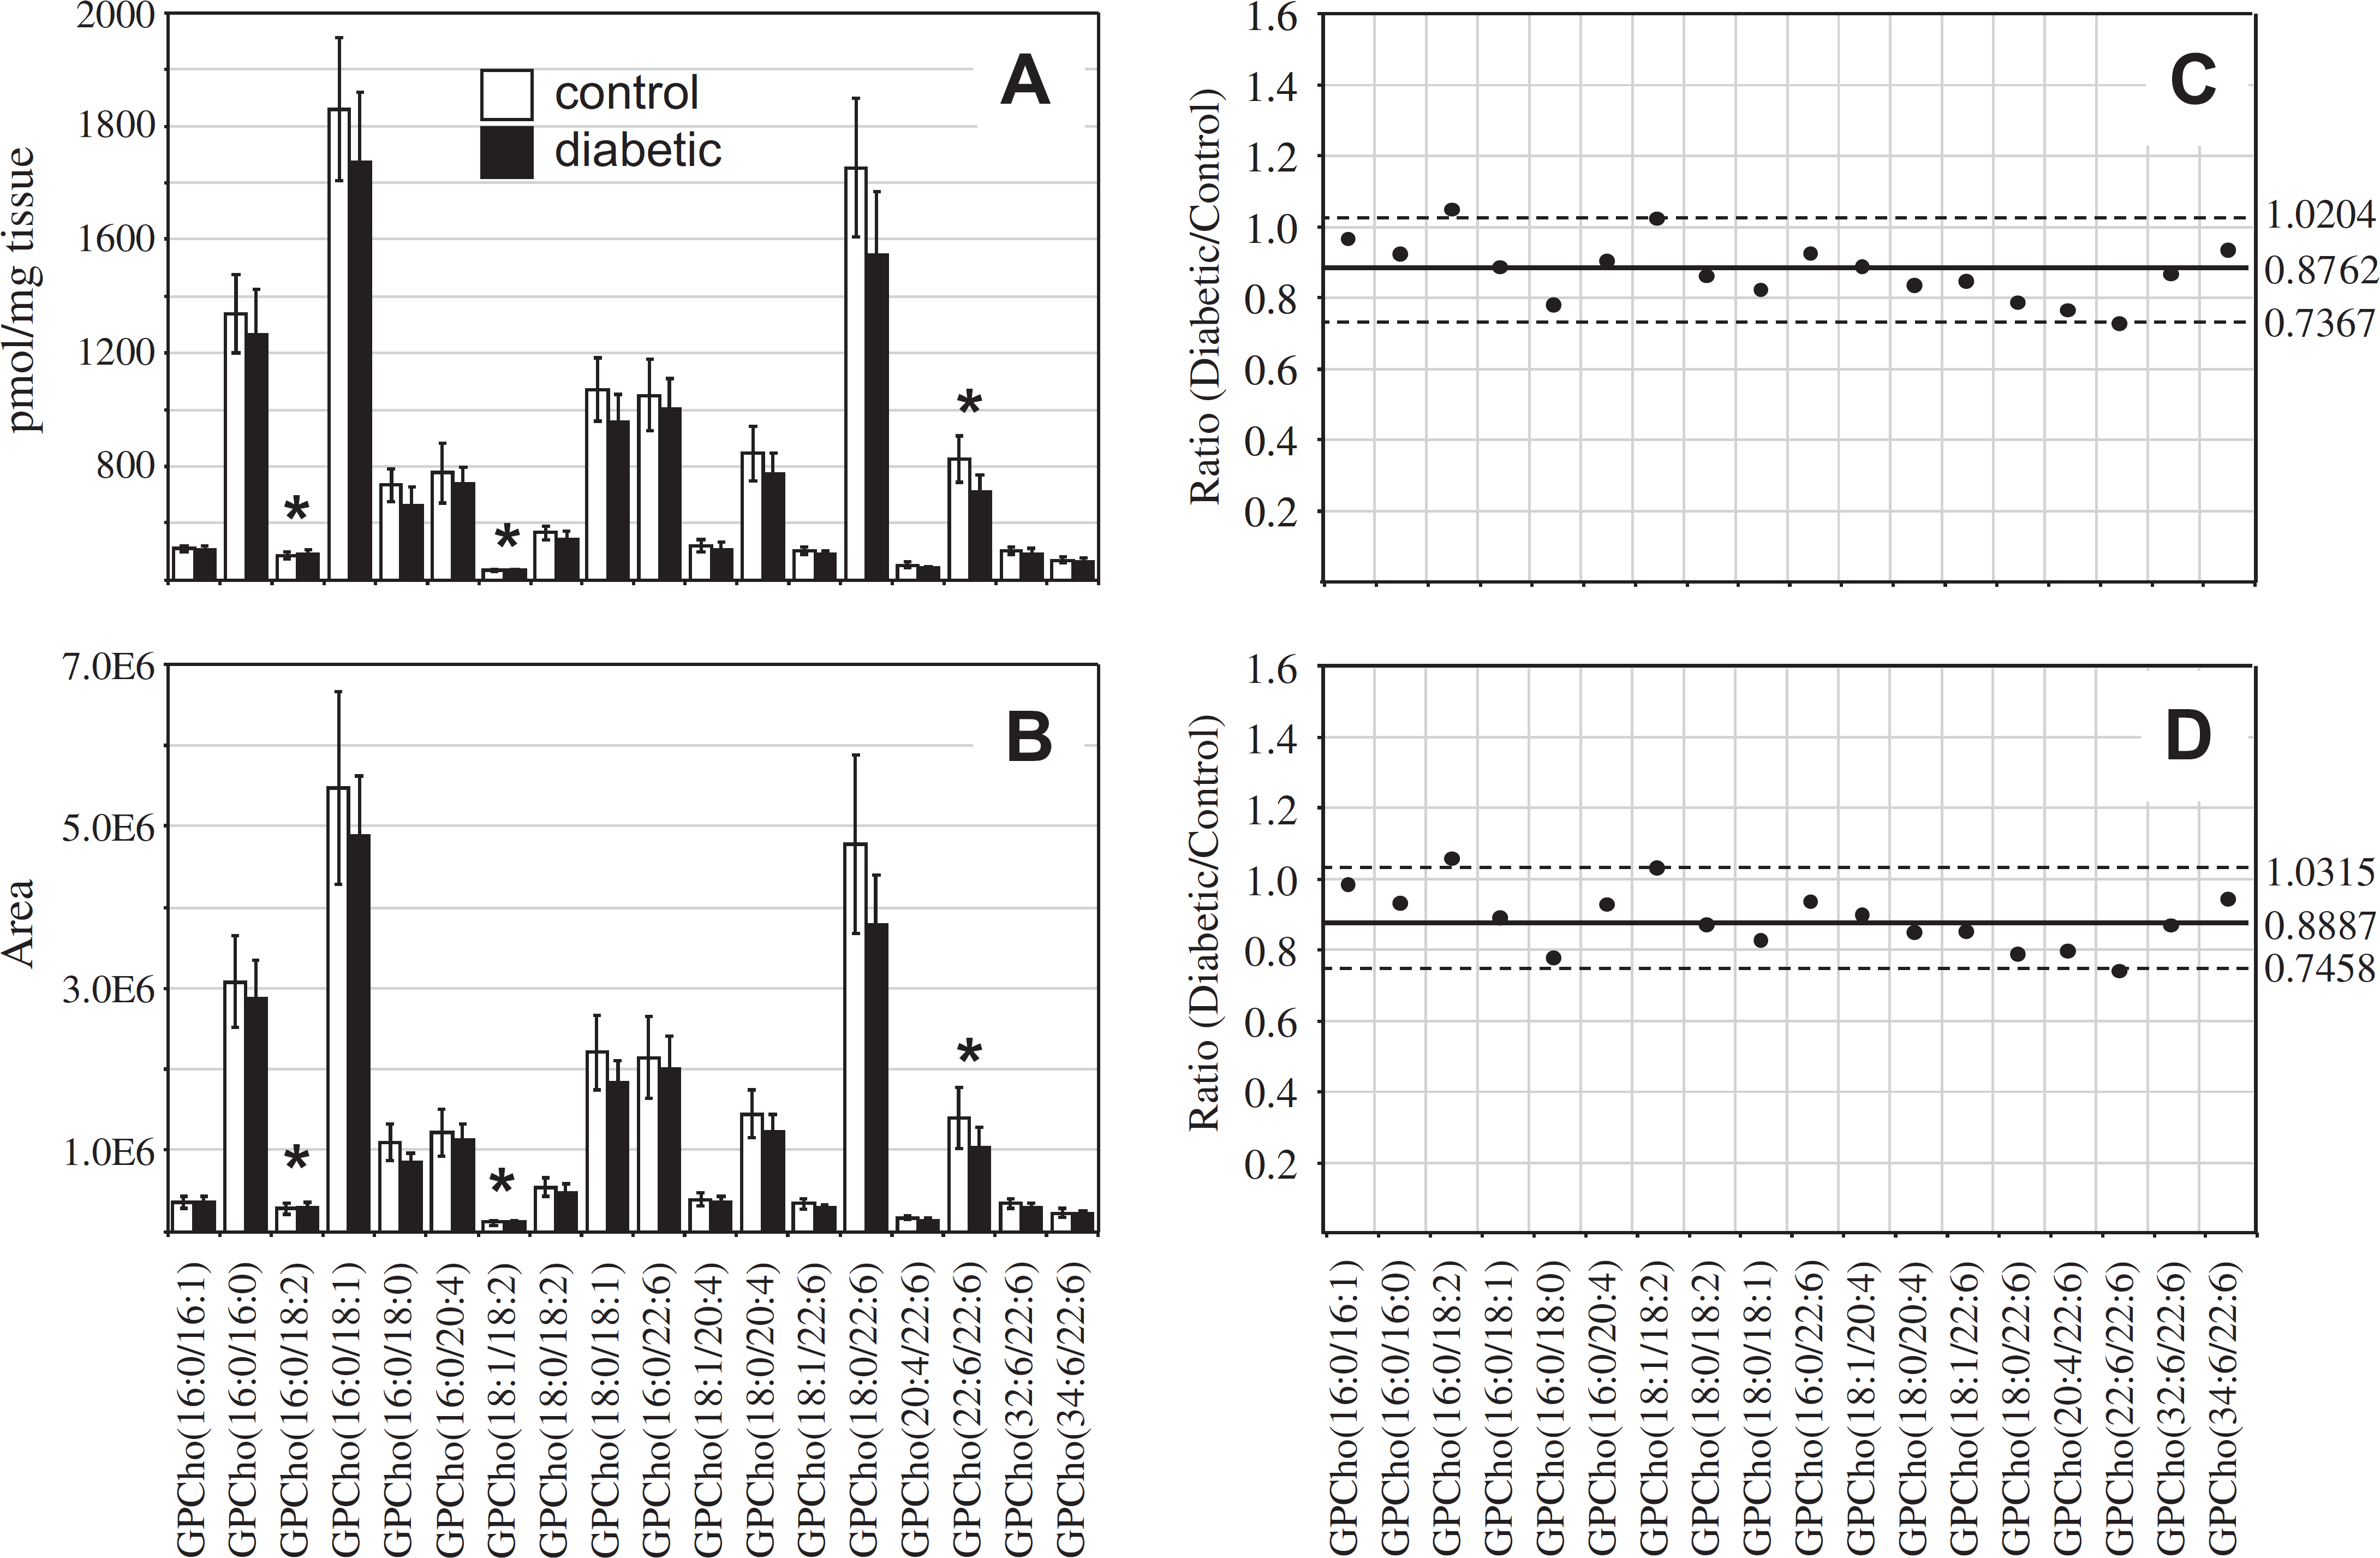
Ratiometric analysis of changes in glycerophosphocholine (GPCho) lipid ion abundances determined between age-matched control and diabetic rat retina, 36 weeks after treatment with streptozotocin, in the presence or absence of an internal standard. Data were obtained by positive ion mode electrospray ionization (ESI)—MS/MS analysis, via precursor ion (PI) scanning for the characteristic phosphocholine ion at m/z 184 to identify [M + H]+ Pls. Data values are displayed as mean ± standard deviation (SD) from n = 6 control and n = 5 diabetic rats. (A) Comparison of age-matched control and diabetic rat retina (with internal standard). (B) Comparison of age-matched control and diabetic rat retina (without internal standard). (C) Visualization of the fold change (expressed as the ratio of diabetic/control lipid area intensity) in the abundances of individual GPCho lipid ions observed between age-matched control and diabetic rat retina from panel A. (D) Visualization of the fold change (expressed as the ratio of diabetic/control lipid area intensity) in the abundances of individual GPCho lipid ions observed between age-matched control and diabetic rat retina from panel B. The solid line indicates the mean of the measurements, whereas the dashed lines indicate ±1.645 SD (i.e., 90% confidence intervals).
Analysis of the GPEtn lipids extracted from retina and erythrocytes of control and diabetic rats, 36 weeks post-STZ treatment, were also determined using both the internal standard and “internal standard free” methods. The results obtained from the retina and erythrocyte lipid extracts using the internal standard method are shown in Fig. 8A, B, respectively. Similar to that described above for the GPCho lipids, analysis of the retina GPEtn lipids was found to yield essentially identical results from both methods, with an approximately 25% decrease in the average GPEtn lipid ion abundances observed between diabetic and control retina (Fig. 8C), again indicating the utility of the internal standard-free method for quantitative analysis of lipids from retina tissue. However, none of the observed GPEtn molecular lipid species were found to be significantly different in abundance between the diabetic and control retina samples, consistent with that observed at the 6-week time point. The use of the internal standard-free method for analysis of the erythrocyte GPEtn lipids gave erroneously high results compared with those determined using the internal standard method (an 11% increase vs. a 1% decrease in average GPEtn lipid ion abundances, respectively) (Fig. 8D), similar to that determined by analysis of the GPCho lipids.
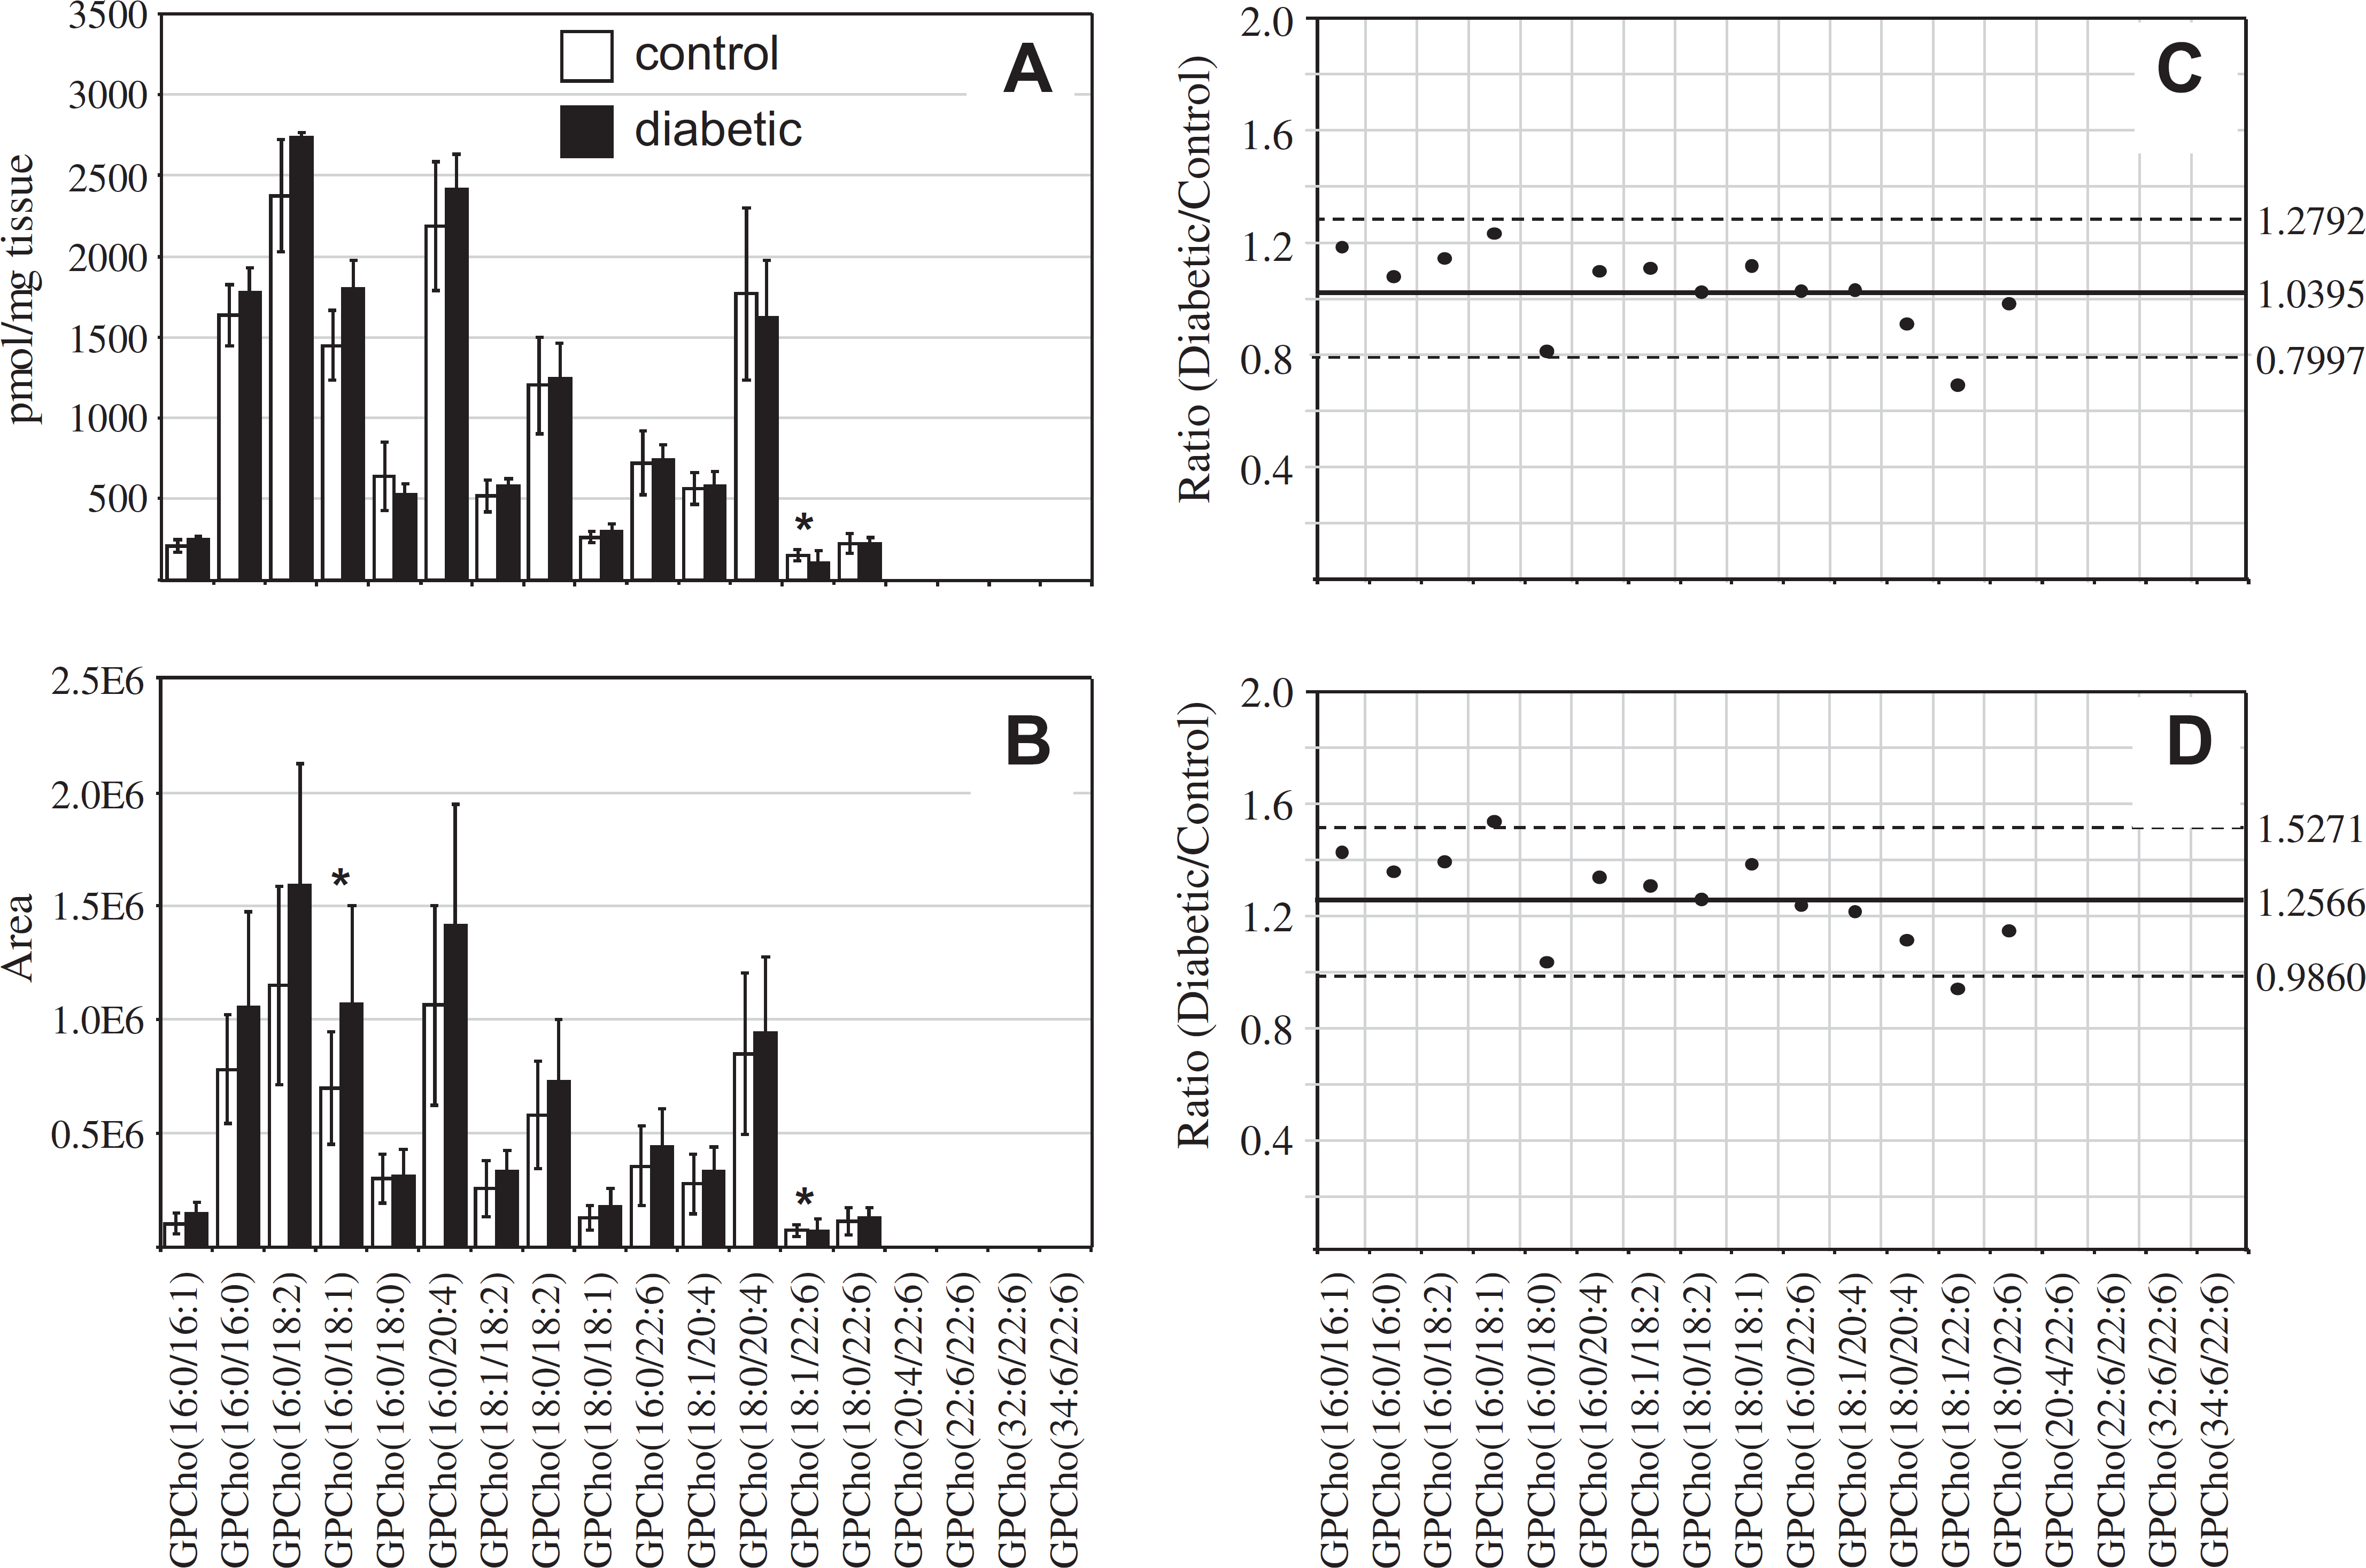
Ratiometric analysis of changes in glycerophosphocholine (GPCho) lipid ion abundances determined between age-matched control and diabetic rat erythrocytes, 36 weeks after treatment with streptozotocin, in the presence or absence of an internal standard. Data were obtained by positive ion mode electrospray ionization (ESI)—MS/MS analysis, via precursor ion (PI) scanning for the characteristic phosphocholine ion at m/z 184 to identify [M + H]+ Pls. Data values are displayed as mean ± standard deviation (SD) from n = 5 control and n = 4 diabetic rats. (A) Comparison of age-matched control and diabetic rat erythrocytes (with internal standard). (B) Comparison of age-matched control and diabetic rat erythrocytes (without internal standard). (C) Visualization of the fold change (expressed as the ratio of diabetic/control lipid area intensity) in the abundances of individual GPCho lipid ions observed between age-matched control and diabetic rat erythrocytes from panel A. (D) Visualization of the fold change (expressed as the ratio of diabetic/control lipid area intensity) in the abundances of individual GPCho lipid ions observed between age-matched control and diabetic rat erythrocytes from panel B. The solid line indicates the mean of the measurements, whereas the dashed lines indicate ±1.645 SD (i.e., 90% confidence intervals).
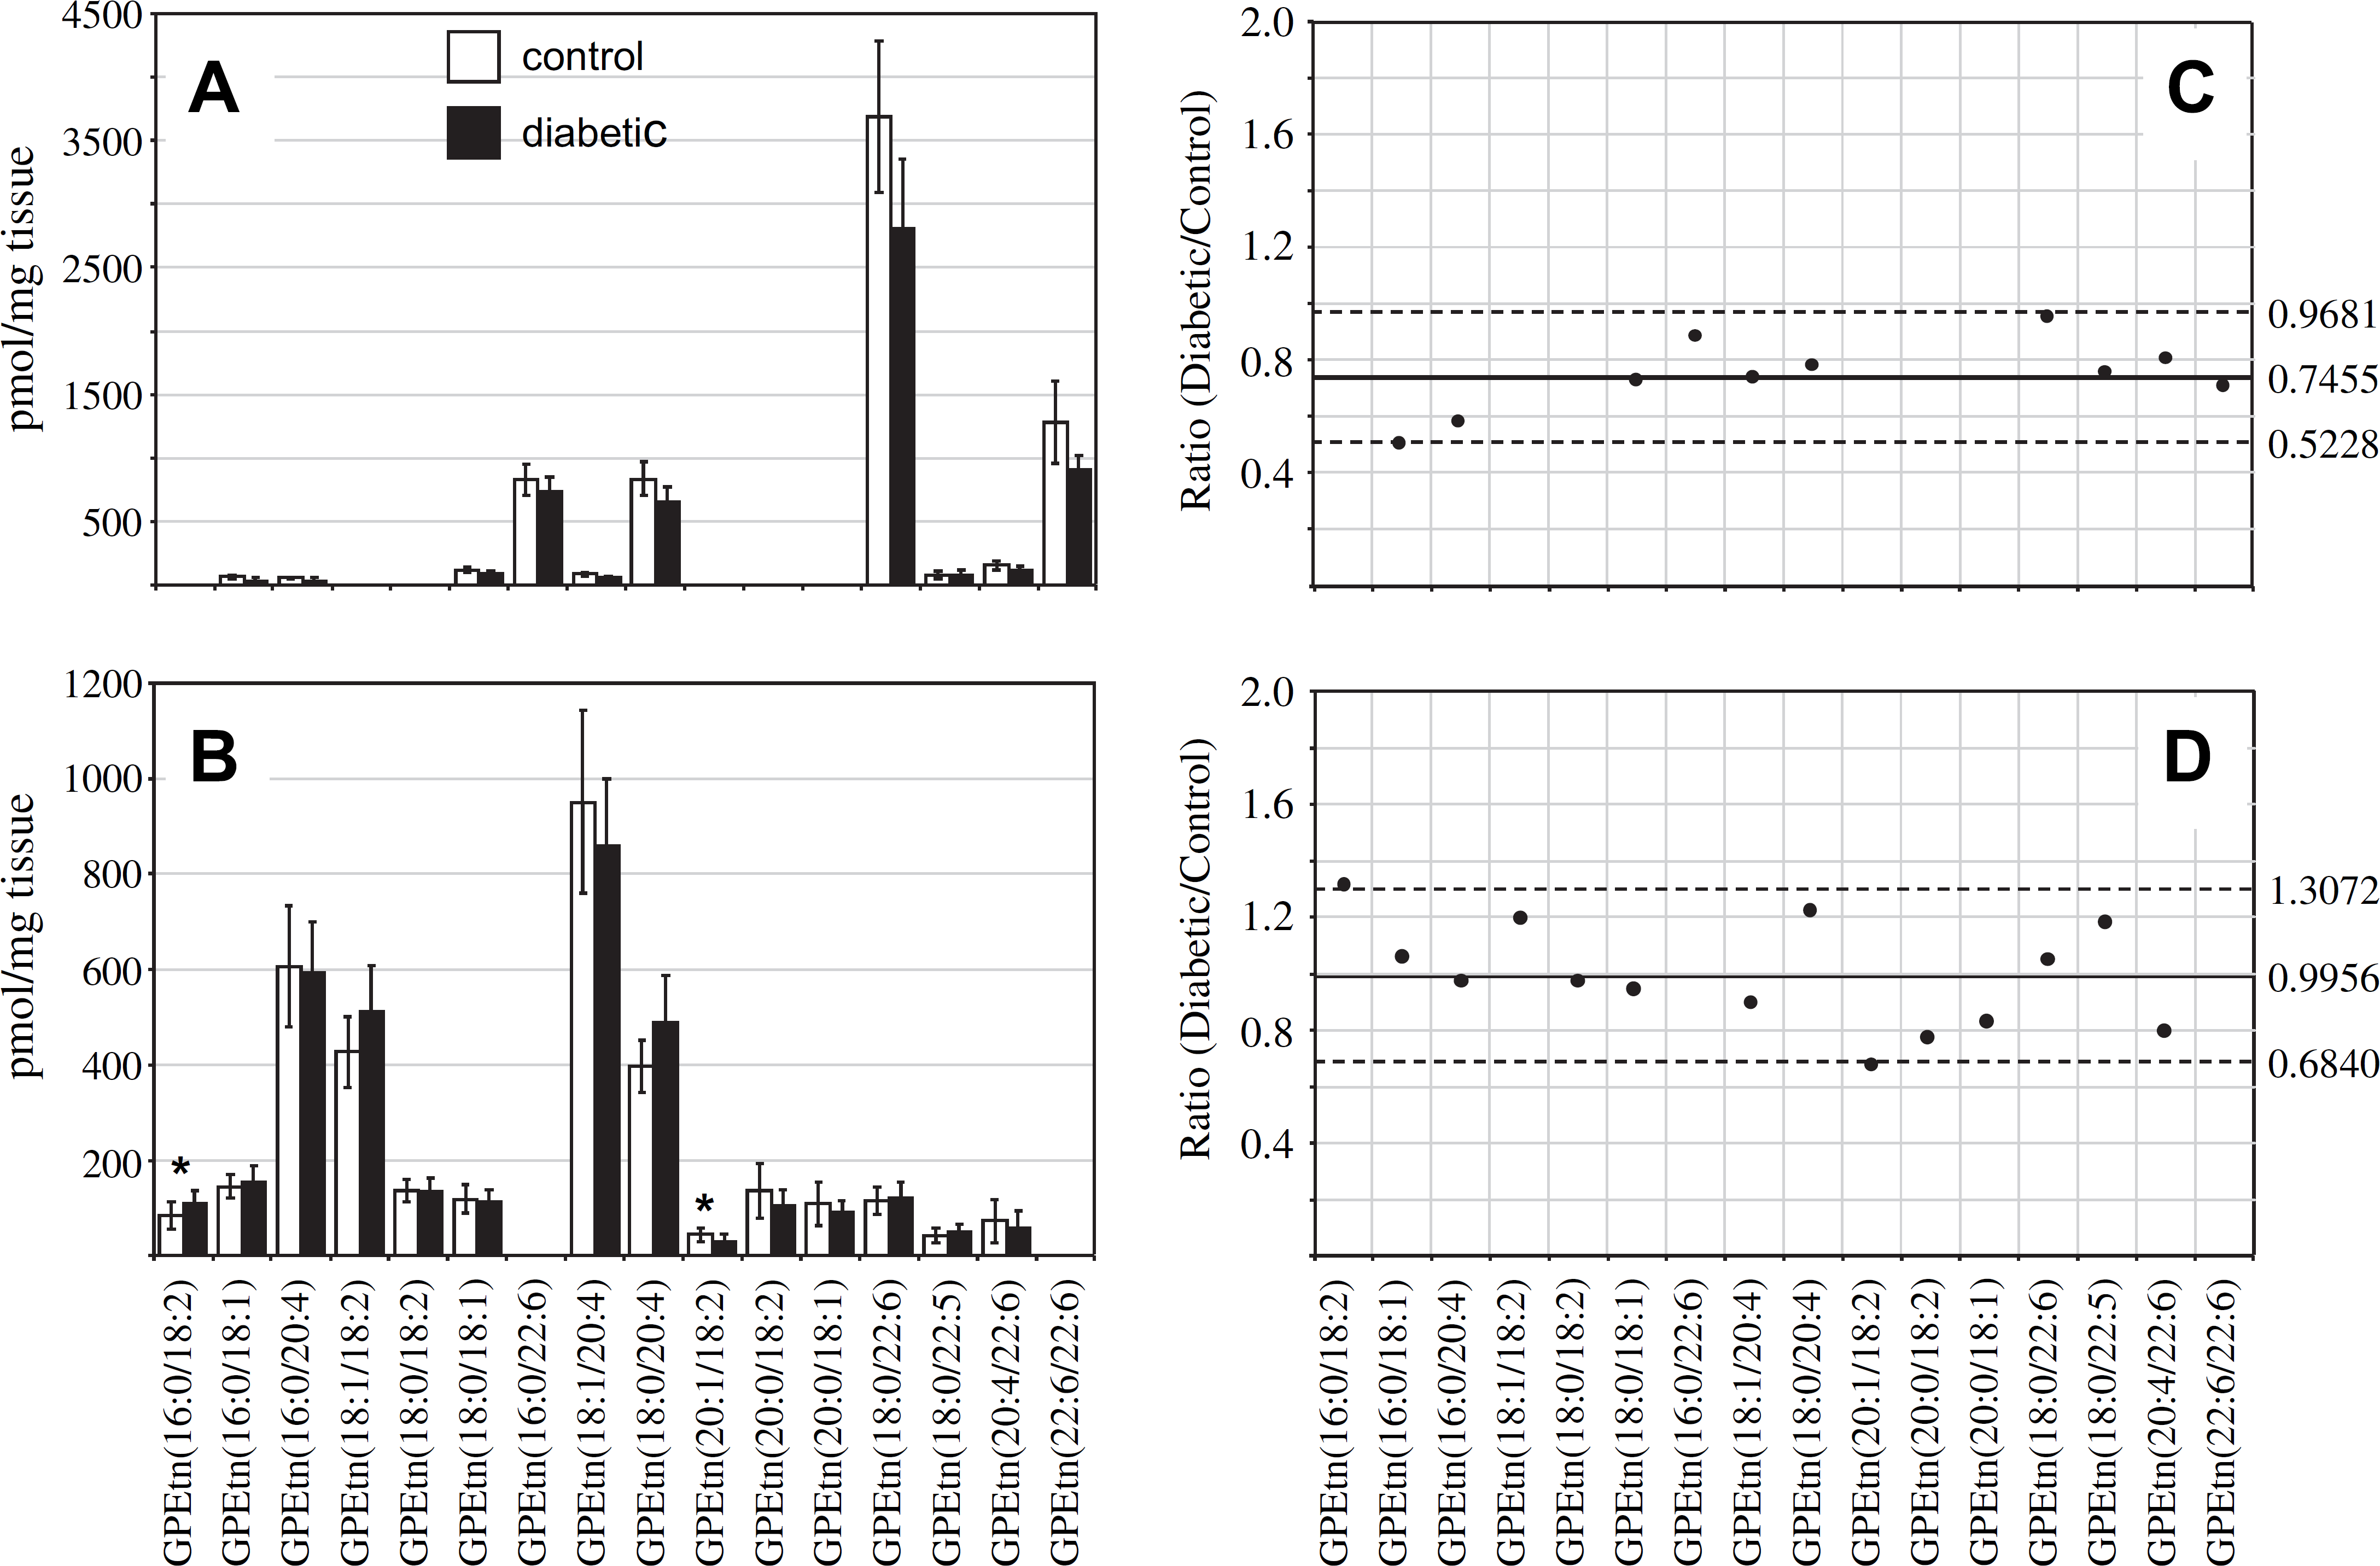
Ratiometric analysis of changes in glycerophosphoethanolamine (GPEtn) lipid ion abundances between age-matched control and diabetic rat retina and erythrocyte samples, 36 weeks after treatment with streptozotocin, in the presence of an internal standard. Data were obtained by positive ion mode electrospray ionization (ESI)—MS/MS analysis, via scanning for the characteristic neutral loss of phosphoethanolamine (m/z 141) to identify [M + H]+ or [M + Na]+ precursor ions. Data values are displayed as mean ± standard deviation (SD) from n = 6 control and n = 6 diabetic rats. (A) Comparison of age-matched control and diabetic rat retina. (B) Comparison of age-matched control and diabetic rat erythrocytes. (C) Visualization of the fold change (expressed as the ratio of diabetic/control lipid area intensity) observed for individual GPEtn lipid ions between age-matched control and diabetic rat retina from panel A. (D) Visualization of the fold change (expressed as the ratio of diabetic/control lipid area intensity) observed for individual GPEtn lipid ions between age-matched control and diabetic rat erythrocytes from panel B. The solid line indicates the mean of the measurements, whereas the dashed lines indicate it ± 1.645 SD (i.e., 90% confidence intervals).
Analysis of Amadori-GPEtn Lipids Extracted from Control and Diabetic Retina and Erythrocytes, 36 Weeks Post-STZ Treatment
As described above, quantitative MS analysis determined that none of the individual GPEtn molecular lipid species were significantly different in abundance between the diabetic and control retina samples, at either the 6- of 36-week time points after STZ treatment. However, a significant increase in abundance was observed between the diabetic and control retina for a modified (Glycated) form of the GPEtn lipids (i.e., Amadori-PE or GPEtn(Glc)), determined by using a NL scan to identify the characteristic loss of 303 m/z 66 (Fig. 9). Representative mass spectra of the GPEtn lipids observed from control and diabetic retina extracts are shown in Figure 9A, B, respectively, whereas the spectra obtained for the Amadori-GPEtn lipids from the same samples are shown in Figure 9C, D, respectively. For the most abundant Amadori-GPEtn lipid (i.e., Amadori-GPEtn(18:0/22:6)), a 4.8-fold increase (P < 0.05) in the ratio of the Amadori-GPEtn to GPEtn lipid abundance was observed in the diabetic versus control retina lipid extracts (Fig. 10A). Importantly, an increase in Amadori-GPEtn lipid abundance was also observed between the diabetic and control erythrocyte lipid extracts, where the most abundant Amadori-GPEtn lipid (GPEtn(18:10/20:4)) was observed to undergo a 1.6-fold increase (P < 0.05).
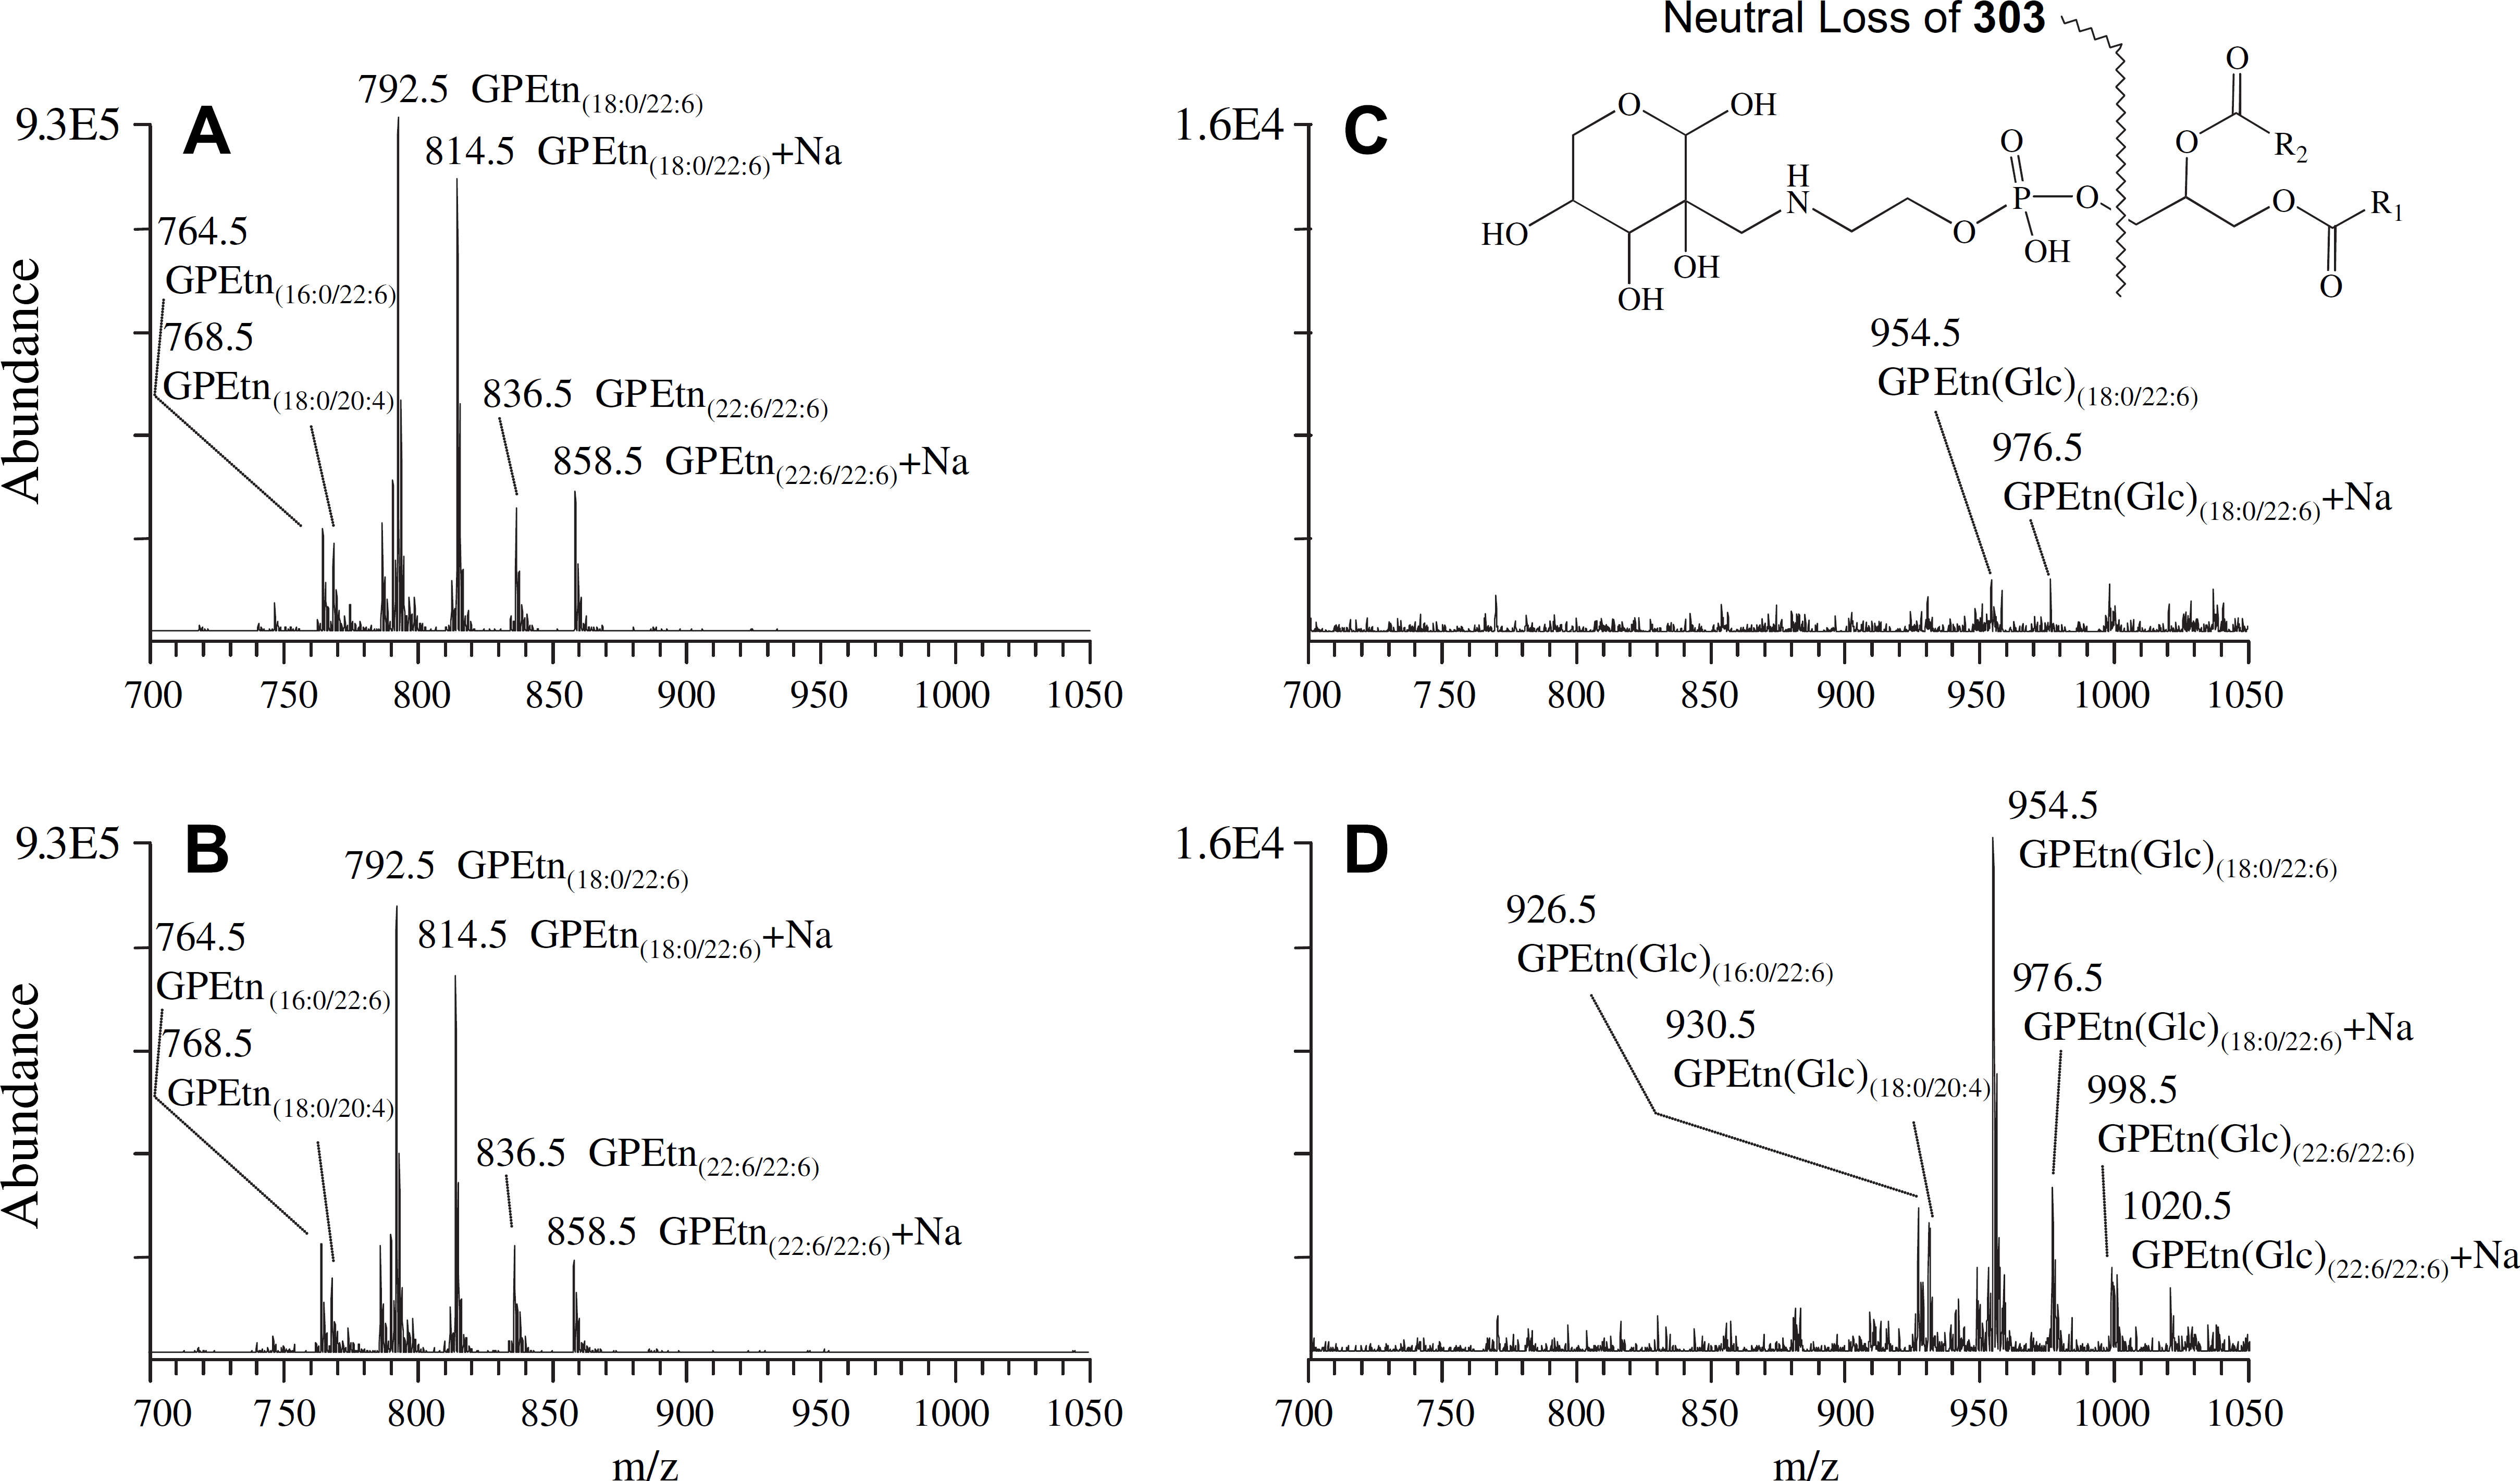
Positive ion mode electrospray ionization (ESI)–MS/MS analysis of glycerophosphoethanolamine (GPEtn) and Amadori-glycero-phosphoethanolamine (Amadori-GPEtn) lipids isolated from age-matched control and diabetic rat retina, 36 weeks after treatment with streptozotocin. (A) GPEtn lipids from control retina, (B) GPEtn lipids from diabetic retina, (C) Amadori-GPEtn lipids from control retina, and (D) Amadori-GPEtn lipids from diabetic retina. GPEtn and Amadori-GPEtn spectra were obtained by scanning for the characteristic neutral losses of phosphoethanolamine (m/z 141) and glycated phosphoethanolamine (m/z 303), respectively, to identify [M + H]+ and [M + Na]+ precursor ions. Selected regions of representative spectra from m/z 700 to 1050, containing the major GPEtn and Amadori-GPEtn lipids, are shown.
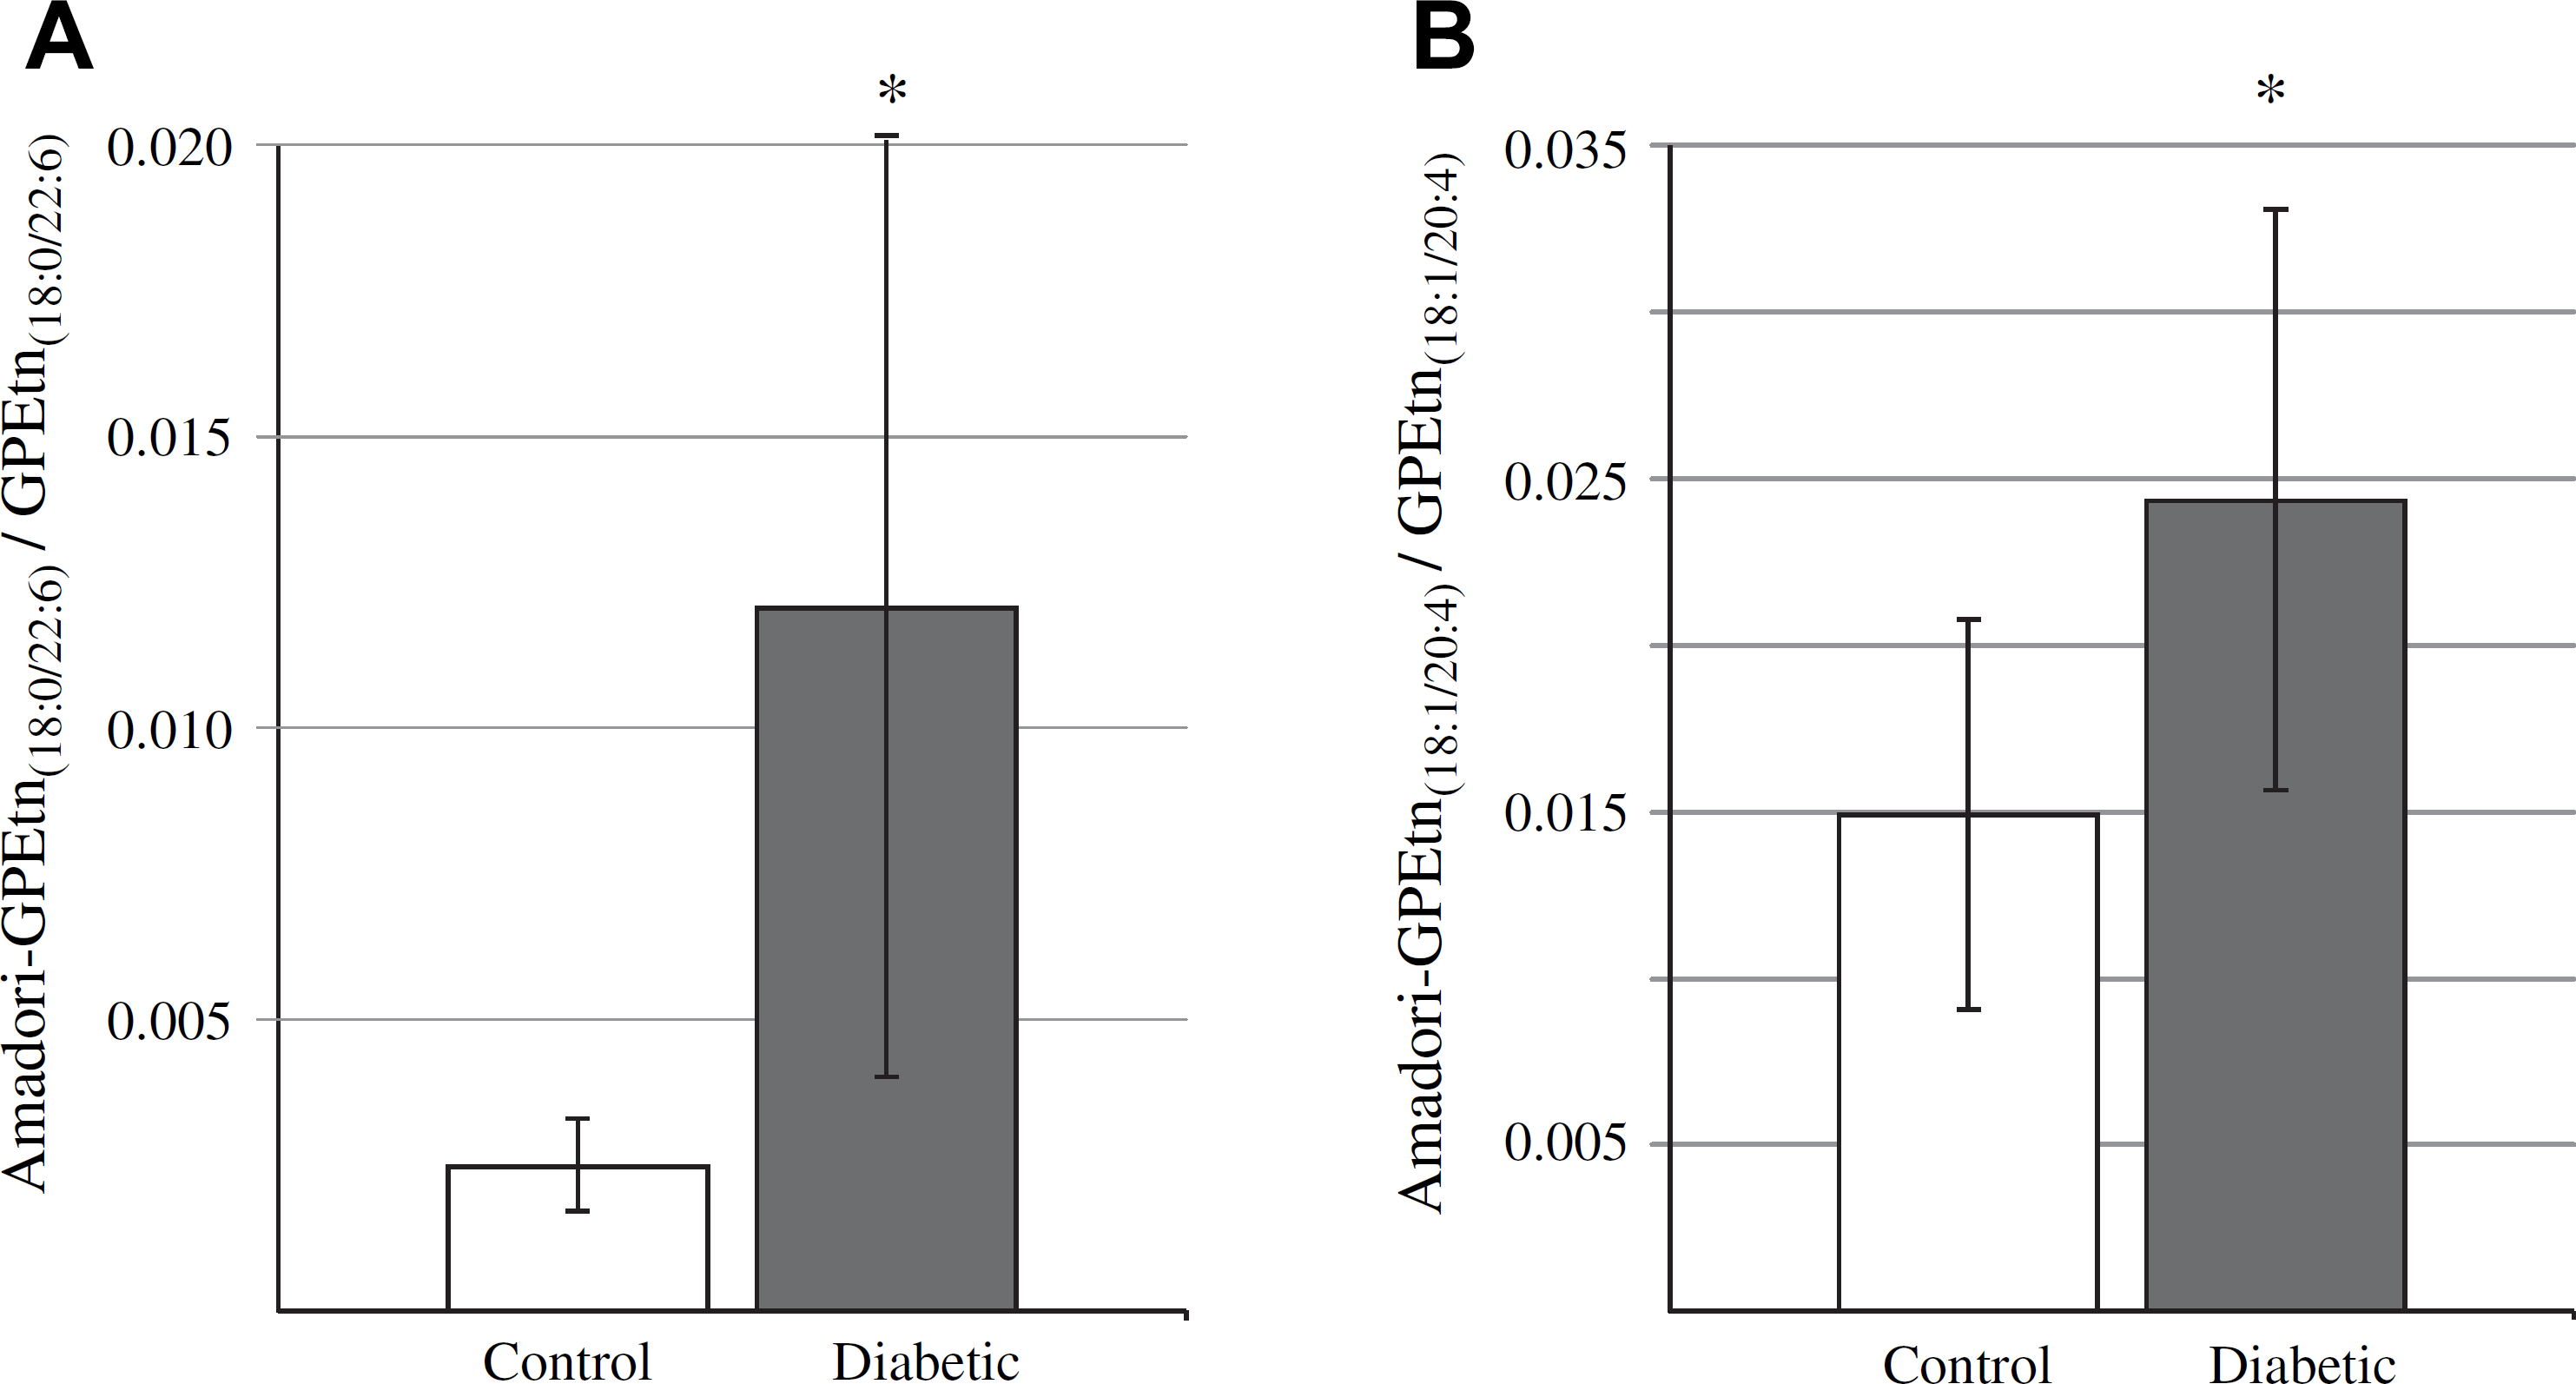
Ratiometric analysis of changes in Amadori-glycerophosphoethanolamine (Amadori-GPEtn) lipid ion abundances between age-matched control and diabetic rat retina and erythrocyte samples, 36 weeks after treatment with streptozotocin. (A) Ratios of the Amadori-GPEtn to GPEtn lipid abundances for the most abundant GPEtn(18:0/22:6) lipid observed in the control and diabetic retina lipid extracts. Data values are displayed as mean ± standard deviation (SD) from n = 4 control and n = 5 diabetic rats. * P < 0.05 by Student's t-test. (B) Ratio of the Amadori-GPEtn to GPEtn lipid abundances for the most abundant GPEtn(18:10/20:4) lipid observed in the control and diabetic erythrocyte lipid extracts. Data values are displayed as mean ± SD from n = 5 control and n = 6 diabetic rats * P < 0.05 by Student's t-test.
An increase in advanced glycation endproducts (AGEs) in diabetes is well documented and has been extensively studied over the last decade. 75,76 Moreover, serum levels of AGEs are known to be increased in patients with diabetic complications compared with a complications-free cohort. 77,78 However, AGE inhibitors have been shown to be effective in preventing the development of diabetic complications in animal models. 79,80 Although most prior studies have focused on AGE modified proteins, the free amino groups of amino-phospholipids, such as GPEtn and GPSer, can also be targeted for nonenzymatic glycation, leading to the formation of glycated phospholipids. 81 Indeed, glycated GPEtn, referred to as Amadori-PE in the literature, has been shown to be increased approximately twofold in the blood plasma of type 2 diabetic patients compared with controls, 82 consistent with the results described above. Addition of synthetic Amadori-PE to human umbilical vein endothelial cell culture significantly increased angiogenic factors, including matrix metalloproteinase 2, 83 a pivotal enzyme in the initial step of angiogenesis. 84 Although the magnitude of the changes observed here in Amadori-GPEtn lipid abundances in both the retina and erythrocytes requires further confirmation using an internal Amadori-GPEtn standard, 66 these data clearly demonstrate for the first time that increased Amadori-GPEtn levels are observed in the retinas of type 1 diabetic animals, indicating a potential role for this lipid in diabetic retinopathy. Furthermore, these changes are correlated with those observed in the erythrocytes of these animals, indicating that erythrocyte Amadori-GPEtn levels could potentially act as bio-markers for diabetic retinopathy.
Conclusions
We have demonstrated for the first time that retina phospholipid metabolism is altered in a rat model of type 1 diabetes. Although fluctuations in total retinal phospholipid levels at 6 and 36 weeks of STZ diabetes were not reflected in the abundances of erythrocyte phospholipids, a trend toward increased incorporation of linoleic acid(18:2n6) and decreased esterification of DHA(22:6n3) was observed in GPCho of both retina and erythrocytes at each time point. Furthermore, we have reported the first demonstration that glycated (Amadori) phosphoethanolamine lipid species are increased in retinas of diabetic rats. The significant elevation of Amadori-GPEtn in both diabetic retina and erythrocytes may enable the future use of blood or plasma Amadori-GPEtn levels as a predictor of the onset of diabetic retinopathy.
To facilitate future lipidomic analyses, we have also compared two different methods of lipidome quantification. We found no difference in the results obtained for retina lipid analysis when quantification was performed against exogenously added internal standards, or through the use of an “internal standard-free” comparison of MS/MS product ion abundances. However, the two quantitative methods did not provide identical results in the analysis of erythrocyte lipids, as the “internal standard-free” method may have been influenced by differences in ionization efficiencies across samples. This suggests that “internal standard-free” quantification of lipidomic data may be feasible as a simple and efficient alternative to “absolute quantification” strategies; however, rigorous optimization of sample extraction, preparation, and analytical conditions must be considered imperative before “label-free” analysis of diverse sample types. Overall, the automated tandem MS-based approach to lipidome analysis described in this study should facilitate future research in biomarker discovery across a wide spectrum of diseases, and assist in general comparative lipidomic analyses regardless of the desired application.
Acknowledgments
The support for this work was received from the National Institutes of Health (EY-016077 to JVB).