
Abstract
If microfluidic devices capable of rapid genetic analysis are to affect clinical diagnostics, they ultimately must be capable of carrying out more than ultra-rapid electrophoretic separations. The last half decade has seen a groundswell of activity in defining miniaturized DNA sample preparation methodologies that can be integrated with chip-based electrophoretic separations. Successfull integration of PCR-based DNA amplification and solid-phase DNA sets the stage for integrated microminiaturized analytical systems with
Introduction
Integrated microfluidic platforms offer a unique solution to many of the problems currently encountered in genetic analysis. First and foremost, traditional genetic analyses require multiple, time-consuming sample processing steps, involving different instrumentation and sample handling steps for each process, creating ample opportunity for cross-contamination or loss of sample during transfer. Integrated microfluidic systems, however, present the unique possibility for automated sample handling, reducing user-intervention, sample manipulation, and the instrumentation required to perform the analysis. In addition to reducing the time, cost, and handling required to accomplish these processing steps, integrated microfluidic systems inherently reduce the amount of sample required for, and reagents consumed during, the analysis. As a direct result of the miniaturization of these systems, more efficient analysis is achieved, with cost efficiency realized by reduced reagent consumption. Paramount to impelling the clinical diagnostic community to embrace microfluidic-based genetic analysis technology, however, will be clear-cut benefits that strike at the heart of their needs. These not only include faster, more efficient, and automated analyses, but will also require on-board sample processing such that sample in-answer out capabilities are realized.
James P. Landers, Ph.D.
Although we have witnessed almost two decades of development toward efficient DNA separations on microfluidic systems, developments in microchip-based sample preparation systems has lagged for a significant portion of that time. A substantial developmental effort had been placed in chip-based PCR by the new millennium, but it has only been recently that a focus on developing chip-integratable DNA purification systems has been established with a focus on a diagnostic platform that yields rapid, efficient, and timely results. 1 Creating integrated microfluidic systems for DNA diagnostic analysis is not trivial from a “systems integration” perspective. The microelectronic counterpart of a microfluidic chip, although more complex in structure, is more simplified in one critical way—the electrons flowing through various domains of the complex architecture are, for all intents and purposes, identical. Microfluidic chips present a new challenge in this respect, because the fluids flowing through different functional domains of the chip can be phenomenally disparate—as is the case for genetic analysis. Although electrophoresis and PCR-based amplification of DNA occur in innocuous aqueous buffer systems, DNA extraction often does not, as silica-based systems are typically the purification methods of choice. With these methods, sample is loaded in 4–6 M guanidine HCl (where DNA is driven onto the silica surface), washed with 80% isopropanol or ethanol (which removes nonspecifically bound analytes, such as proteins and lipids), and DNA eluted in trisbuffer. Beyond the fact that this methodology requires the use of harsh reagents, such as chaotropes (guanidine HCl) and organic solvents (isopropanol, ethanol), these reagents are potent contaminants for the chemistry carried out in the PCR and separation domains. Consequently, systems integration of the extraction step with these downstream techniques is challenging and requires new ways of manipulating solution compatibility and chemistry, fluidic interfacing, device engineering, and computer control and automation. In other words, the firmware, hardware, and “chemware” must all be carefully considered and optimized to create a multi-component, multi-functional design that can accommodate a process as complex as genetic analysis.
We have previously reported on a fully integrated device, the microfluidic genetic analysis (MGA) microchip, capable of accepting a biological sample and detecting the presence/absence of bacterial pathogens.
2
The technical advances in the MGA system were notable on several fronts. First, it was the first microfluidic device to demonstrate
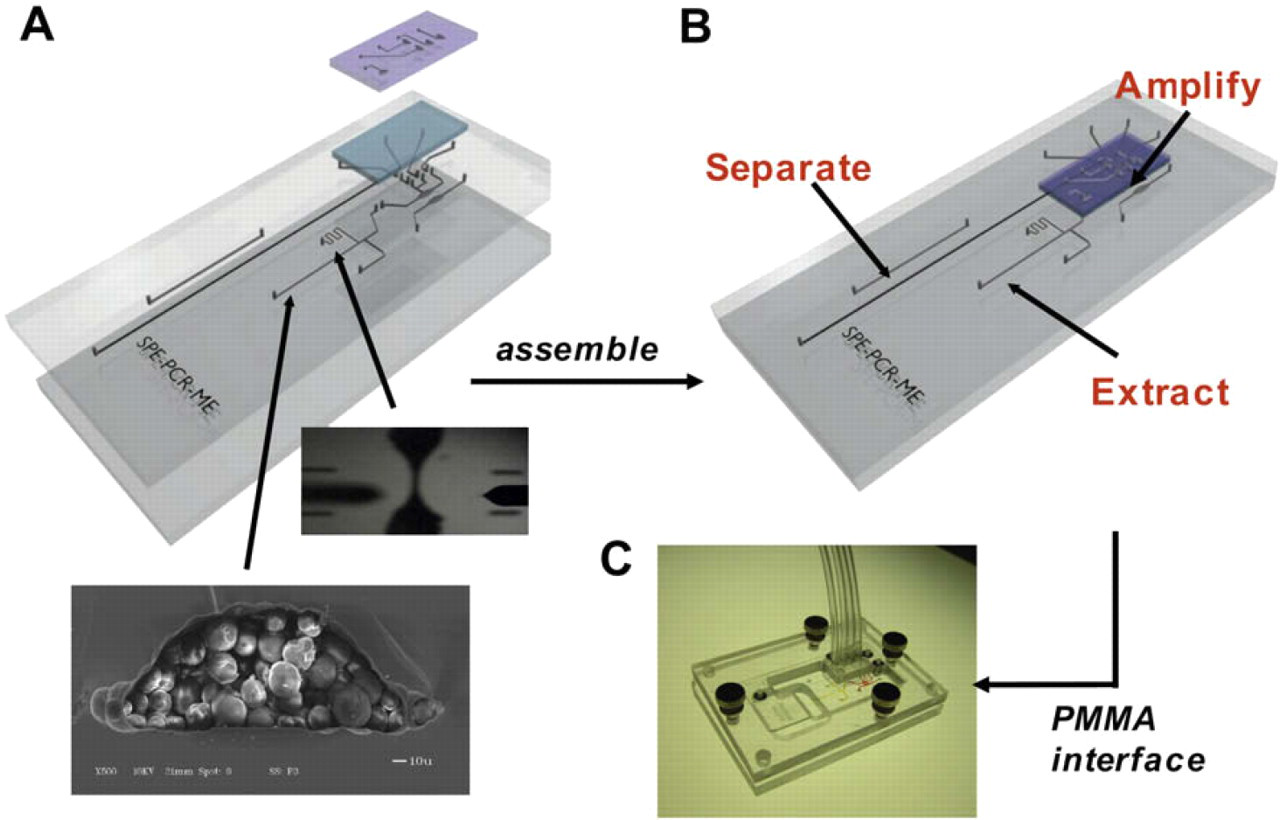
Illustration of the MGA device. The four layers are displayed both (A) unassembled and (B) assembled. In the unassembled illustrations, the upper image displays a magnified view of the etched weir. The lower image displays a scanning electron micrograph of a silica bead/sol–gel packed channel. (C) A photograph of the device loaded into the PMMA manifold. Details of microchip fabrication and assembly can be found in references 2 and 8.
The integrated MGA system was used for detection of multiple pathogens from different biological samples. As a first test of the MGA, blood samples were obtained from asymptomatic mice that had received an intraperitoneal injection of
Detection of
Tailoring the Chip-Based Sample Preparation Methodologies to Clonality Assays
To assist in the diagnosis of T-cell lymphoma through the identification of a clonal T-cell population, DNA analysis is conducted either by Southern blot hybridization, or through PCR amplification of fragments on the T-cell receptor (TCR) gene to specifically detect VJ rearrangements within this gene. Both methods are used to ascertain the clonality of a cell population; polyclonal, representing a normal population of cells (in a “negative” sample) and monoclonal, representing the unregulated growth of a single cell (a TCL positive sample; Fig. 3). Although Southern blot hybridization is considered to be the gold standard, it is labor-intensive, time-consuming, and has additional drawbacks. For example, a large mass (15 μg) of intact high molecular weight DNA is required, not only enormous by current standards, but also challenging to recover from samples such as formalin-fixed tissue. As a result, PCR-based methods are quickly gaining popularity in clinical laboratories. 10 In TCR–PCR, consensus V-region and J-region primers are used to amplify across the V–J rearrangement on a segment of the TCRγ gene to identify the clonality of a cell population; monoclonal T-cell expansions produce a single (or small number of) uniformly sized fragment(s) that predominate in the product and polyclonal T-cell expansions produce a spectrum of fragment sizes with no predominant fragment(s). PCR products are traditionally separated either in an electrophoretic gel or by using capillary gel electrophoresis to separate single-stranded DNA fragments with multi-color laser-induced fluorescence detection. Examples of the electrophoretic separation of amplified fragments from the TCRγ gene in patient samples are shown in Figure 3 for both the slab gel (A) and the capillary electrophoretic (B) separation.
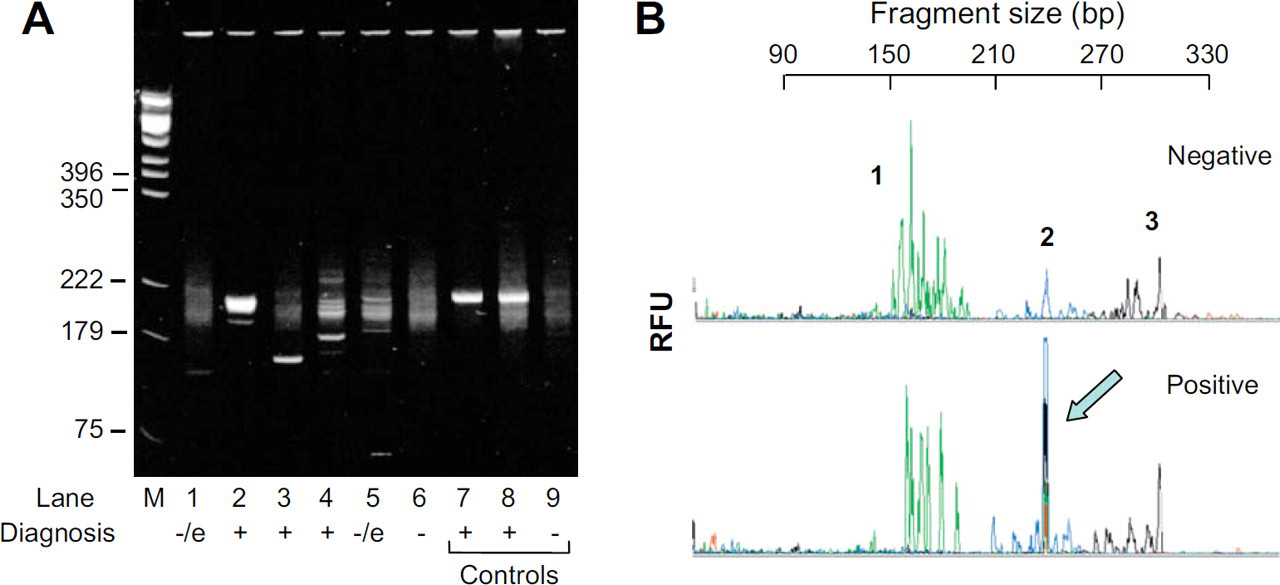
Electrophoretic separation of amplified products from the TCR–PCR. (A) Agarose gel electrophoresis showing the separation of PCR products, the positive and negative lanes are represented with a + and –, respectively, at the bottom of the lane; the –/e represents a negative/equivocal sample. (modified from Munro et al., 21 1998). (B) PCR was performed on both negative (top) and positive (bottom) TCL patient samples. Three different regions can be seen on both electropherograms. Monoclonal T-cell expansions produce a single (or small number of) uniformly sized fragment(s) that predominate in the product (identified by the arrow); polyclonal T-cell expansions produce a spectrum of fragment sizes with no predominant fragment(s).
In developing the next generation MGA device(s)—in particular, one that could potentially be applied to the diagnosis of T-cell lymphoma (TCL)—simplifying the design and functionality of the microchip containing all three of these functionalities (DNA purification, amplification, and separation) has obvious advantages. The design of the
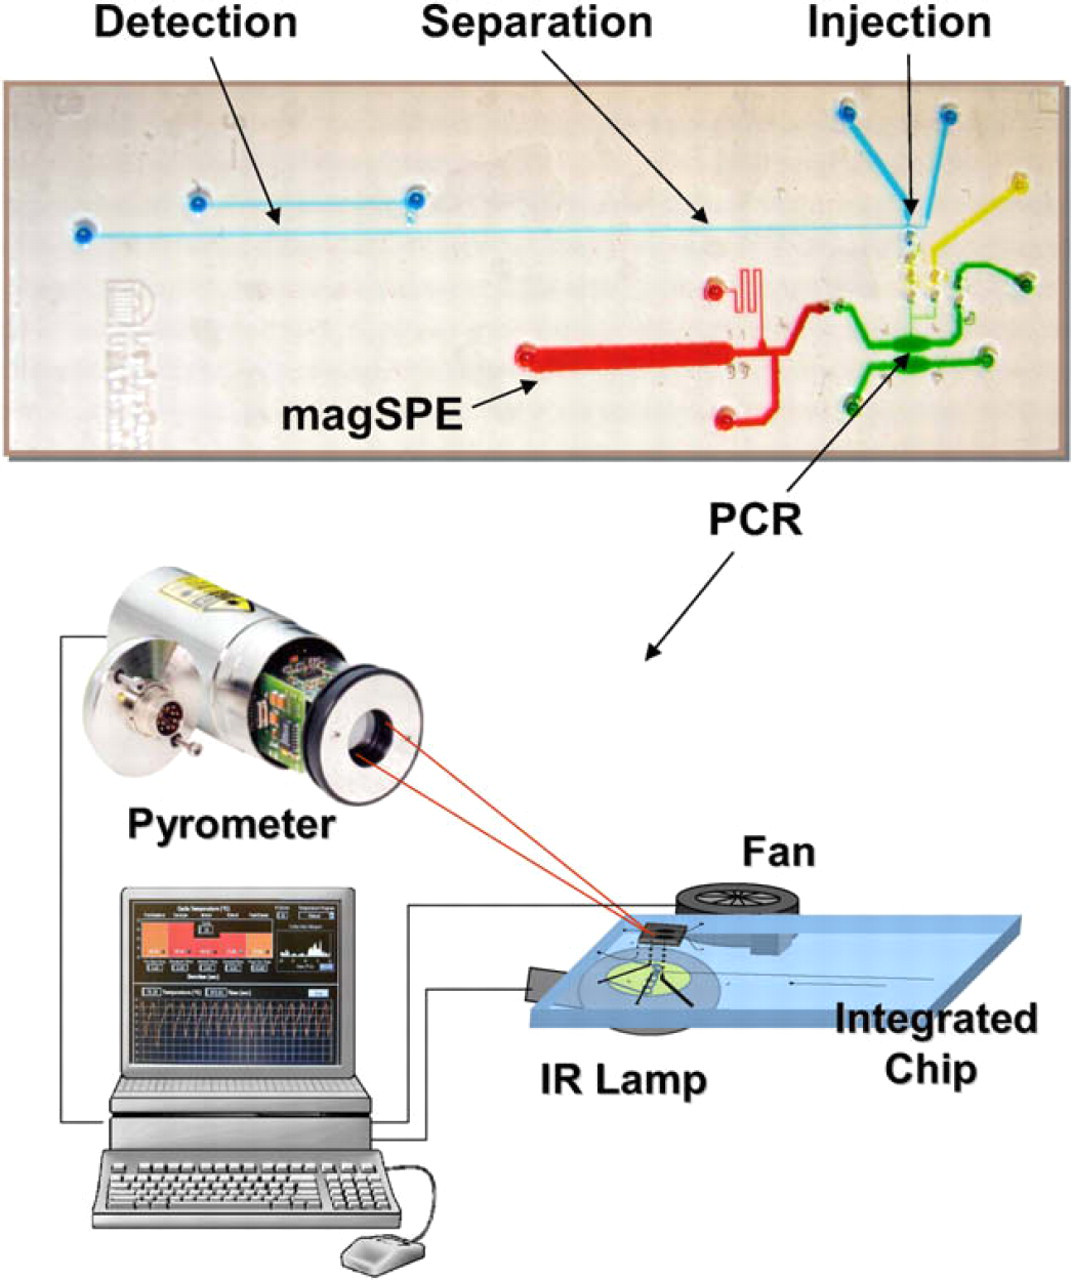
The T-cell Clonality Assay (TCA) microchip. The different colors indicate the different domains on the chip, DNA extraction (red), PCR (green), injection (yellow) and separation and detection (blue). The inset (lower right) illustrates the set-up for infrared-mediated PCR (modified from Roper et al., 2007).
DNA Extraction
The extraction of larger volumes of sample (whole blood) is critical to the assays used to detect monoclonality correlative of blood cancers—probing a larger volume enhances the chances of obtaining a genetic profile for rare (neoplastic) cells. There were two potential approaches that we entertained to achieve this. The first was to use a solid phase with higher capacity, to exceed the 0.2 μL limit associated with most of the microchip-based solid-phase systems we have developed. 11 -13 Wen et al. 14 showed that a novel two-stage microdevice created by the on-chip integration of a C18 reverse phase column for protein capture with a monolithic column for DNA extraction could allow for 10 μL load of whole blood, improving the capacity of DNA extraction by ∼ 50-fold. The second approach, and the one of choice for the clonality assay, supplants the conventional packed-bed silica bead approach by using silica-coated magnetic particles for a “dynamic” silica-based purification. Although our laboratory has had much success in the past with packed columns—“static” silica-based DNA extraction methods—the fact that nanograms of DNA are eluted from the solid phase in 5–10 μL of elution buffer is problematic for an integrated microdevice focused on a T-cell clonality assay (Fig. 5A), where higher concentrations of DNA are desired. Although this elution volume is certainly less than the 200 μL associated with commercial DNA extraction columns, this volume is large relative to the volume of the chip-based PCR chamber (∼ 500 nL) used in the MGA system. 2
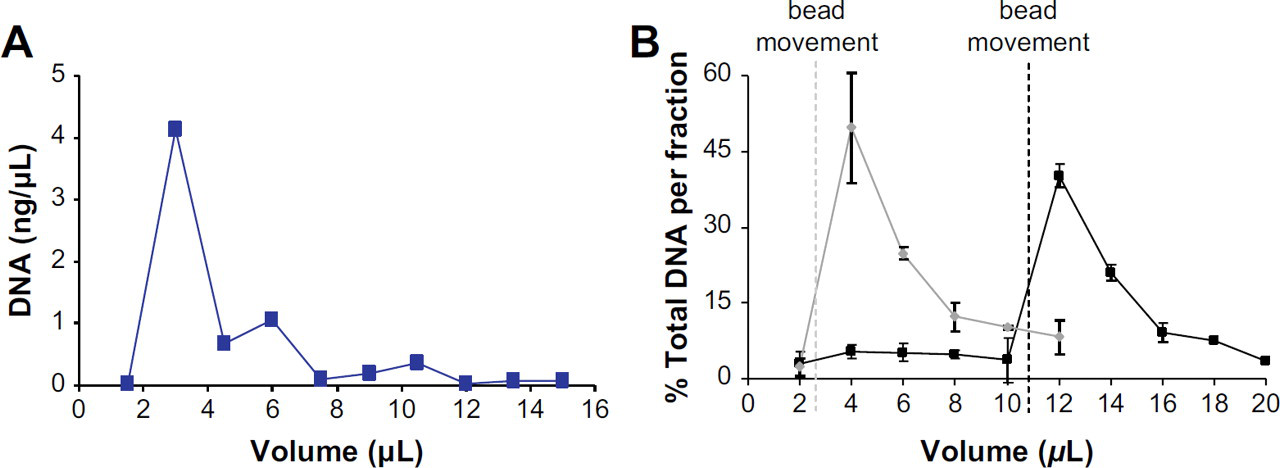
Chip-based DNA extraction. Elution profiles for the two methods for SPE, (A) static and (B) dynamic. (A) The SPE profile from a static solid-phase bed (modified from 4). The results of the dynamic DNA extraction can be seen in (B), showing that the fraction with the highest percentage of DNA eluted is released in the fraction immediately after the bead movement. The elution profile in black displays the fractions containing elution buffer before bead movement have a very little percentage of DNA present, whereas the fraction following the bead movement has the largest percentage.
To avoid using only a fraction of the total DNA extracted (∼ 10%) for PCR amplification, a dynamic SPE method for DNA extraction (silica-coated paramagnetic particles) was used. With the potential of an order of magnitude improvement in sensitivity, this becomes a viable approach for the application of an MGA system to the T-cell clonality assay. One of the advantages offered by performing SPE with this approach is the ability to elute the DNA from the solid phase in a small volume, resulting in a dual-purpose for the SPE; purification of the DNA from the sample matrix and sample preconcentration prior to PCR. Using silica-coated magnetic particles, the steps involved in the DNA extraction are controlled by the physical movement of the beads, not the introduction of solution, removing the necessity of a syringe pump-controlled flow rate and placing control into the hands of the operator. Additionally, DNA elution with this method is not initiated until the beads are moved in the elution solution. Consequently, the channel can be thoroughly rinsed to effectively remove all of the PCR-inhibiting chaotropic or organic-based solutions left from the load and wash steps, before the introduction of the DNA-containing beads. Figure 5 depicts with extractions performed in a single-process microdevice using both the “static” and “dynamic” purification methods. Figure 5A shows an elution profile from a “static packed” silica bed. Note the volume in which the DNA is eluted in ∼ 8 μL, an incompatibility with integrated systems when a PCR chamber volume of a few hundred nanoliters is considered. Figure 5B contrasts this with a “dynamic” silica bead extraction using magnetic-cored silica beads. The left profile in Figure 5B shows the results when the beads were mobilized to initiate DNA elution immediately after the collection of one fraction (2 μL volume) of elution buffer (the dashed line indicates the occurrence of bead movement during the extraction). As a result, the highest percentage of DNA collected occurred in the fraction immediately after, at 4 μL, whereas the remainder of the DNA collected decreased with subsequent fractions (similar to what was seen in a packed-bed system). The right profile in Figure 5B illustrates the benefit of being able to rinse elution buffer through the channel before initiating bead movement. In these experiments, the channel was rinsed before bead mobilization and the rinse solution, collected and assayed for DNA concentration (
T-cell Receptor-γ PCR
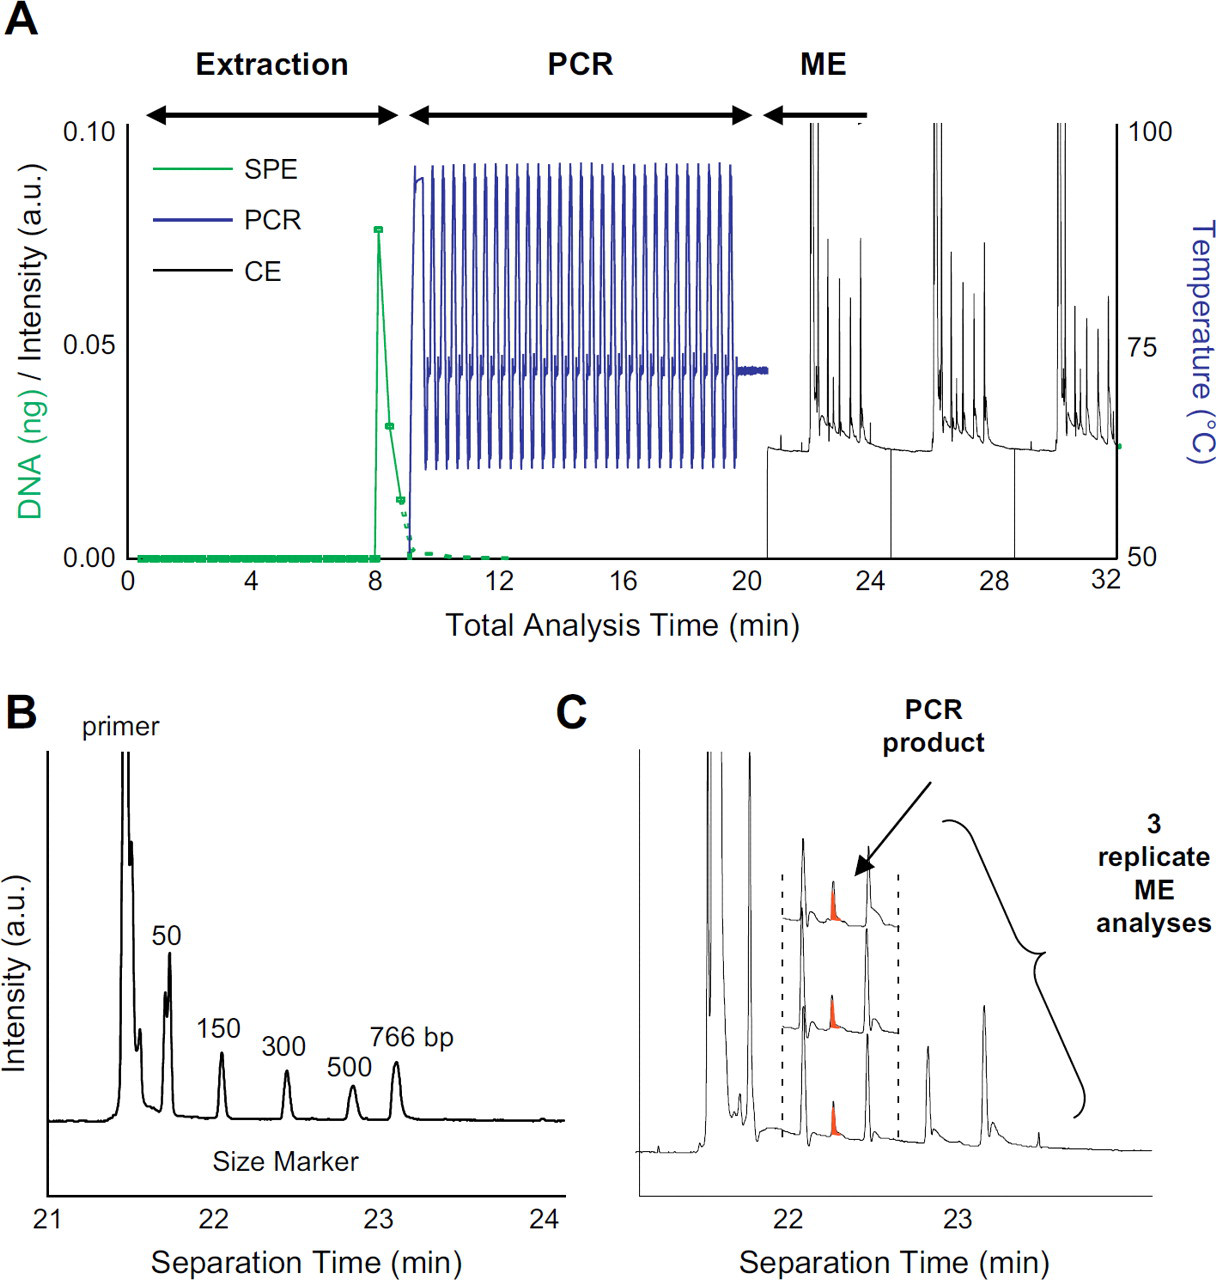
When using DNA analysis to identify a clonal cell population, the most time consuming step of the analysis is the T-cell receptor PCR (TCR–PCR). The manufacturer's protocol requires up to 3 hr when performed in a conventional thermocycler, where slow temperature transitions and long hold times are standard. A number of approaches have been defined for doing chip-based PCR, 15 -17 but our preferred method is one that we have pioneered using an infared PCR (IR–PCR) system 18 -20 for rapid, small volume thermocycling. Using IR–PCR, the solution is specifically heated using a tungsten lamp as a source allowing for rapid heating rates. By using a non-contact heating/cooling approach, the small volumes to be heated combined with a reduction in thermal mass (no metal block) permits rapid thermocycling. Moreover, as a result of the decreased sample fluid volumes inherent to microchips, solution temperature equilibration is rapid, which allows for reduced temperature dwell times. Ultimately, and without much method optimization, the TCR-PCR process was drastically reduced from 3 hr on a conventional cycler, to 25 min on the T-cell Clonality Assay chip (Fig. 6A) using IR-mediated thermocycling, both involving 40 cycles of a 3-step (denaturing, annealing, and extending) protocol. Figure 6B shows the IR–PCR products separated using capillary electrophoresis (CE). A comparison of this with the electropherogram from a “control” amplification performed in a tube (Fig. 3B) indicates a similar profile in both, with the presence of a strong, monoclonal product corresponding to a DNA fragment size of ∼240 bp. The most dramatic difference observed between the two electropherograms is the polyclonal background, which is markedly reduced compared with the “control” amplification. Although this is currently being more thoroughly evaluated, we believe that the reduction in the polyclonal background could be partially attributed to the difference in DNA starting copies between the two methods. The implementation of the microchip-based clonality assay, however, is envisioned to be used as a screening test and as such, the absence of the polyclonal background is a positive attribute, potentially allowing for easier interpretation, clearly distinguishing the strongly positive and negative samples.
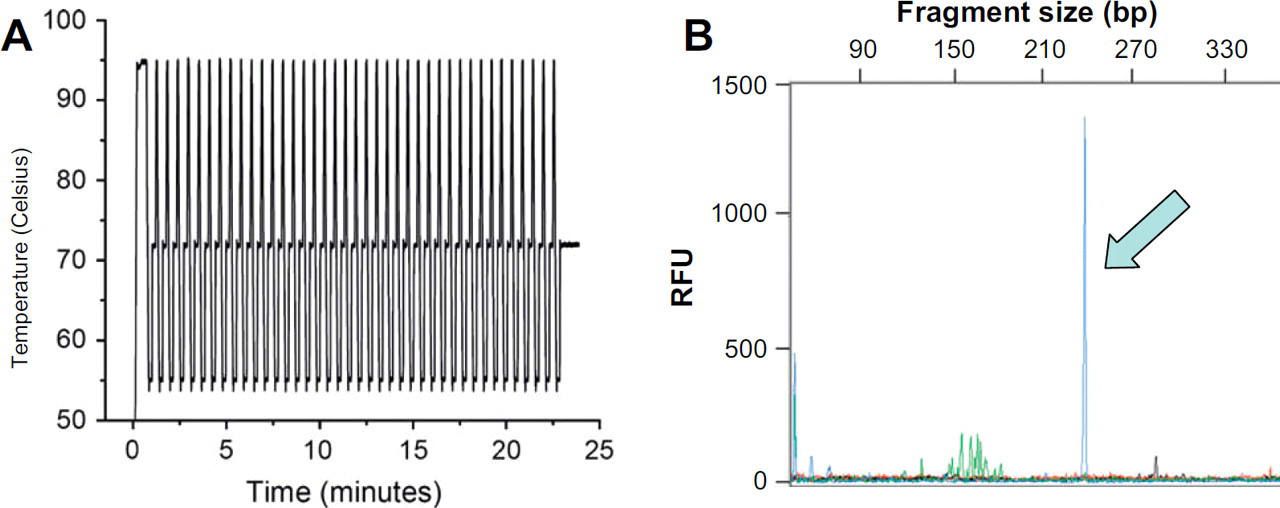
IR–PCR of a positive sample for the clonality assay. (A) The thermocycling profile for the chip PCR, requiring less than 25 min for completion of 40 cycles. (B) Capillary electrophoresis of an IR–PCR amplification of the T-cell rearrangement. The peak seen at 240 bp correctly identifies the monoclonal peak seen in the control amplification (shown in Fig. 3A).
On-chip Electrophoretic Separation of the T-cell receptor-γ PCR Products
There is precedence in the literature for the adaptation of DNA separations onto microchips to identify the presence of a clonal cell population. For example, Munro et al. microfluidically translated the electrophoresis of post–PCR products for the analysis of B-cell and T-cell lymphoproliferative disorders. 21 In this work different polymers were compared in the microchip system and a significant reduction in analysis time compared to the slab gel format—from 2.5 hr down to 160 s using microchip electrophoresis was shown. In another example, Pai et al. designed a consensus primer kappa light chain PCR method and combined it with a consensus primer immunoglobin heavy chain PCR method for the detection of malignancies in B-cell clonality. 22 The resultant PCR products were separated using both a 10% native polyacrylamide gel electrophoresis and microchip electrophoresis, to display a more rapid evaluation of the PCR products. Pilarski et al. focused their efforts toward adapting an electrophoretic separation for the detection of multiple myeloma. 23 DNA fragments generated from a PCR protocol amplifying a region of the immunoglobin heavy chain from high and low abundant template samples were analyzed by both microchip electrophoresis and a commercial CE instrument and compared. It was determined that the microchip electrophoresis system was at least as sensitive as the CE-based analysis.
One approach to simplifying the detection of a clonal cell population using an integrated microdevice, is to use a DNA separation method that is easier to interpret than the current method, but still provides the necessary diagnostic resolution. Shown in Figure 3B (upper panel) is an electropherogram corresponding to the four-color, fluorescent single-stranded DNA separation performed on a commercial instrument with an exemplary negative sample. Three groupings of peaks are observed, identified by numbers, representing a polyclonal cell population. Figure 3B (lower panel) shows an electropherogram from a patient sample that proved positive for TCL, evident by the sharp peak identified by an arrow, representative of a monoclonal cell population amidst a polyclonal background. The different fluorescently tagged primers are used to provide, in a sense, a two-dimensional separation, providing both spectral and fragment size-based information. It is interesting, however, to note that the fragment sizes resulting from the different primer-directed amplifications do not overlap, implying that the spectral resolution is not necessary. In addition, the high-resolution, single-stranded separation (single base) accomplished in the presence of urea at 60 °C provides a relatively sophisticated method that needs only discriminate between a broad band and a sharp peak.
In contrast, the microchip separation used an electrokinetic injection of the PCR products for 60 s, followed by an electrophoretic separation down a channel having an effective length of 3 cm on a simple cross-T design. With this microchip architecture, multiple patient samples were analyzed (following conventional PCR amplification) to access any patient-to-patient clonal peak variability. Figure 7 shows the results of a subset of these experiments, where two positive and two negative patient samples were evaluated. There are some distinctive features in the resultant electropherograms that help to distinguish the positive from the negative samples. With negative samples, the double-stranded DNA separation shows the presence of three broad peaks, which result from the generation of multiple fragment sizes and represent a polyconal cell population. The positive sample has a strong, sharp peak, indicating the presence of a monoclonal cell population, whereas the broad peaks on either side of the sharp peak correspond to those shown in the green and black traces in the single-stranded DNA separation. The intensity associated with the primer peak is significantly lower than the intensity of the monoclonal peaks in the positive sample, whereas it remains roughly the same as the polyclonal peaks in the negative sample. The protocol for the electrophoretic separation of these fragments using a commercial CE instrument requires upward of 35 min along with costly reagents and polymer. The transition of the separation to the microchip format allows for a much more rapid separation, along with the added benefit of less polymer required, due to the much shorter length of the microchannel.
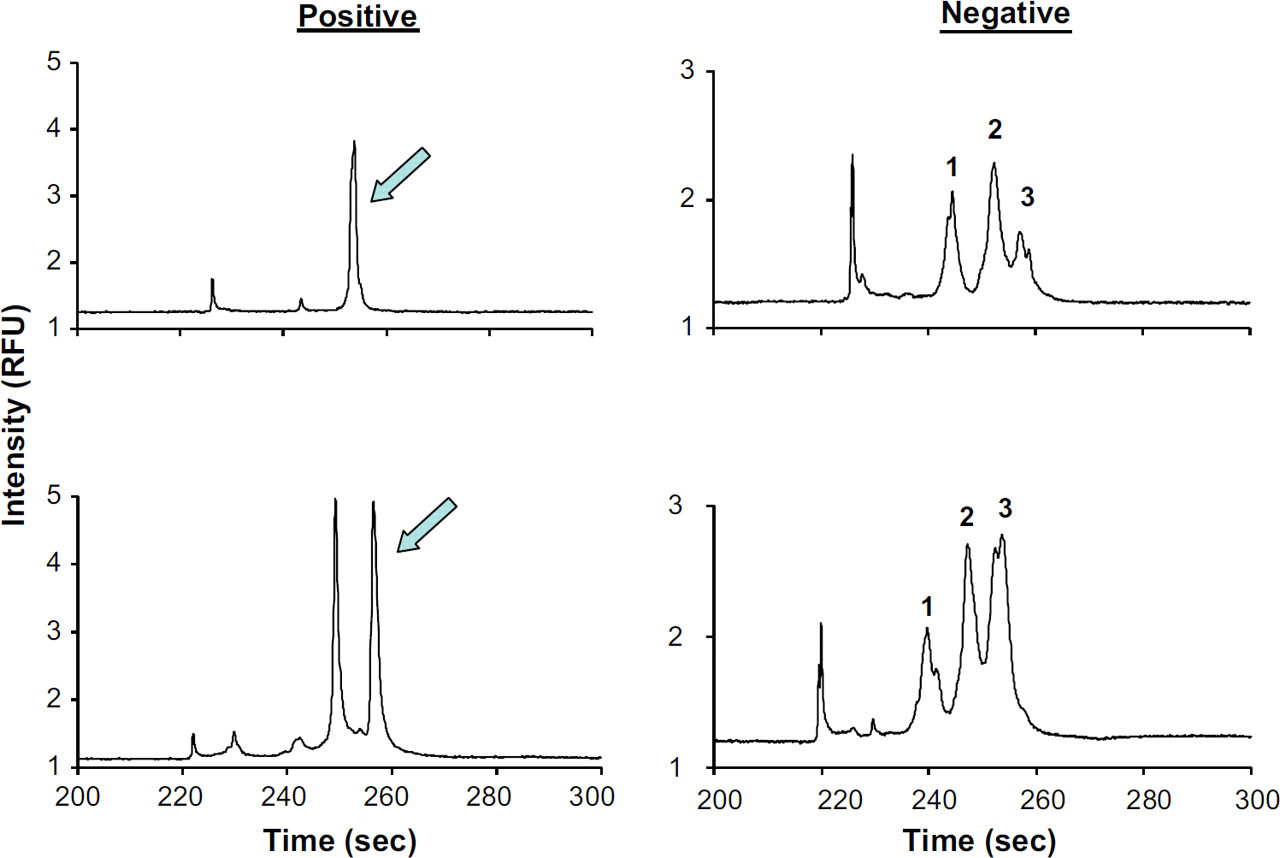
Microchip electropherograms of both positive and negative samples. Separations were performed on the microchip after PCR had been performed on positive and negative TCL samples. The negative samples show the three different regions, as seen previously in Figure 3b, and the positive show the presence of strong, dominate peak(s).
Conclusions
This article describes the initial work towards the redesign of the MGA system for the T-cell clonality assay. The use of a static silica bead bed with syringe pump-driven flow was supplanted by use of dynamic silica bead SPE using magnetic silica particles. This approach, ideal for accommodating larger sample volumes, also enhanced the sensitivity of the modified MGA system by allowing for a larger fraction of DNA extracted from the sample to be used in the PCR amplification step, when compared with the static SPE approach. Thermocycling, driven by the already proven IR-based method, allowed for dramatic reduction in the time needed to traverse through the three-temperature protocols reducing the conventional TCR–PCR process from 180 to 25 min on the chip. The microenvironment of the chip allows for significant truncation of the cycle times, in particular, the dwell times, thus leading to the same order of magnitude decrease in PCR time that microminiaturization has brought to separations. Finally, separation of the TCR–PCR products currently carried out by CE with four-color fluorescence detection under denaturing conditions requires roughly 30 min to complete. Translating this separation in non-denaturing mode (dsDNA) to the chip allows, not surprisingly, for the same information to be extracted in <300 s. The savings in time offered by the device is highly desirable when designing the microchip as a point-of-care device for use in doctors' offices, with an opportunity to circumvent “sample batching” delays by using a single-sample, single-use device. Although a larger number of patient samples need to be evaluated to ascertain the specificity and selectivity of the dsDNA separation for the clonality assay, defining and optimizing the individual chip-based processes sets the stage for integration of these processes for a sample in-answer out system for diagnosis of blood cancers.
Supplemental Experimental Details
Fabrication of Microfluidic Devices
The glass microchips were fabricated as previously reported using standard photolithography and wet chemical etching techniques. 24 Access holes were drilled into the devices using 1.1-mm diamond tipped bits (Abrasive Technology, Lewis Center, OH, USA) and thermally bonded to a glass coverplate. The microchips used in the microchip electrophoresis experiments consisted of a fluidic cross-tee architecture with a 5 cm total length and 3 cm effective length of the separation channel. The initial line dimensions used, before etching, were 50-μm wide and the channels were etched to be 50-μm deep. For IR–PCR experiments, the mask contained an ellipse 3 × 0.75 mm (length × width) with a channel (∼ 11 mm long and 50-μm deep) on each side of the ellipse leading to a drilled reservoir for fluidic access. A chamber identical to the PCR domain was placed adjacent to the PCR chamber, to serve as a reference chamber for temperature monitoring; the fluidic channels attached to the ellipse are approximately 5-mm long and 50-μm deep. The channels were etched to be around 175-μm deep, corresponding to an ellipse volume of approximately 320 nL. After thermal bonding, a 7 × 8 mm rectangular area above and below the chamber was etched an additional 200 μm to increase heating rates. The DNA extraction microdevice consisted of a simple straight channel with a total length of 1.5 cm and a distance of 1 cm to the weir. The channel had an initial line width of 1 mm and was etched to be 200-μm deep. The distance between the weir was at least 50 μm (the only function of the weir was to define the length of extraction domain, it did not retain the magnetic particles).
DNA Extraction
MagneSil paramagnetic beads were used as the solid phase. To store the beads, 30 μL of beads were removed from the stock bottle, placed into a 1.5-mL tube, the supernatant removed and replaced with 100 μL 8 M guanidine–HCl (GuHCl) dissolved in 80/40 mM MES/tris–buffer pH 6.1 (which will now be referred to as the load solution). Of the above prepared bead solution, 5 μL were loaded into the microchannel by placing an external magnet above the channel and using a vacuum to pull the bead solution into the channel. The DNA extraction method involves first spreading the beads out within the channel and introducing the load solution mixed with purchased human genomic DNA. The solutions were replaced in the channel using a pipette or a syringe connected to the outlet via and negative pressure was applied manually. Using an external magnet, the beads were moved throughout the depth of the channel (by alternating the position of the magnet from above to below the channel) so that the beads covered all of the volume of the channel. To wash the beads, an 80% ethanol wash solution was introduced into the channel. The beads were then moved throughout the channel to release proteins and other cell lysis components. DNA elution was achieved by introducing a 1 × PCR buffer (10 mM tris–HCl, 50 mM KCl pH 9.0), supplied by Fisher, quickly moving the beads throughout the channel, and eluting the DNA into a volume equivalent to the volume of the chamber. All resultant SPE fractions were collected during the elution and analyzed using a Picogreen fluorescence assay.
Microchip PCR
For the T-cell rearrangement (TCR) PCR, the final concentrations used were 10 mM tris, 50 mM KCl pH 8.3, 4 mM MgCl2, 0.2 μM of each primer (primers obtained from Mayo Clinic), 0.2 mM dNTP, 2 mg/mL bovine serum albumin and 0.5 units/μL
Microchip Electrophoresis
The separation channel was first conditioned with a 15-min rinse of 1 M HCl, followed by the application of a duramide coating. The coating was applied by first rinsing a 0.25% (w/v) solution in water through the channel for 5 min, and then allowing the solution to settle for another 10 min. The solution was then removed from the channels and the LPA-
Conventional Methods
All samples used for the experiments involving T-cell lymphoma (TCL) were discarded samples obtained from the Mayo Clinic (Rochester, MN, USA). All patient information was removed before the samples were obtained. A Qiagen MiniElute Spin Column was used for DNA extraction per manufacturer's instructions to purify the blood samples. The TCR–PCR was performed per manufacturer's instructions for amplification and the electrophoretic separation was performed on an ABI 310 using POP-4 and four-color laser-induced fluorescence detection (Applied Biosystems), per manufacturer's instructions.