
Abstract
The cerebrospinal/serum albumin ratio (Q Alb) is a measure of cerebrospinal—blood barrier permeability, where dysfunctional barriers have been associated with a variety of disease states. Thus, the ability to accurately quantify albumin has critical diagnostic importance. The current work uses chip electrophoresis as an alternative methodology to the conventional immunoassay for quantifying cerebrospinal fluid (CSF) albumin. With variable concentrations of bovine serum albumin normalized to a chicken albumin internal standard, the electrophoresis system demonstrated signal correlation with a best-fit polynomial (R 2 = 0.9993) (concentration range of 7.8–1000 mg/L). Interchip and intrachip variation studies conducted on patient CSF demonstrated coefficient of variations of 0.1–17%. Chip electrophoresis detected an average of 24% greater albumin than the immunoassay in patient CSF samples (n = 58), indicating the ability to detect immunoreactive and non-immunoreactive forms of albumin. Finally, the correlation of CSF albumin concentration to Q Alb determined by chip electrophoresis (r 2 = 0.8683) was comparable with that determined by immunoassay (r 2 = 0.8390). Therefore, this work demonstrates proof-of-principle that chip electrophoresis can serve as an alternative method for quantifying total (immunoreactive and non-immunoreactive) albumin in CSF.
Introduction
Cerebrospinal fluid (CSF) is actively secreted by the choroid plexus into the ventricles of the brain, where it then passes into the subarachnoid space and cushions the brain and spinal cord. 1,2 CSF is an ultrafiltrate of plasma and contains salts, small molecules, peptides, and proteins. 3,4 The passage of the material from blood vessels in the choroid plexus stroma to the CSF in the ventricles is regulated by epithelial cells overlying the choroid plexus, which form the CSF–blood barrier. 5
Albumin comprises the dominant protein in CSF, encompassing 35–80% of the total protein. 6 Measurements of albumin in CSF and blood (CSF/serum albumin ratio, Q Alb) have been used to assess CSF–blood barrier permeability, 7 –9 where alterations in this barrier may provide diagnostic information for various disease states. 10 –12 Dysfunctional CSF–blood barriers have been reported in individuals with multiple sclerosis, 13 –16 Alzheimer's disease, 17,18 neuropsychiatric systemic lupus erythematosus, 19 acute disseminated encephalomyelitis, 20 neuroborreliosis, 13 Angiostrongylus cantonensis meningoencephalitis, 21 and depression. 22 Thus, the accurate quantification of cerebrospinal albumin would have important diagnostic implications.
We previously developed an assay to quantify low concentrations of albumin in urine (microalbuminuria) using chip electrophoresis. 23 This electrophoretic method measured higher urinary albumin concentrations than the conventional method of immunologic detection, supporting the previously proposed presence of non-immunoreactive albumin. 24,25 Given the significant role of the CSF/serum albumin ratio (Q Alb) in assessing disease, an accurate and sensitive method of measuring albumin in CSF is important. Therefore, in the current work, we assessed whether chip electrophoresis could serve as a viable method to quantify total albumin in CSF, including the non-immunoreactive form which is not detected by immunoassay.
Methods and Materials
Chip Electrophoresis
The Experion Pro260 Analysis Kit was developed by Bio-Rad Laboratories (Hercules, CA) for the semiquantitative determination of proteins (Fig. 1). We adapted this methodology for the quantitative determination of albumin in CSF by adding chicken albumin (CA) as an internal standard. The Experion automated electrophoresis system uses Caliper Life Sciences(Hopkinton, MA) LabChip 90 microfluidic separation technology and fluorescent sample detection to perform an automated analysis of 10 protein samples per chip. Briefly, sodium dodecyl sulfate (SDS) in the manufacturer's buffer binds to the protein in the analyte. Fluorescent dye then binds to the SDS micelles, and dye fluorescence as a measure of protein concentration is quantified by laser. The manufacturer's gel and dye were used, and the chip was primed with gel using the supplied priming station according to the manufacturer's instructions. Each albumin sample (66 kDa) was mixed with the supplied sample buffer and a CA (44 kDa) internal standard. The components and proportions for each mixture were as follows: 20 μL sample to be tested (CSF or bovine serum albumin (BSA)), 20 μL CA internal standard (60 mg/L), 8 μL supplied manufacturer's sample buffer, and 312 μL HPLC-grade water. Of the total mixture of 360 μL, 6 μL was then loaded into a single well of a 10-specimen well chip. Electrophoresis was conducted without the addition of β-mercaptoethanol or heating, and the results were compared with the supplied sizing ladder to yield an approximate relative size under the nondenaturing conditions.
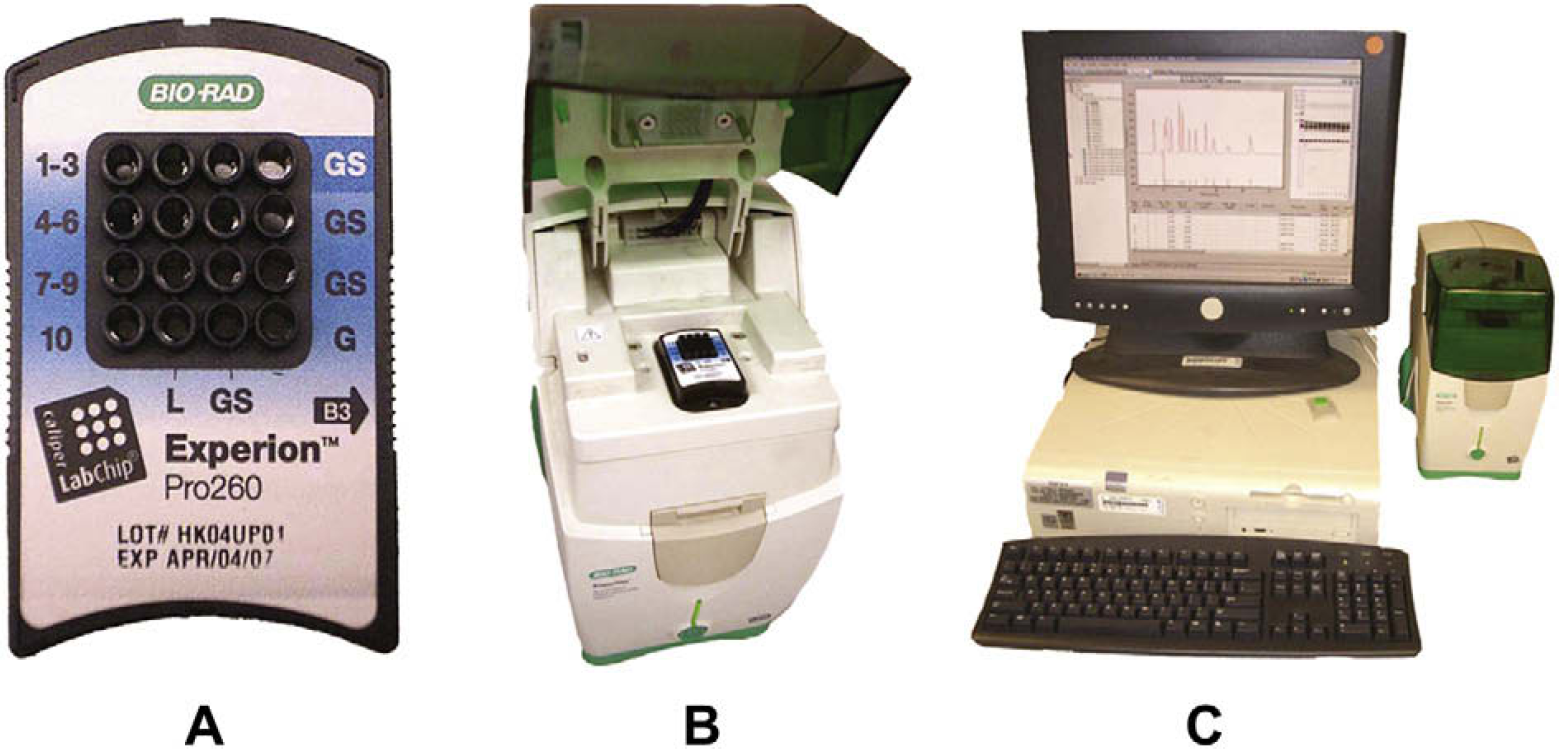
Chip electrophoresis system: the Experion Automated Electrophoresis System. (A) Single electrophoresis chip (magnified) demonstrating 10 sample wells and additional gel reservoir wells and ladder well. (B) Experion Automated Electrophoresis Station with loaded chip. (C) Experion Automated Electrophoresis System adjacent to computer with analytical software.
Immunoassay
Total protein and albumin from patient CSF were quantified on a Synchron LX20 Pro (Beckman Coulter, Fullerton, CA) using standard protocols.
Purified Proteins and Reagents
BSA and CA were acquired from Sigma—Aldrich (St. Louis, MO).
CSF Specimens
Excess consecutive samples were obtained at the VA San Diego Healthcare System from patients who had submitted their CSF for total protein testing using immunoassay. Patient identities were not divulged, and confidentiality was respected at all times. This protocol was approved by the University of California Human Research Protection Program using existing tissue (IRB030627).
Statistical Analysis
All statistical analyses and graphs were generated with GraphPad Prism version 4.03 (San Diego, CA).
Results
Fifty-eight samples of human CSF were assayed using chip electrophoresis. Serving as an internal standard, a constant amount of CA was added to each CSF sample before assaying on the chip (final concentration of 60 mg/L). As illustrated in a representative electropherogram of patient CSF, human albumin (HA, 66 kDa) and CA (44 kDa) 26,27 clearly resolved from each other (Fig. 2A). Also, CA was detected before HA, which has a higher molecular mass. Finally, the electropherogram illustrates that HA comprises the dominant protein in CSF.
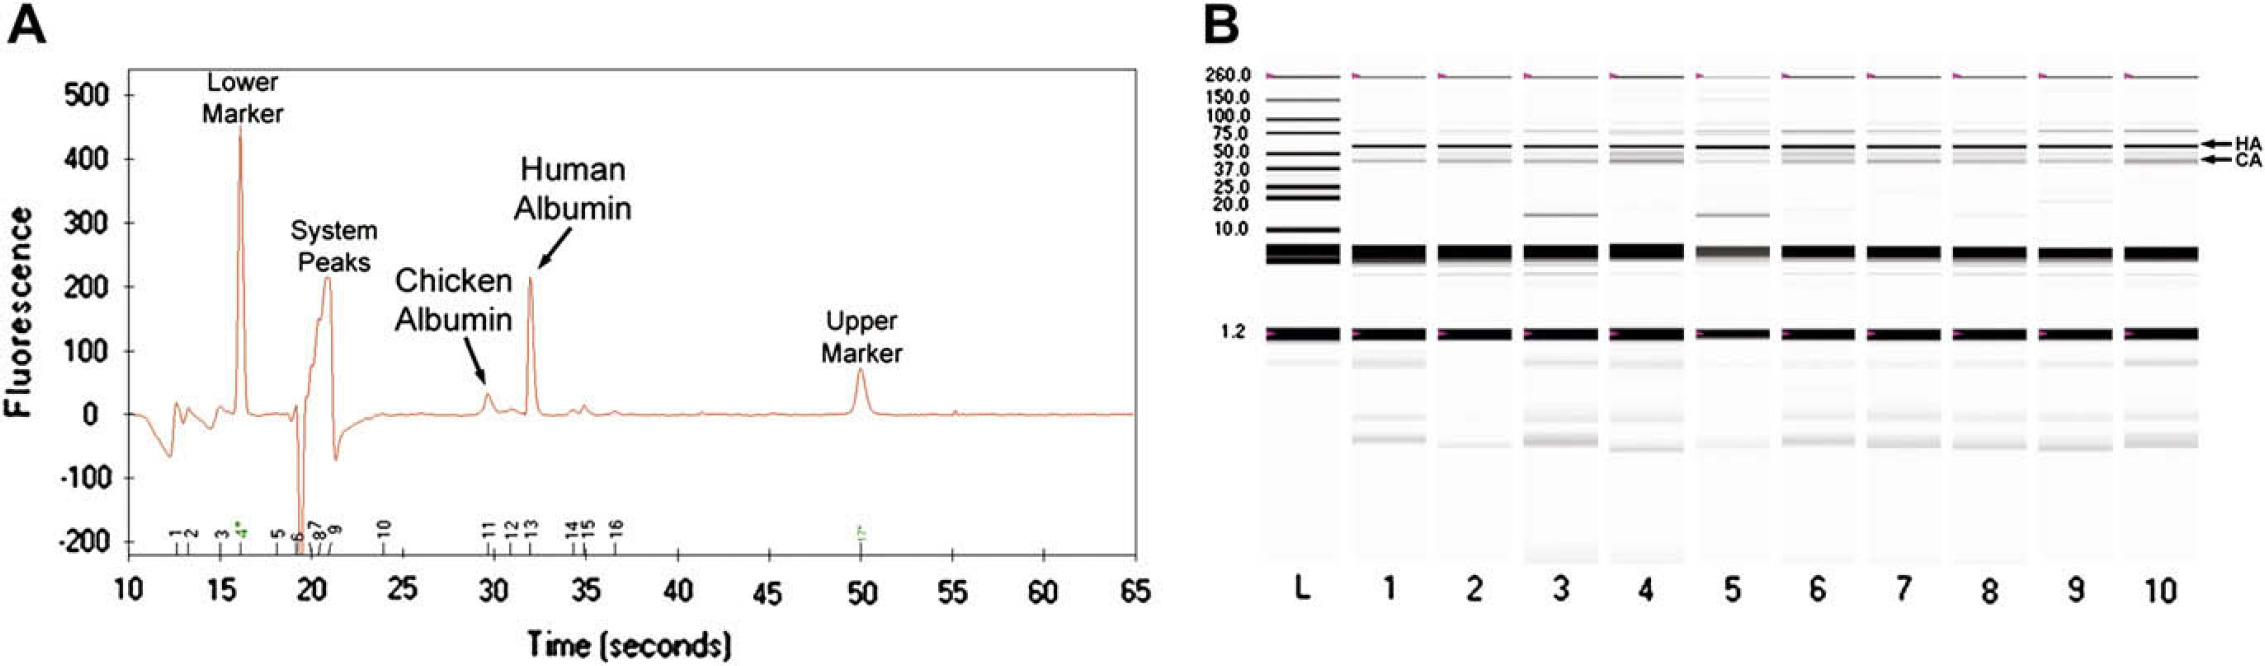
(A) Electropherogram of a single patient CSF sample. The added CA internal standard (∼44 kDa, 60 mg/L) resolves from HA (∼66 kDa). (B) Virtual electrophoresis gel of patient CSF samples. Ten representative patient samples are demonstrated in lanes 1–10. HA (∼66 kDa) and the added CA internal standard (∼44 kDa, 60 mg/L) are illustrated with respect to the protein-sizing ladder in lane L.
The data from each electropherogram are analyzed by the instrument software, and a virtual electrophoresis gel is created. Each chip enables the examination of 10 samples plus a protein-sizing ladder. The ladder confirms the molecular mass of HA relative to CA. Representative patient CSF samples are depicted (Fig. 2B), recapitulating a similar albumin migration pattern as observed in our previous work with urinary albumin. 23
To assess assay linearity, variable concentrations of BSA up to 1000 mg/L were assayed by chip electrophoresis. Purified BSA was used as a surrogate for HA because the two proteins have similar molecular masses of ∼ 66 kDa. 28,29 Additionally, BSA is a readily available and inexpensive reagent that can be obtained by all laboratories. CA again acted as an internal standard, and the concentration of CA was kept constant (60 mg/L) for each BSA sample, which was shown to provide near-linear results. 23 Then, each BSA concentration plus CA was electrophoresed without the addition of a reducing agent, as in our previous work. 23
The ratio of the BSA peak area to the CA peak area was calculated for each well. This ratio was then plotted against the known BSA concentration (Fig. 3). Although nearly linear, a polynomial gave the best fit. This trendline generated from two individual chips demonstrated correlation in the tested range of 7.8–1000 mg/L (R 2 = 0.9993). This best-fit polynomial was used subsequently to calculate future albumin concentrations.
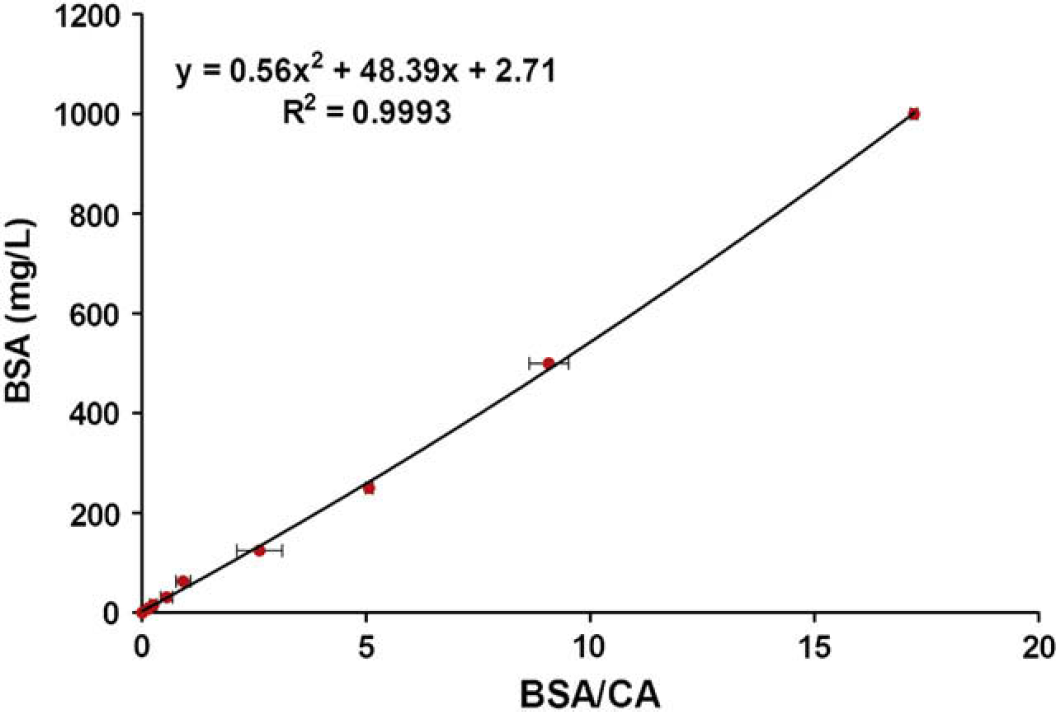
Chip electrophoresis: BSA standard curve. The ratio of the peak area of BSA to the peak area of the CA internal standard was plotted versus the known concentration of BSA. The displayed graph is the average of two chips. The error bars represent standard deviations. The dynamic range is from 7.8 to 1000 mg/L. This generated best-fit polynomial was used to calculate future albumin concentrations.
Assessment of assay precision was conducted using patient CSF. Four specimens were characterized first by immunoassay (“A” = 73.5 mg/L, “B” = 121.6 mg/L, “C” = 256.3 mg/L, “D” = 516 mg/L). Then, each of these CSF specimens was assayed in duplicate or triplicate on a single 10-well electrophoresis chip; and this procedure was conducted on four different chips to identify the intrachip and interchip variations, respectively (Table 1). Regarding the variation within a single chip (“intrachip”), the coefficient of variations (CVs) for the four CSF specimens ranged from 0.1% to 17%. For the variation among different chips (“interchip”), the CVs ranged from 7% to 10% for the four CSF samples.
Intrachip and interchip variations for detecting CSF albumin
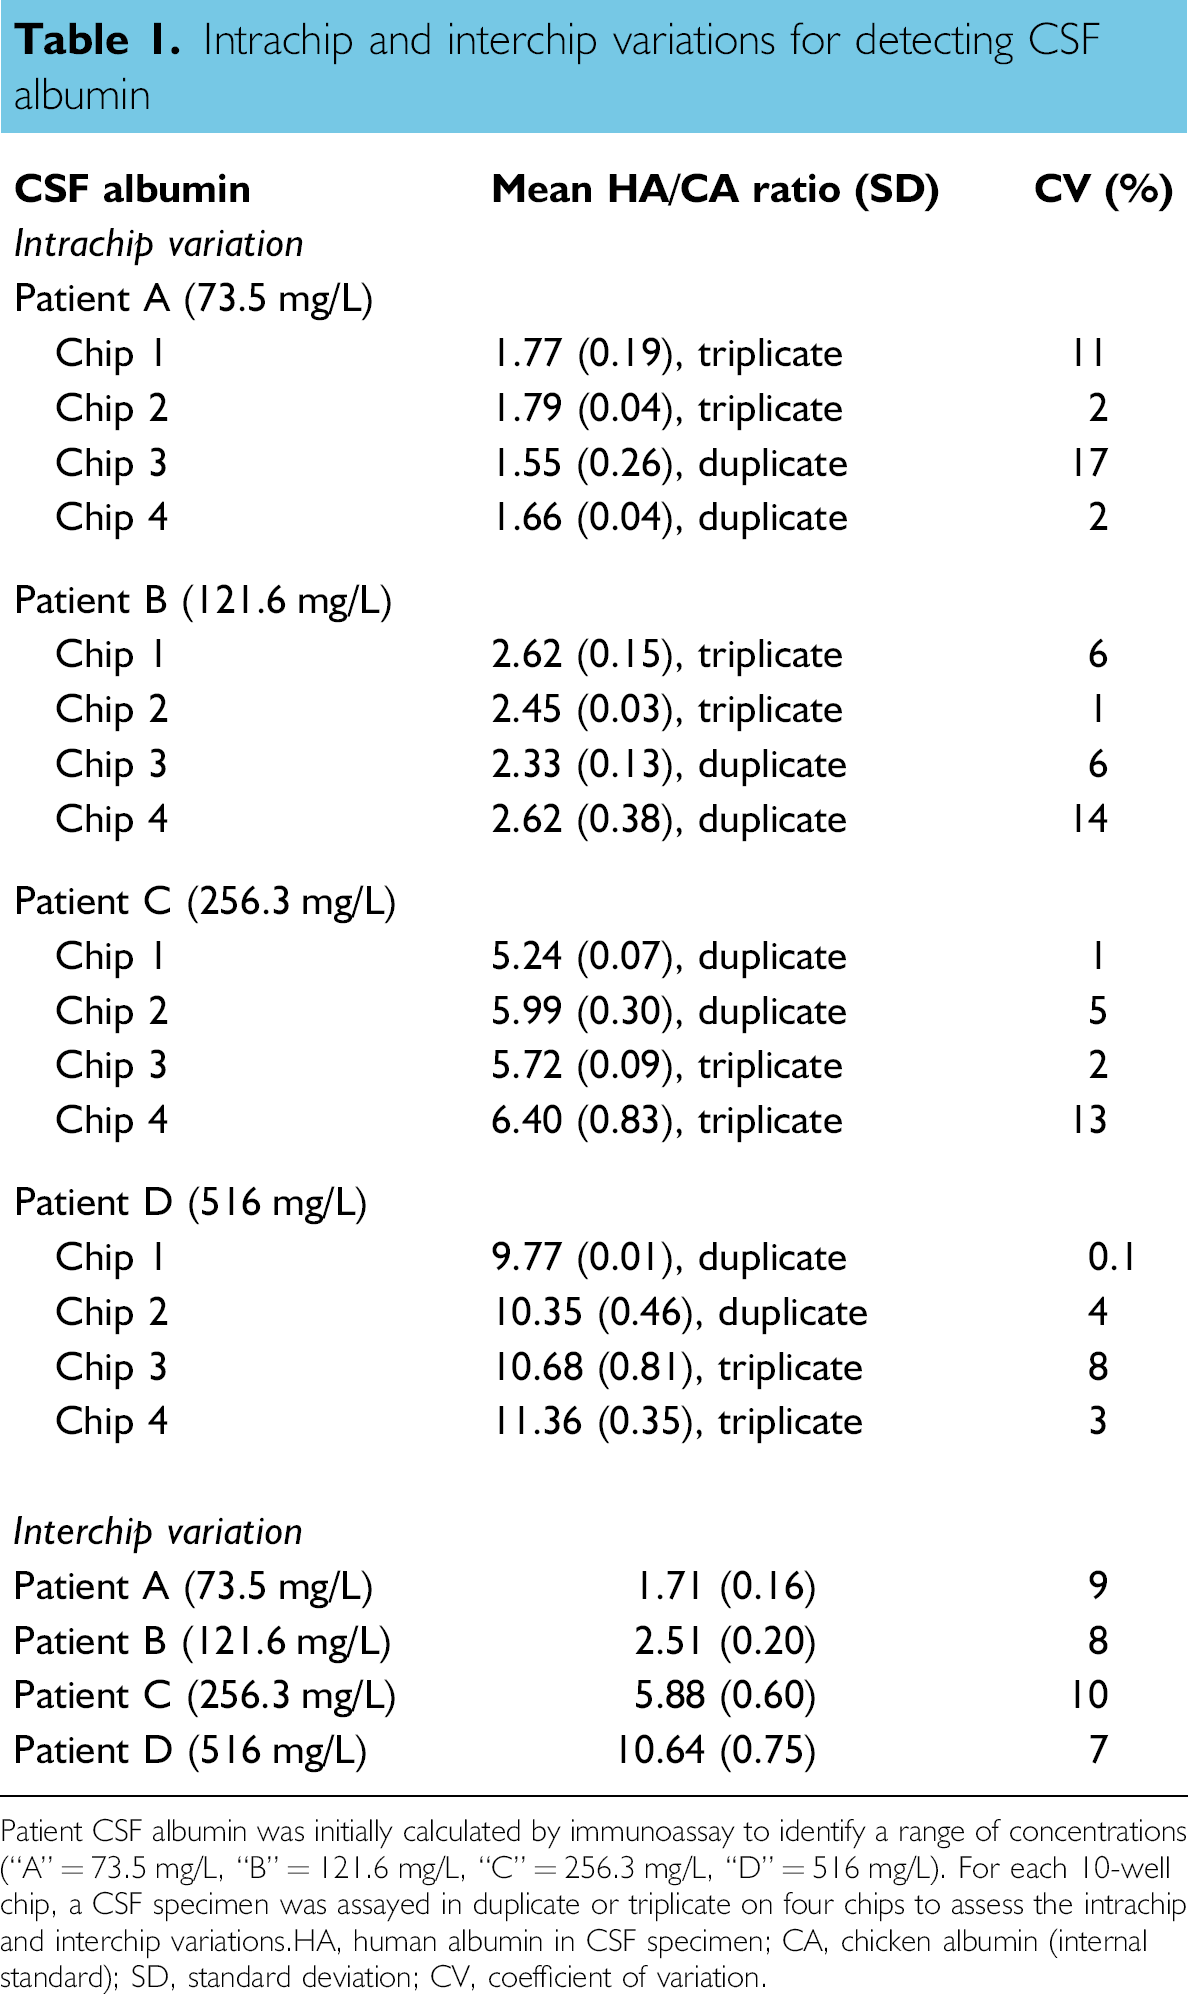
Patient CSF albumin was initially calculated by immunoassay to identify a range of concentrations (“A” = 73.5 mg/L, “B” = 121.6 mg/L, “C” = 256.3 mg/L, “D” = 516 mg/L). For each 10-well chip, a CSF specimen was assayed in duplicate or triplicate on four chips to assess the intrachip and interchip variations. HA, human albumin in CSF specimen; CA, chicken albumin (internal standard); SD, standard deviation; CV, coefficient of variation.
To quantify the albumin in each CSF specimen, the ratio of the HA peak area to the CA peak area (HA/CA ratio; obtained by the electropherograms) was calculated first for each specimen. Then, the value of this HA/CA ratio was applied to the polynomial generated from the previous calibration curve, representing the relationship between the HA/CA ratio to known albumin concentrations (Fig. 3). 23 The concentration of albumin was determined in this manner for each patient CSF specimen.
Previous investigations have characterized the presence of non-immunoreactive albumin in urine and showed how immunoassays underestimated the actual total albumin concentration. 23 25 –, 30,31 To assess whether this phenomenon was also observed in CSF, we compared the albumin concentrations detected by conventional immunoassay with those detected by chip electrophoresis using the same CSF specimen (Fig. 4). The generated best-fit curve between immunoassay and chip electrophoresis was nearly linear (Fig. 4A), yielding a correlation of r 2 = 0.9318.
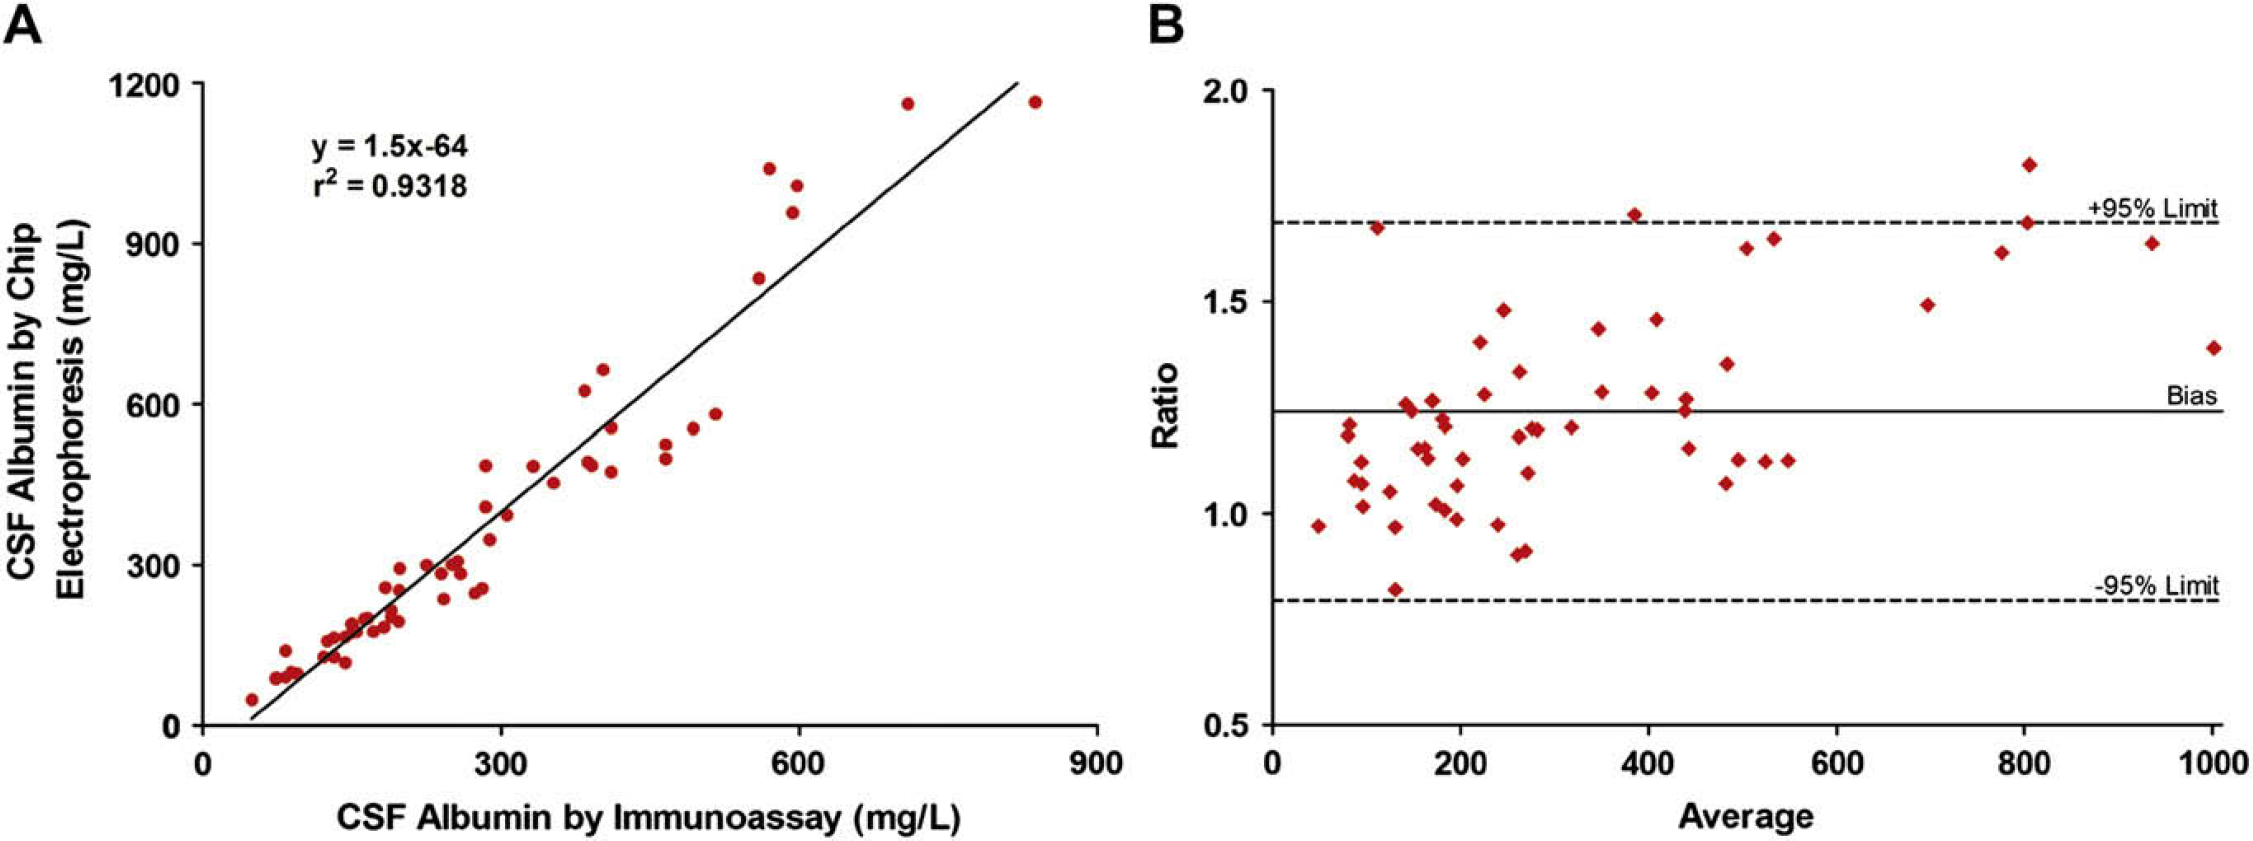
(A) Albumin concentration in patient CSFs as detected by immunoassay versus chip electrophoresis (n = 58 patient samples). Chip electrophoresis detected an average of 24% more albumin than the immunoassay did. (B) Bland–Altman graph comparing CSF albumin detection by chip electrophoresis with immunoassay (n = 58 patient samples). The average of the albumin concentrations by chip electrophoresis and immunoassay is depicted on the x-axis. The ratio of the albumin concentrations by chip electrophoresis to immunoassay is shown on the y-axis. The dotted lines represent the 95% limits of agreement (0.79–1.69). The bias was 1.24.
Additionally, we compared chip electrophoresis with immunoassay using the Bland–Altman method (Fig. 4B). The graph demonstrated that all except two of the data points (n = 58) fell within the 95% limits of agreement. Also, the scatter of the plots indicated that the chip electrophoresis albumin values were not merely a fixed increase in the immunoassay values. Furthermore, chip electrophoresis detected an average of 24% more albumin in CSF than the immunoassay did (range 82–182% of albumin concentration by immunoassay). As noted in the previous work in urine, the CSF albumin concentrations enumerated by immunoassay were underestimated.
With the significant role that the CSF/serum albumin ratio has in assessing disease, we compared the CSF albumin concentrations with their respective Q Alb values (when the patient serum albumin values were available) (Fig. 5). CSF albumin as determined by immunoassay demonstrated a correlation of r 2 = 0.8390 with their Q Alb values (Fig. 5A). CSF albumin as quantified by chip electrophoresis revealed a slightly increased correlation (r 2 = 0.8683) to their Q Alb values (Fig. 5B).
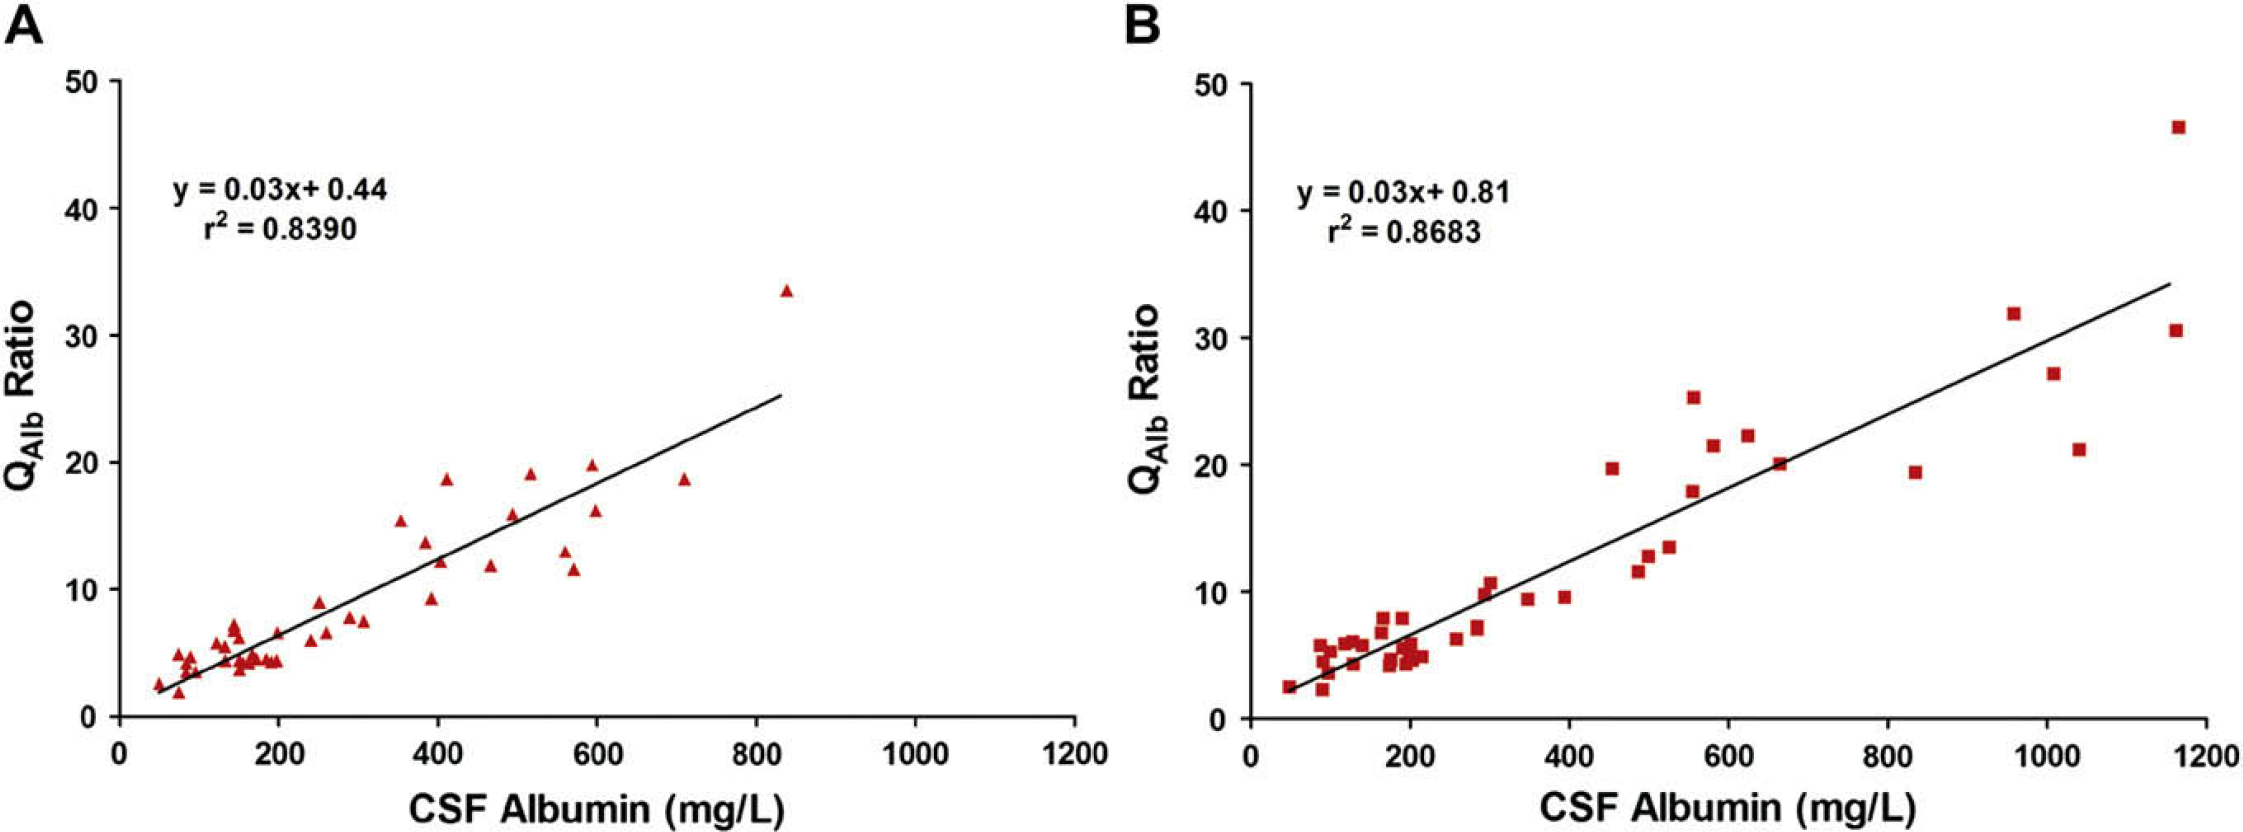
CSF albumin concentration versus CSF/serum albumin ratio (Q Alb). The Q Alb was calculated by dividing a patient's CSF albumin concentration by the patient's serum albumin concentration (n = 44 patients with known serum albumin ± 1 day of CSF retrieval). The Q Alb was then compared with CSF albumin concentrations as determined by (A) immunoassay or (B) chip electrophoresis.
Conclusion
In the present work, we developed a chip electrophoresis assay that could serve as an alternative method to quantify albumin in CSF. The impetus for this study was borne out of the desire to identify a sensitive and accurate assay to measure albumin in CSF. This CSF albumin quantification could then be applied to calculate Q Alb, which has diagnostic implications in various CSF–blood barrier disease states.
Usage of the chip manufacturer's protein markers to quantify albumin did not yield accurate results (data not shown). However, introducing CA as an internal standard in our assay enabled the accurate quantification of HA in CSF specimens. The differences in the molecular weights of CA and HA allowed the two proteins to resolve easily during electrophoresis (Fig. 2) and highlighted the value of CA as an internal standard. It is postulated that CA is successful as an internal standard because its physiochemical characteristics are very similar to HA.
As a result of our modifications, our chip electrophoresis assay demonstrates signal linearity with increasing albumin concentration in the range of 7.8–1000 mg/L (Fig. 3). This current assay is also robust, having been tested previously with multiple agents (i.e., lysed erythrocytes, high salt, and high glucose) without any significant interference. 23 Intrachip and interchip variations demonstrated CVs of 0.1–17% (Table 1), which is comparable with the manufacturer's specifications (Bulletin #5423, www.bio-rad.com). Also, Pandey et al. described a similar method using CA as an internal standard to quantify urine microalbumin with the Caliper Protein 200 Chip in the Agilent 2100 Bioanalyzer (Santa Clara, CA). 32 Using their chip electrophoresis system, Pandey et al. reported intrachip and interchip CVs ranging from 0% to 13.5%, 32 which were comparable with the CVs in the current work (Table 1). Additionally, Pandey et al. did an evaluation of the variation due to different chips, electronic and optical variables. They found that when a single preparation of a 75-mg/L sample was run in all 10 wells of five chips, the mean relative response varied from 0.97 to 1.00 with CVs ranging from 0.17% to 1.3%. This demonstrated the robust analytical characteristics of this method. Most of the variability in run-to-run analysis of the same sample through the entire preparative process is thought to be due to manual pipetting variability.
The advantage of chip electrophoresis over immunoassay is that the detection of albumin by electrophoresis is not dependent on protein antigenicity. This is particularly significant due to the existence of non-immunoreactive forms of albumin. 24,25,30 Indeed, chip electrophoresis detected more albumin than did immunoassay in urine 23 and in CSF (Fig. 4). Therefore, chip electrophoresis appears to have greater sensitivity than immunoassay due to the ability of chip electrophoresis to detect both immunoreactive and non-immunoreactive albumin.
To assess the relationship between CSF albumin and the CSF/serum albumin ratio, correlations of Q Alb to CSF albumin detection using the different methodologies were calculated (Fig. 5). Chip electrophoresis had a slightly greater correlation to Q Alb than did immunoassay (r 2 = 0.8683 vs r 2 = 0.8390). This indicates that the ability to predict the CSF/serum albumin ratio using albumin quantification by chip electrophoresis is comparable with, if not slightly better than, immunoassay.
An appealing feature of the chip electrophoresis method is the ease of use and relatively fast throughput. With this assay, adequately trained personnel could test 30 CSF specimens (three chips) in ≤ 2 h (approximately 15 samples per hour). Most of the time was consumed by the automated electrophoresis (walk-away time of 30 min per chip). Although the current assay serves to demonstrate the proof-of-principle for protein quantification by chip electrophoresis, it is amenable to further improvement in efficiency. Our assay or assays for other proteins could use automated systems, such as the LabChip 90, that test greater numbers of specimens with less labor and would decrease per-sample assay cost. This would enable the methodology to be applied to analyses in large reference laboratories or for large pharmacology studies.
In conclusion, the current work demonstrates the ability of chip electrophoresis to sensitively quantify albumin in the CSF. This work supports the existence of non-immunoreactive albumin in the CSF, in addition to that previously described in urine. The current work demonstrates the proof-of-principle that chip electrophoresis is a viable method to assay CSF albumin. Finally, the ability to detect both immunoreactive and non-immunoreactive albumin by chip electrophoresis could potentially detect smaller impairments of the CSF–blood barrier and, thereby, allow earlier therapeutic intervention.
Acknowledgment
We gratefully acknowledge Bio-Rad Laboratories for their material support of the Experion Automated Electrophoresis System.