
Abstract
This paper presents an in-depth investigation of the dilution effect from the liquid handlers equipped with fixed tips resulting from mixing with residues of the system liquid used to wash the inside and outside of the fixed tips. The impact of the dilution in bioanalytical sample preparation was evaluated. The liquid-transfer steps, where the dilution effect should be minimized or eliminated in bioanalytical sample preparation, were the sample dilution, and the standard (STD) and quality control (QC) sample preparation steps. The level of the dilution effect for the red dye was quantified by using the dual-dye photometric measurement. A significant dilution effect was observed for the red dye, indicating that without a proper liquid-transfer strategy to minimize it, it would be impossible to prepare serially diluted STD and QC samples because of the cumulative dilution effect. The impact on the bioanalytical results was substantial, especially when a multistep dilution scheme was used for the sample dilutions. A unique liquid-transfer strategy was designed in our lab to minimize the dilution effect for the sample dilution. The effectiveness of this strategy was demonstrated using the dual-dye photometric measurement and by generating a successful STD curve preparation of a model compound, Compound A, in dog plasma for an LC/MS/MS assay. With this strategy, high-quality bioanalytical sample preparation without the dilution effect could be achieved by using the liquid handlers equipped with fixed tips.
Introduction
High-throughput bioanalytical sample preparation with multichannel liquid-handling systems plays an important role in meeting the ever-increasing demands for the quantitation of drug and metabolite concentrations in biological fluids using validated bioanalytical assays. 1 –3 Most of these liquid-handling systems have eight channels with fixed or disposable tips. The common issue for the fixed-tip liquid handler is the carryover on the tips because the same tip is used to pipet different solutions and matrices during the sample preparation. Each of these fixed-tip liquid handlers is equipped with a wash station to clean the tips between the pipeting steps to minimize the carryover effect. The carryover from fixed tips can be totally avoided by using disposable tips. However, liquid handlers with fixed tips have their own advantages. Besides cost savings, study samples in tubes with pierceable caps can be transferred by a liquid handler equipped with fixed tips without opening and closing caps, which prevents aerosol generation, reduces repeated work, and eliminates potential cross-contamination due to opening and closing of the caps. 4
McCloud 5 noticed “an apparent trend of decreasing concentration on repetitive dispenses from the same tip” when a fixed-tip liquid handler was used to transfer dye solutions. The dilution from the system liquid retained on the inside wall of the fixed tip was attributed as a possible cause. The system liquid is used by liquid handlers to perform accurate liquid transfers and it is also used to wash the inside and outside of the fixed tips. Recently, a similar dilution effect was observed by several groups. 6,7 The level of the dilution effect from a one-step liquid transfer with fixed tips could be as high as 10%. 6 Several solutions, including use of extra sample volume, slow (20 μL/s) aspiration speed, and preaspirating a partition volume (this small volume of sample services as the buffer layer separating the system liquid and the real sample and avoid direct contact of these two solutions), were proposed by Lupotsky et al. 6 to minimize the dilution effect. It was found that a significant reduction of the dilution effect could be achieved by using a combination of slow aspiration speed and preaspirating partitioned volume. However, it is not always feasible to use extra sample volume or a preaspirating partitioned volume if a limited sample volume exists, such as in most toxicity studies. In addition, it is ineffective to use these approaches to prepare standard (STD) and quality control (QC) samples by serially diluting a higher-concentration STD or QC sample to a lower-concentration STD or QC sample. Before the lower-concentration STD or QC sample can be prepared, the higher-concentration STD or QC sample must be prepared and well mixed. Without an automated vortexer installed on liquid handlers, the only way to mix is by aspirating and dispensing the sample multiple times with fixed tips, which will introduce more dilution effect. To our knowledge, there are no prior reports of successful STD or QC preparation with a serial-dilution scheme by using the liquid handlers equipped with fixed tips.
In this paper, the problem of the dilution effect caused by using liquid handlers equipped with fixed tips in the area of bioanalytical sample preparation is discussed. A solution to minimize the dilution effect is proposed and demonstrated. The first successful STD curve preparation by using this strategy coupled with high-speed-dispense mixing is also reported. The term “dilution effect” is used in this paper to refer to the unwanted dilution introduced by using the liquid handlers equipped with fixed tips. Other terms related to dilutions, such as serial dilution and multistep dilution are used to refer to STD/QC preparation with a serial-dilution scheme and study sample dilution to bring the concentration of high-dose study samples within the STD curve range, respectively.
Impact of the Dilution Effect in the Bioanalytical Sample Preparation
The level of the dilution effect is related to many aspects, including what system liquid is used, how much sample volume is transferred, what compounds are involved, and how the liquid-transfer parameters are setup (such as leading and tailing air gap, aspirate and dispense speed). It is believed that the level of the dilution effect will be consistent and reproducible as long as all the related aspects are kept unchanged.
The bioanalytical sample preparation consists of three main liquid-transfer steps listed below:
STD and QC sample preparation. Sample transfer, which includes transferring different types of sample, that is, STDs, QCs, double blanks (BLKs, blank matrix without internal standard [IS]), control blanks (blank matrix with IS), and study samples, from different source vials or containers to their destination vials. Then, adding IS to all wells except for the BLKs. Extraction (solid-phase extraction, protein precipitation, or liquid–liquid extraction) and, if necessary, reconstitution.
8
The dilution effect is present in all steps where a liquid handler with fixed tips is used. The first step, STD and QC sample preparation, is normally accomplished by manual pipeting with disposable tips or by liquid handlers equipped with disposable tips. However, overcoming the dilution effect would permit full automation of this step in bioanalysis. For the extraction and reconstitution step, the dilution effect can be ignored because all types of samples (STDs, QCs, BLKs, and study samples) get the same level of the dilution effect. For the sample-transfer step, the following three scenarios are considered:
If all sample types are transferred using an equal volume by a liquid handler with fixed tips, and no dilution is required for the study samples, there will be no impact to the final results because all samples will experience the same level of the dilution effect as the STD and QC samples. If all sample types are transferred by a liquid handler with fixed tips, and dilutions for the study samples are required and done by the same liquid handler, final results will be impacted because diluted study samples receive an extra dilution effect during the additional liquid-transfer steps compared with the STD and QC samples. If only study samples are transferred by a liquid handler with fixed tips, and STDs and QCs are transferred manually using disposable tips, final results will be impacted because study samples receive an extra dilution effect. This is not a good practice and should be avoided.
Based on the above considerations, it is obvious that the only case where precaution steps need to be taken to minimize or eliminate the dilution effect is the dilution of study samples. In addition, a procedure to minimize the dilution effect for the sample-dilution step would pave a way for the automated STD and QC preparations because their preparation is actually a multistep sample dilution.
Proposed Solution to Minimize/Eliminate the Dilution Effect for the Sample Dilution in the Bioanalytical Sample Preparation
The dilution effect results from a thin film of the system liquid retained on the inside walls of the liquid paths (the fixed tips and the tubing connected to the tips). During sample aspiration, a thin layer of the system liquid will be retained on the inside wall of the liquid path. When the sample travels through this area, it will mix with the system liquid layer. When the sample is dispensed, this thin layer, a mixture of system liquid and sample, will be retained on the wall. The level of the dilution effect will depend on the surface area that the sample travels through and the affinity of the sample to the inside wall (Fig. 1). The overall effects are that the samples are diluted even though the dispensed volumes are accurate, which were reported by Dong et al. 7 All reported approaches to minimize the dilution effect required the use of an extra sample volume as a buffer layer. An assumption for these approaches was that only the leading part of the sample (buffer layer) in the liquid path suffered a significant dilution effect, whereas the sample after the buffer layer received an insignificant dilution effect. As a result, an accurate sample volume delivery with the largely minimized dilution effect could be achieved with this approach by appropriately adjusting the extra sample volume and liquid-transfer parameters, such as air gaps, speeds for aspiration, and dispense. The major drawback for this approach in bioanalysis is the use of the extra-valuable biological sample, which in many cases is very limited. As we discussed in Scenario 2, the dilution effect will only affect the bioanalytical analysis when we need to dilute samples with desired bioanalytical matrix. A new strategy was proposed in our lab to minimize or eliminate the dilution effect for sample dilutions by aspirating blank matrix before biological samples with the same fixed tip and then dispense them together at a relative high-dispense speed (600 μL/s) (Fig. 2). Actually, our new strategy did not eliminate the dilution effect but compensated by allowing the dilution into the desired biological matrix rather than the system liquid or the valuable biological samples. The strategy details are described below.
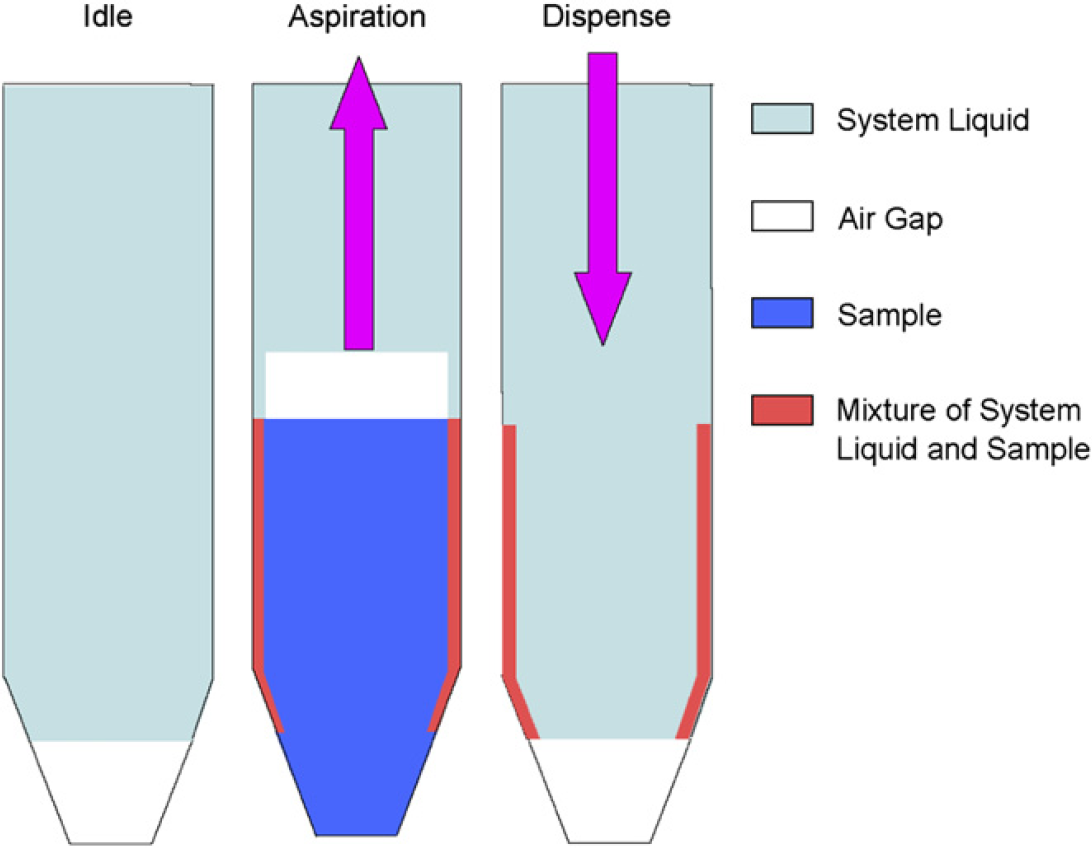
Schematic diagram of the dilution effect.
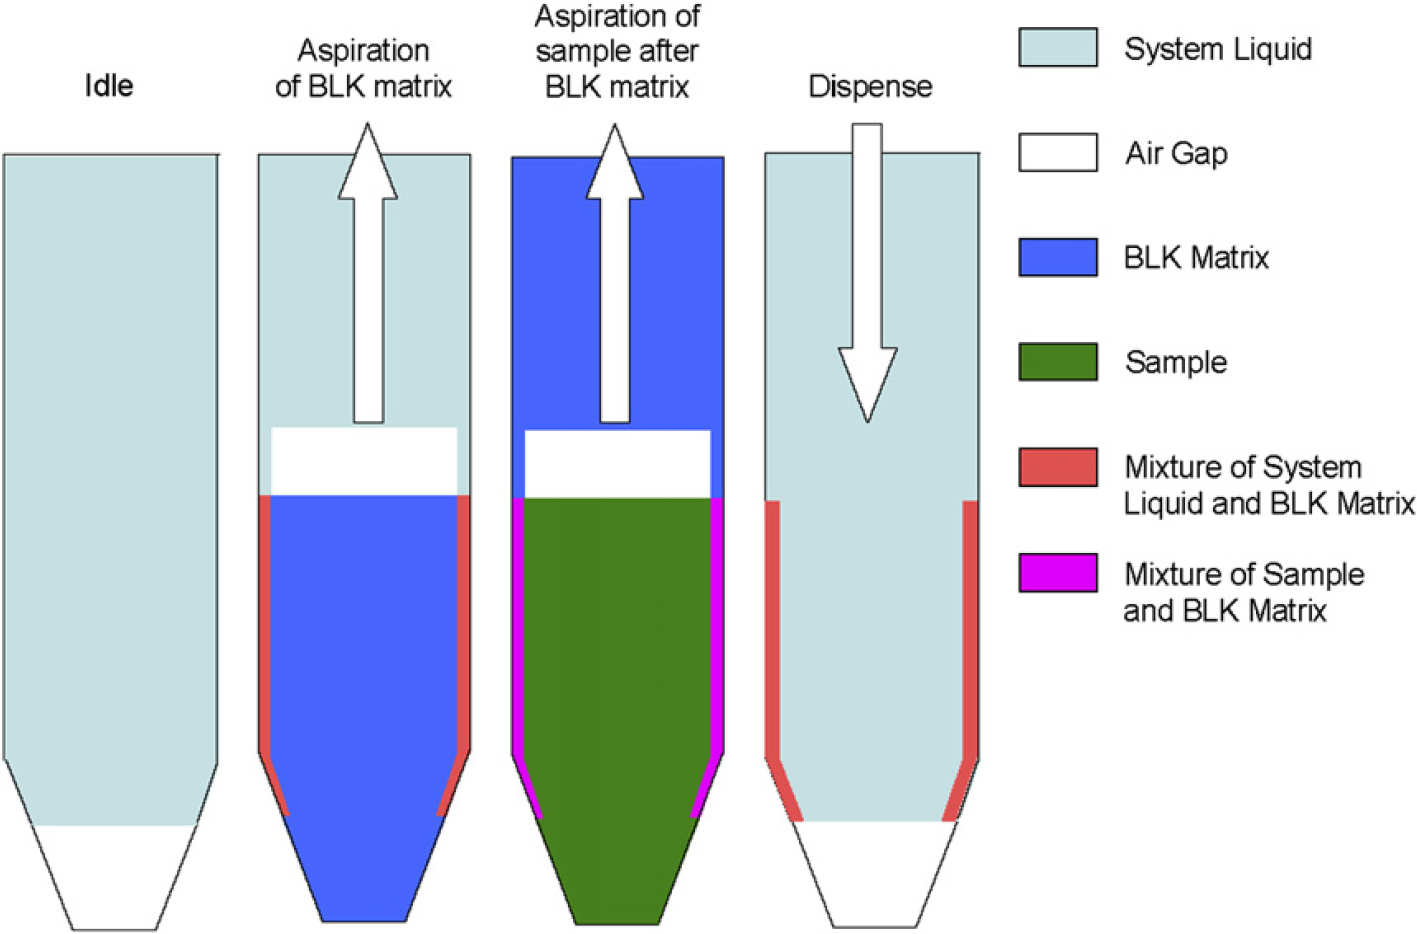
Schematic diagram of the liquid-transfer strategy to minimize the dilution effect for sample dilution.
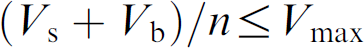
Set a dilution method (study sample volume, If

By aspirating the BLK before the study sample within a tip (shown in Fig. 2), the sheath of system liquid on the inside wall of the tip was replaced by the BLK and the sample will not make contact with the system liquid. The sample still made contact with the BLK and was diluted by the BLK. But that will not change the final concentration of the sample because the sample needs to be diluted with BLK anyway. When the BLK and the sample were dispensed, the study sample retained on the inside walls of the liquid path will be washed out by the BLK, and the dilution effect will be minimized and even eliminated depending on the DF or the ratio of
Experimental
Reagents, Chemicals, and Instrumentations
An Artel Multichannel Verification System (MVS) (Artel, Inc., Westbrook, ME) was used to measure the concentrations of the dye samples prepared by various methods. The MVS system was designed to measure dye volumes with a dual-dye photometric method, and its operating principle has been described elsewhere. 9 The MVS standard diluent, which contains blue dye only, was used to dilute the MVS standard sample Solution C, which contains red and blue dyes. The blue dye concentrations for the sample Solution C and the diluent were the same.
An LC/MS/MS system was used to analyze the bioanalytical STD and QC samples in dog plasma prepared by various methods which were listed in section Sample Preparation Procedures for Biological Samples. All LC/MS/MS data were acquired by Analyst version 1.3 on a Sciex API 4000 tandem mass spectrometer (Applied Biosystems, Foster City, CA) in a positive electrospray mode. The separation was achieved on a Phenomenex (Torrance, CA) Synergi Hydro-RP analytical column (2.0 × 50 mm, particle size 4 μm) with gradient elution using mobile phases of 0.1% formic acid (98.0+%, EMD, Gibbstown, NJ) in water and 0.1% formic acid in acetonitrile (Burdick & Jackson, Muskegon, MI). Two Shimadzu (Tokyo, Japan) LC-lOADvp pumps and a Shimadzu SIL-HTC autosampler were used as the delivery pump and autosampler, respectively. Water was purified using a Milli-Q system (Millipore Corp., Bedford, MA). Blank dog plasma was purchased from Bioreclamation, Inc. (Hicksville, NY). A basic compound, Compound A and its IS (a structural analog) B were provided by Research & Development, Bristol-Myers Squibb (BMS) Company.
Both the dye and plasma samples were prepared using a Tecan Genesis RSP 150 liquid handler (Tecan US, Research Triangle Park, NC) with fixed tips or single-channel electronic pipettes (Rainin Instrument, LLC, Oakland, CA) with disposable tips. Both the liquid handler and the electronic pipettes were calibrated gravimetrically. The accuracy and precision for the liquid handler were ±1.2% and 0.7%, respectively. The accuracy and precision for the electronic pipettes were ±0.3% and 0.3%, respectively.
Sample Preparation Procedures for Dye Samples
The original red dye concentration for the MVS standard sample Solution C was arbitrarily assigned as 500, because the actual concentration was unknown. A calibration STD curve at nominal concentrations of 1, 2, 5, 10, 25, 50, 75, and 100 for the red dye was prepared manually by serial dilution of the MVS standard sample Solution C with the MVS standard diluent using the electronic pipettes.
Three sets of dye samples with the same concentrations as the STD curve were prepared by using the liquid handler. The detailed liquid-transfer steps for each set are described below:
Liquid-Transfer Steps for Set 1 (Strategy 1):
Wash the first two tips. Aspirate sample ( Dispense the sample and BLK into a vial. Mix the diluted sample with the first tip by aspirating and dispensing a certain volume of the diluted sample twice.
Liquid-Transfer Steps for Set 2 (Strategy 2):
Wash the first two tips. Aspirate sample ( Dispense the sample and BLK into a vial. Mix the diluted sample manually with a Vortex-Genie 2 vortexer (Scientific Industries, Inc., Bohemia, NY).
Liquid-Transfer Steps for Set 3 (Strategy 3):
Wash the first tip. Aspirate BLK ( Dispense the sample and BLK into a vial with a high-dispense speed.
The mixing step for Set 3 was skipped because a highspeed dispense (600 μL/s) was used to mix the diluted sample. Based on the test results, it was found that a well-mixed solution could be achieved when the BLK and sample were aspirated into the same tip and dispensed into a vial with a high-dispense speed.
Fifty microliters of each dye sample (three replicates) was manually transferred into an MVS 96-well verification plate. One hundred and fifty microliters of the MVS standard diluent was added into the dye samples with electronic pipettes. The samples were well mixed with a VARIOMAG Teleshake (Artel, Inc., Westbrook, ME) and measured with the Artel MVS system.
Sample Preparation Procedures for Biological Samples
Stock solutions of Compound A and its IS at nominal concentration of 0.2 mg/mL were prepared in acetonitrile/water (1:1 v/v). The working solution of 20,000 ng/mL for Compound A was prepared by appropriate dilution of 0.2 mg/mL stock solution with dog plasma by using the electronic pipettes. Two sets of STD curves at nominal concentrations of 10, 20, 40, 200, 1000, 2500, 4000, and 5000 ng/mL were prepared by serial dilution of the 20,000 ng/mL working solution. The first STD curve was prepared manually by using electronic pipettes. The second set was prepared by using the liquid handler with the same liquid-transfer steps as those used for the preparation of the Set 3 dye samples. The QC samples at nominal concentrations of 30, 300, 2500, and 4000 ng/mL were prepared manually by using electronic pipettes.
To 50 μL of STD and QC plasma samples, 150 μL of IS working solution (200 ng/mL) in acetonitrile was added to precipitate plasma proteins. After mixing and centrifugation, 50 μL of supernatant was mixed with 100 μL of 0.1% formic acid in water and injected into the LC/MS/MS system.
Results and Discussions
The readings from the dual-dye photometric measurements for the manually prepared STD curve and the liquid-handler-prepared dye samples (Set 1 to Set 3) are shown in Table 1. The mean reading of the three replicates at each concentration level and the corresponding precision are listed. To quantify the dye samples prepared by the liquid handler with different liquid-transfer strategies as described in Set 1 to Set 3, a calibration STD curve must be established by correlating the readings from the dual-dye photometric measurement with the concentrations of the manually prepared dye samples. The best-fit curve (

Dual-dye photometric measurements of the dye samples
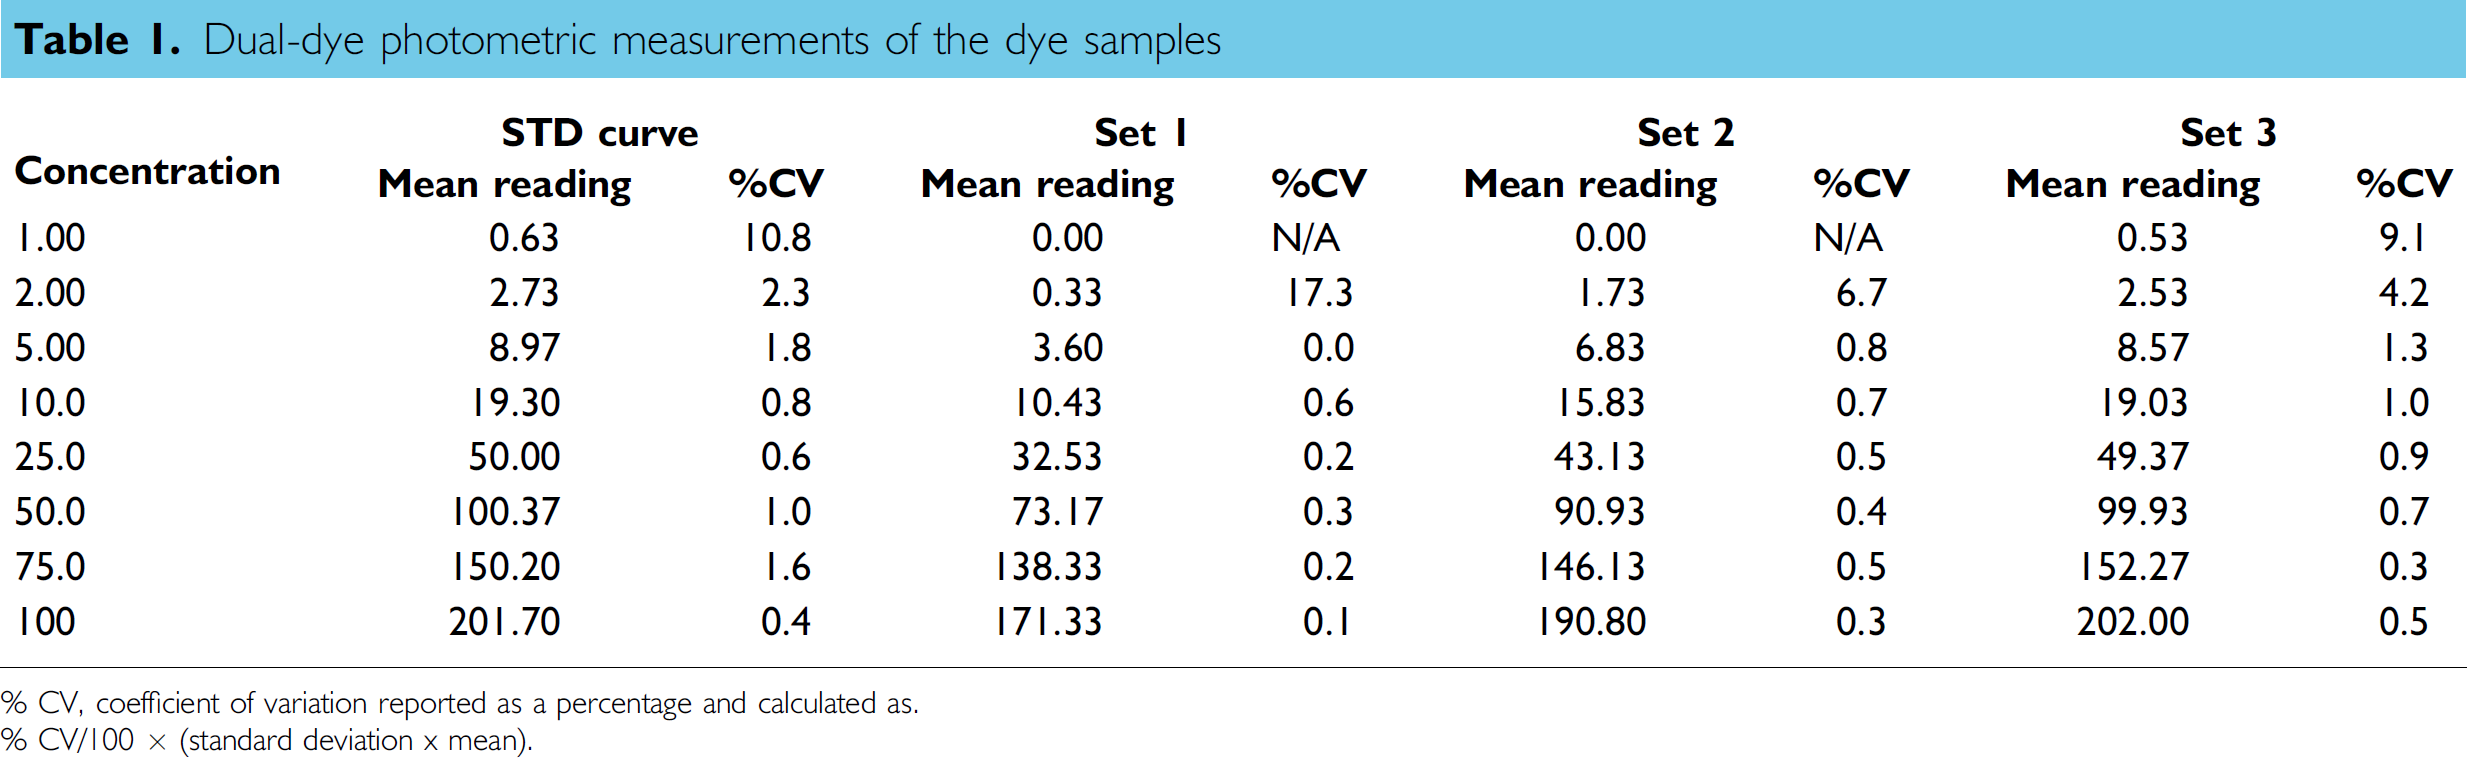
% CV, coefficient of variation reported as a percentage and calculated as.
% CV/100 × (standard deviation × mean).
where
Table 2 shows the back-calculated concentrations for the STD curve and the quantitative results for the dye samples prepared by the liquid handler (Set 1 to Set 3). The accuracy and precision are also listed in Table 2. Table 3 shows the serial-dilution schemes for the dye sample preparations. The accuracy and precision for the STD curve concentrations were within ±3.0% and 2.9%, respectively. The STD curve results indicated that the method was able to quantify the red dye samples over the concentration range of 1–100. From the quantitative results of Set 1 and Set 2 dye samples, larger dilution effects were observed for the samples involving more serial-dilution steps. For Set 2 dye samples, the dilution effect increased from −4.3% (average of −5.4% and −3.2%) for the first step of the serial dilution to −24.5% for the sixth step of the serial dilution. For Set 1 dye samples, the dilution effect increased from −11.7% (average of −15.0% and −8.3%) for the first step of the serial dilution to −59.0% for the sixth step of the serial dilution. The responses for the dye samples after seven steps of serial dilution were too low to be used for the quantitation of both Set 1 and Set 2 dye samples. The significant dilution effect was the result of the accumulation of the dilution effect in multistep serial dilution. The overall dilution effect for Set 1 was about twofold higher than that for Set 2 because two cycles of mixing were used in Set 1 sample preparation.
Accuracy and precision data for dye samples
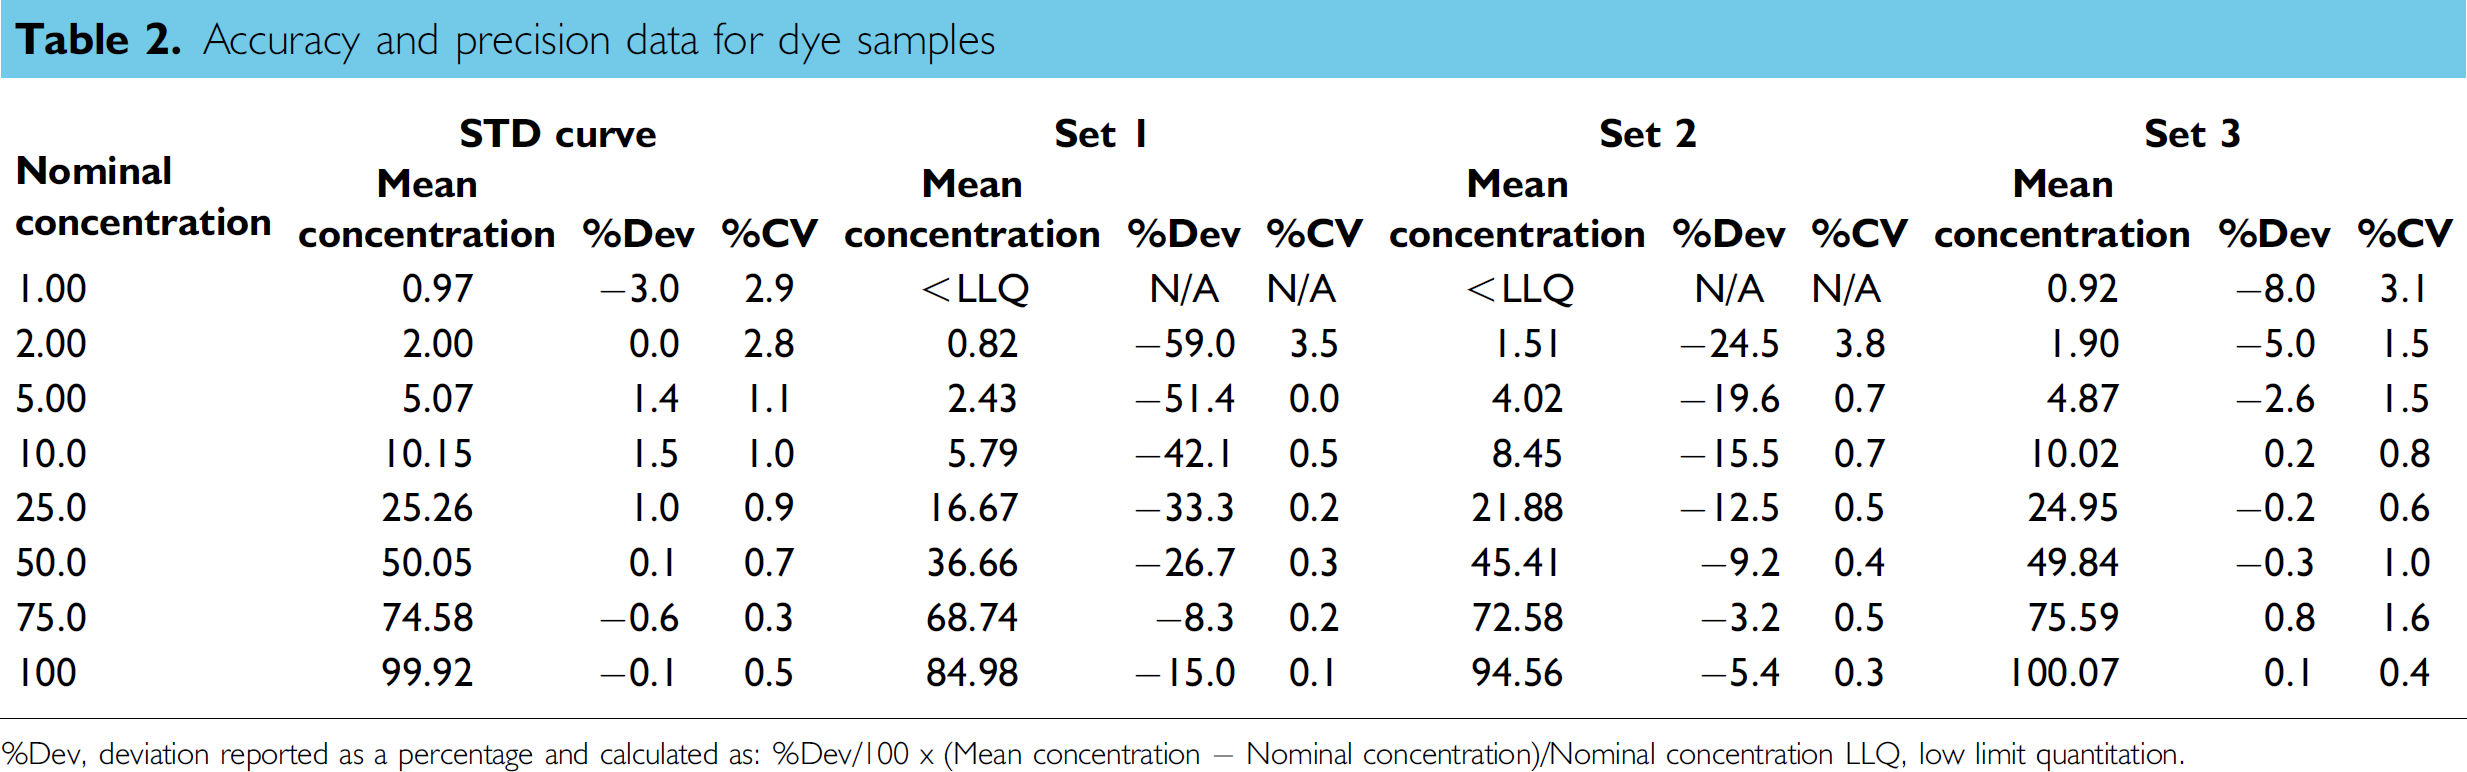
%Dev, deviation reported as a percentage and calculated as: %Dev/100 × (Mean concentration — Nominal concentration)/Nominal concentration LLQ, low limit quantitation.
Serial-dilution scheme for the dye sample preparation
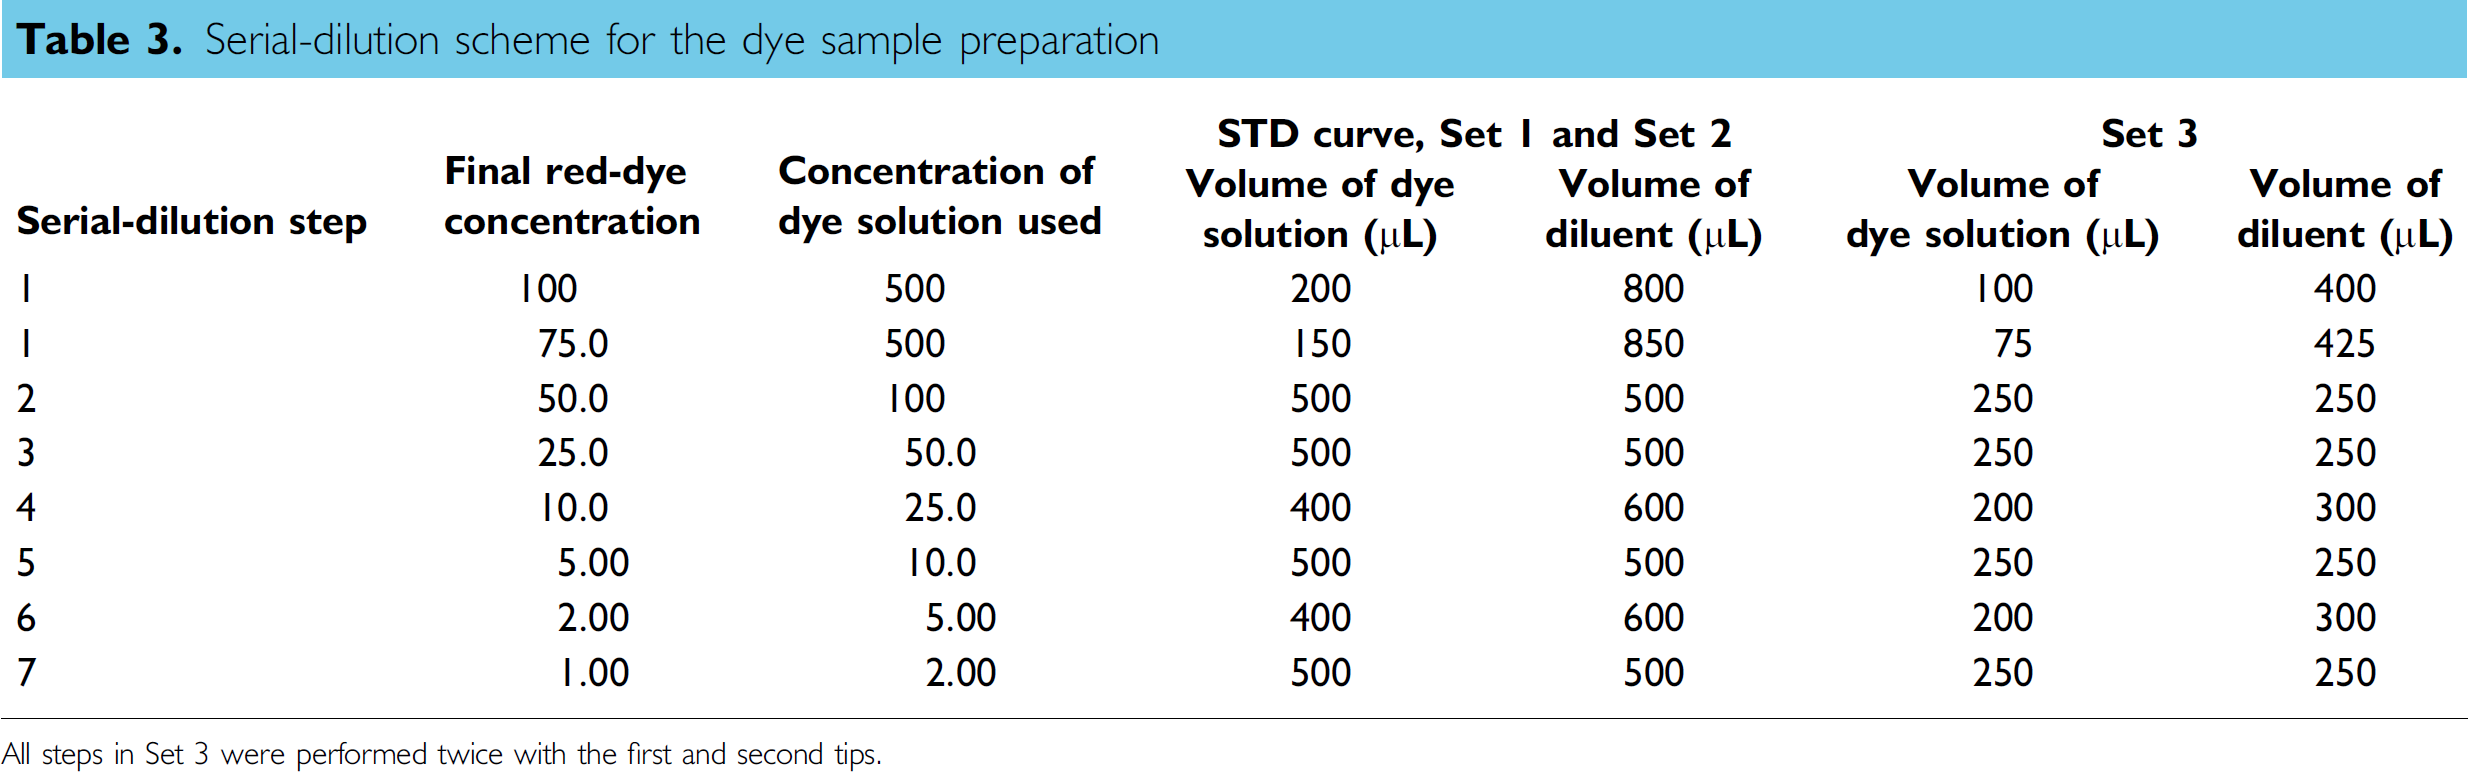
All steps in Set 3 were performed twice with the first and second tips.
No significant dilution effect was observed for Set 3 dye samples even after seven steps of serial dilution. Excellent accuracy (–8.0%) and precision (3.1%) were obtained for Set 3 samples over the whole STD curve range. These quantitative results illustrated the following three points:
Because of the cumulative dilution effect, it is impossible to prepare a calibration curve by serial dilution using Strategies 1 and 2 with a multichannel liquid-handling system equipped with fixed tips. Very significant dilution effect (−4.3% without mixing or −11.7% with two cycles of mixing) occurred even in one-step dilutions. Even in a multistep dilution with very low DF (among all seven steps of serial dilution, there are four steps of dilution with DF = 2 and two steps of dilution with DF = 2.5), the dilution effect was largely minimized to a negligible level with the liquid-transfer strategy used for Set 3 sample preparation.
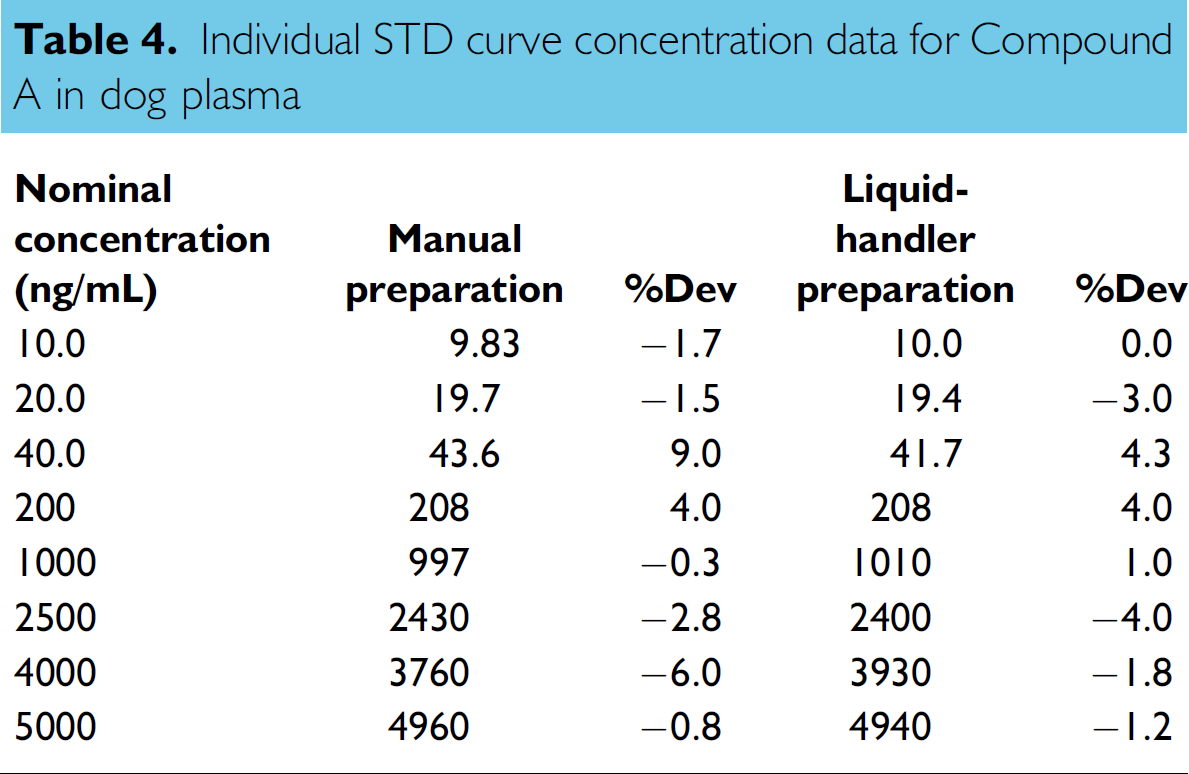
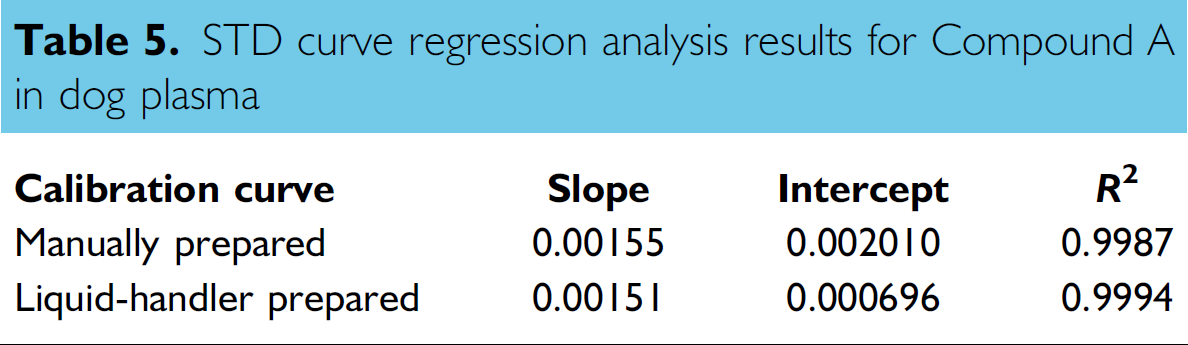
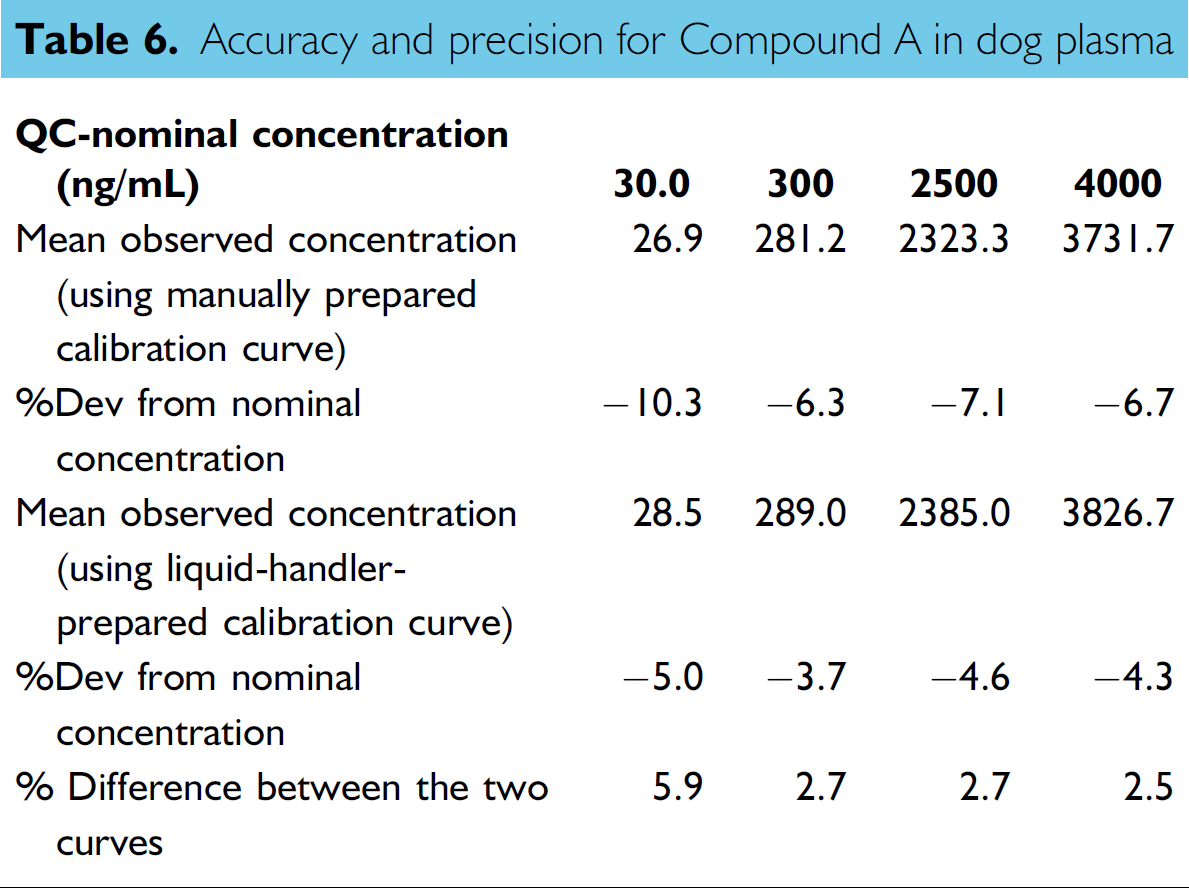
Based on these encouraging results, several calibration curves for different compounds were successfully prepared in biological matrixes by the liquid-transfer strategy used for Set 3 dye sample preparation. A comparison between the calibration curves of Compound A in dog plasma prepared manually by using the electronic pipettes and automatically by using the liquid handler with this liquid-transfer strategy is shown in Tables 4, 5, and 6. The calibration curves, ranging from 10.0 to 5000 ng/mL for Compound A, were fitted into a 1/
Individual STD curve concentration data for Compound A in dog plasma
STD curve regression analysis results for Compound A in dog plasma
Accuracy and precision for Compound A in dog plasma
With this strategy, instead of the sample itself, the leading BLK matrix will experience one-time dilution effect from the system liquid. However, there will be no accumulation of the dilution effect for the BLK matrix no matter how many sample dilution steps are involved because the BLK matrix is always aspirated from the same undiluted original BLK matrix container. Normally, this small percentage of dilution for the BLK matrix will not be an issue for bioanalytical LC/MS/MS assays. But if there is a significant matrix effect in a bioanalytical assay and the assay does not have an isotope-labeled IS, then small difference between the matrices for the diluted samples (STD/QC or samples) could result in inaccurate measurement. Our solution to this situation is to use the preaspirating a partition volume approach as suggested by Lupotsky et al. 6 In this case, we will waste some BLK matrix for the STD/QC and sample preparation, but not any valuable biological sample.
Another item worth discussion is the QC preparation. In most of the cases, large volumes (e.g., 10 or 15 mL) of the QC sample need to be prepared at one time. The largest volume of QC samples prepared in this work was 3.6 mL, which used four fixed tips to prepare them at the same time. When QC sample volume is over 3.6 mL, the efficiency of the mixing could be an issue because we rely on the high-speed dispense in this step. Because QC sample preparation is usually a one-time event for a study, using liquid handler to prepare QC sample does not have significant advantage over the manual preparation using disposable-tip pipette. Our suggestion is to use the manually prepared QC samples to evaluate the performance of the STD preparation. This approach not only evaluates the dilution effect of the STD curve preparation, but also addresses the concern on the diluted BLK matrix if there is matrix effect in the assay.
Conclusions
The dilution effect caused by using the system liquid to wash the fixed tips and the impact of the dilution effect in bioanalytical sample preparation were discussed. It was concluded that for the bioanalytical sample preparation, the only liquid-transfer steps where the dilution effect should be considered were the sample-dilution step and the STD/QC preparation step with the serial-dilution scheme. Because of the involvement of BLK matrix in both liquid-transfer steps, a unique liquid-transfer strategy was designed to minimize or eliminate the dilution effect. By aspirating the BLK before the biological sample into a same fixed tip, the dilution effect could be corrected. According to the dual-dye photometric measurement, the dilution effect for the red dye was quantified to be as high as −4.3% for a single step of liquid transfer by using the normal approach with fixed tips. Our experimental results demonstrated that the accumulation of the dilution effect was as high as −24.5% (or −59.0% if the sample was mixed by the liquid handler) within only six steps of serial dilution for the red dye samples. It was impossible to prepare accurate calibration curves with the liquid handlers equipped with fixed tips by using the normal liquid-transfer strategy. It was also demonstrated that the negative bias would be significant (−4.3% for a one-step dilution and −9.2% for a two-step dilution) for the diluted sample if a proper liquid-transfer step was not used to minimize the dilution effect. Considering the dilution effect could be as high as −10.0% for only one step of liquid transfer, it was evident that the dilution effect had to be minimized or eliminated before liquid handlers could be used in the bioanalytical sample preparation involving sample dilution and STD/QC preparation. The effectiveness of our strategy in minimizing the dilution effect was demonstrated by the dual-dye photometric measurement. Furthermore, two STD curves for the BMS Compound A in dog plasma prepared manually with electronic pipettes and automatically with a fixed-tip liquid handler using this strategy were used to quantify manually prepared QC samples. The LC/MS/MS analysis results showed excellent accuracy and precision for both curves. In conclusion, with this strategy, the dilution effect could be minimized and even reduced to a negligible level for bioanalytical sample preparation involving STD/QC preparation and sample dilution. High-quality sample preparation could be achieved by using liquid handlers equipped with fixed tips without wasting any valuable biological sample.
Acknowledgments
The authors gratefully acknowledge Dr. Steve Unger in the Bioanalytical Science at Bristol—Myers Squibb Company for his valuable discussions and suggestions.