
Abstract
Artel has developed the Multichannel Verification System (MVS), a photometric method for verifying the performance of automated multichannel liquid delivery equipment. 1 On the basis of Artel's patented Dual-Dye Ratiometric Photometry method, the MVS determines both the accuracy and precision of each individual channel of a multichannel liquid delivery device. The MVS verifies aqueous volumes of 2–200 μL, produces results that are traceable to national standards, and can be applied to a wide range of instruments. It is important that the MVS is a robust system that is convenient to use in the laboratory environment so that the volumetric performance of automated liquid-handling equipment can be verified frequently without causing unnecessary delay in use of the instruments for their intended applications.
Keywords
Laboratory Automation and Volumetric Performance
Automated liquid-handling systems are highly effective at increasing throughput and decreasing labor expenditure in a number of applications such as drug discovery and development, proteomics, genomics, and molecular diagnostics. Because these applications demand a high level of data integrity, they rely on the intrinsic accuracy and precision of automated systems. 2 –4 To maintain confidence in the data generated from automated liquid-handling systems, it is important that these systems be calibrated and their volumetric performance frequently verified.
There are a number of parameters that must be considered for calibrating and verifying the performance of automated liquid-handling systems in the laboratory environment. 5,6 For multichannel devices, validation must be performed for each individual channel to assure accuracy and precision across the entire system. The validation method must be able to measure the small volumes that are typically dispensed by automated liquid-handling systems. It is important that results produced by the validation method be standardized to achieve consistent volumetric performance for all instruments and to allow inter-laboratory comparability. 2 An ideal method of standardization is traceability to recognized national standards. Finally, it is important that the validation method be robust, rapid, and easy to use in the laboratory environment by in-house personnel so that the volumetric performance of automated liquid-handling systems can be verified frequently without causing unnecessary instrument downtime.
Several methods for calibrating liquid volumes delivered from multichannel equipment, such as gravimetric, fluorometric, and photometric approaches, have been implemented with varying degrees of success. 7 –11 Although widely used, gravimetric analysis generally does not provide information about individual tip performance for 96-tip instruments and becomes increasingly difficult to perform at low volumes. In comparison, a fluorescence approach gives information about each channel and readily extends to low volumes. However, the well-known variability inherent to fluorescent dyes that is caused by quenching and photobleaching makes an accurate volume determination difficult to achieve. As with fluorescence, a photometric approach provides information about each channel and, more important, allows for volume measurements that are traceable to national standards.
Although the photometric method itself is not unique (simple optical approaches using absorbance dyes have been employed for many years for calibrating volume delivery from pipettes), 12 a patented dual-dye photometric approach developed by Artel provides some significant advantages as compared with the aforementioned methods. This report describes the development by Artel of a Multichannel Verification System (MVS) to calibrate automated multichannel liquid delivery equipment based upon a unique dualdye, dual wavelength ratiometric photometry method. The advantages of this approach, along with a detailed description of the system operation, will be presented herein.
Dualdye Ratiometric Photometry
The MVS is an extension of the patented Dual-Dye Ratiometric Photometry method that has been used in Artel's PCS Pipette Calibration System for a number of years. 13 –16 This method employs two colorimetric dyes with distinct absorbance maxima at 520 nm (red) and 730 nm (blue). By measuring the absorbance of these dyes under defined conditions and applying the Beer-Lambert law, the MVS determines both the precision and accuracy of each channel in a multichannel liquid delivery device in one experiment.
The concentration of a chromophore or dye in solution can be determined photometrically by using the Beer-Lambert law. Simply stated, the law claims that when light is passed through a solution containing some concentration of chromophore, the amount of light absorbed by the dye solution is proportional to both the concentration of dye and the interaction pathlength of the light with the solution. In mathematical terms, the law is written as follows:

where Aλ is the absorbance of the chromophore at a specific wavelength λ, ɛ λ is a physical constant of the chromophore at wavelength λ known as the molar absorptivity, l is the pathlength of light through the solution, and C is the molar concentration of the chromophore in the test solution. This proportionality is most commonly used to determine an unknown concentration of a chromophore in solution, where the molar absorptivity at the measurement wavelength is known and the pathlength of light through the solution is known or fixed. 17,18
Alternatively, Equation 1 also states that the measured absorbance is proportional to the pathlength of light through the solution. If both the molar absorptivity and concentration of the chromophore in a dye solution are known, then Equation 1 can be used to determine an unknown pathlength traversed by a photometric light beam. To use the Beer-Lambert law in this way, it becomes convenient to combine the molar absorptivity (ɛλ) and concentration (C) terms as follows:

where the new term aλ represents the absorbance of the dye solution per unit pathlength at the wavelength λ. Substitution of this new term into Equation 1 gives the following:

The Artel MVS uses Equation 3 to determine the pathlength of light through an unknown volume of dye solution. By measuring the pathlength through the solution and by knowing the chromophore concentration in the dye solution, the unknown volume can be determined. This process is accomplished through the multiple components that constitute the MVS system.
MVS Components
The MVS has been optimized to ensure accurate and precise photometric measurements and to allow traceability of results to national standards. The components of the MVS, shown in Fig. 1, include the following: (1) custom-manufactured microtiter plates that are dimensionally characterized; (2) aqueous-based sample solutions, diluent, and baseline solutions containing known concentrations of dyes; (3) a specialized calibrator plate to provide system traceability, consisting of sealed precision quartz cuvettes containing the same dyes used in the sample solutions; (4) a plate shaker that provides optimal mixing of solutions and diluent in the microtiter plate wells; (5) a notebook computer with MVS Data Manager software and a barcode reader; and (6) a customized microtiter plate reader that delivers reliable absorbance measurements at 520 nm and 730 nm.

The multiple components of the MVS function together to verify the liquid delivery performance from a multichannel liquid handler capable of dispensing into a 96-well microtiter plate. The characterized microtiter plates, aqueous sample solutions and calibrator plate all contain important performance information encoded in bar codes on each component. This encoded information is passed to the system software through the barcode reader. The plate reader collects photometric measurements of the dye solutions dispensed into the microtiter wells by the liquid handler under test. These photometric measurements, together with the bar coded information, are used to determine both the precision and accuracy of the volume delivered from each tip of the liquid handler used.
MVS Solutions
All MVS solutions are designed to work together seamlessly. The absorbance per unit path length of the red and blue dyes is determined by Artel for each MVS solution on a lot-to-lot basis. This information, which is traceable to national standards, is recorded via a bar code on each bottle, which further reduces any source of variability in measurement and allows solutions from different reagent lots to be used interchangeably.
Sample solutions. MVS sample solutions contain two dyes with distinct absorbance maxima at 520 nm (red) and 730 nm (blue). Three sample solutions containing different concentrations of the red dye are used for testing the performance of instruments over different volume ranges: range A (50 −200 μL), range B (10 − 49.9μL), and range C (2 − 9.9μL). The concentration of red dye in each of these aqueous solutions is optimized to ensure that the absorbance readings at 520 nm are within the linear range of the microtiter plate reader. The concentration of the blue dye is constant in all sample solutions across all volume ranges. Table 1 presents the relative concentration of red and blue dyes in each MVS solution. The absorbance per unit path length for the red dye (ar ) is encoded on each bottle of sample solution and provides a necessary piece of information for subsequent volume calculations.
Relative concentration of red and blue dyes in MVS solutionsa
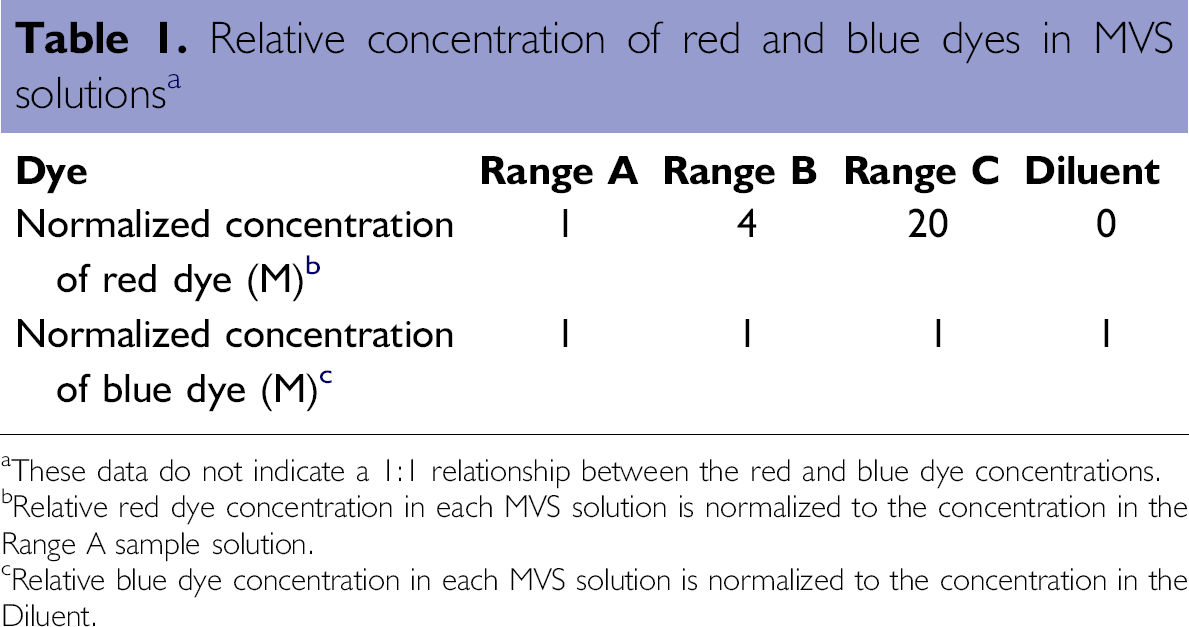
These data do not indicate a 1:1 relationship between the red and blue dye concentrations.
Relative red dye concentration in each MVS solution is normalized to the concentration in the Range A sample solution.
Relative blue dye concentration in each MVS solution is normalized to the concentration in the Diluent.
Diluent. The MVS diluent is used for back-filling sample volumes that do not sufficiently fill the microtiter plate wells to allow for accurate photometric measurements. Diluent contains only the blue dye, but at the same concentration as that in the sample solutions. Thus, for all combinations of diluent and sample solutions, the concentration of blue dye remains the same. This critical feature makes it possible to calculate the total volume independent of the ratio of sample solution to diluent simply by measuring the absorbance of the blue dye. The diluent is used to bring the total working volume to 200μL when sample solution is measured at volumes of less than 50μL. The absorbance per pathlength for the blue dye (ab ) is inserted into the bottle bar code for use in the required calculations.
Baseline solution. MVS baseline solution contains no dye and is used for establishing a baseline, or blank measurement for the solution-filled microtiter plate. This eliminates the contribution of light scatter and reflection losses from the solution-filled plate to the measured absorbance values for each well.
MVS Verification Plates
The MVS verification plates are SBS standard 96-well microtiter plates that have been tested under stringent conditions to ensure uniformity in well dimensions. These dimensions are measured with a coordinate measuring machine to determine the bottom diameter (D) and taper angle (θH) of each well, depicted in Fig. 2, which are critical components for volume calculations. The well dimensions are characterized for these plates on a lot basis, and this information is encoded in a bar code that is used by the MVS Data Manager software for volume calculations.
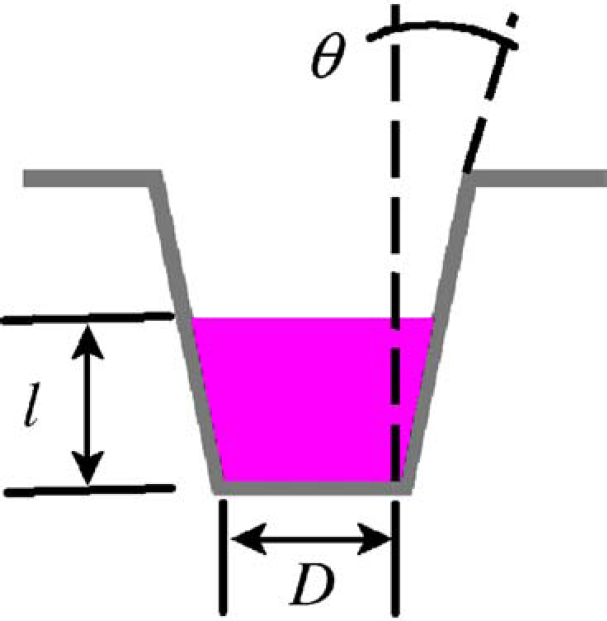
The geometrical shape of the wells in the MVS Verification Plates is best described as a truncated cone. Each lot of plates is statistically characterized by pulling samples from the beginning, middle and end of a production run. Every well in each of these sampled plates is measured with a coordinate measuring machine to determine the mean bottom diameter (D) and mean taper angle of the sidewall (θH), which are encoded in the bar code affixed to the remaining plates within that lot. These quantities, together with the measured pathlength (l) of solution dispensed, are used to determine the volume of solution in each well within a verification plate.
MVS Plate Shaker
The MVS Plate Shaker is used to provide optimal mixing of solutions dispensed into the wells of the verification plates. Not only does the shaker ensure homogeneity of the red and blue dyes dispensed into each well, but it also helps to overcome the surface tension of the dispensed volumes, thereby ensuring a uniform meniscus in each well.
MVS Plate Reader
The MVS Plate Reader is designed for accurate and precise absorbance measurements at 520 nm and 730 nm. The interference filters used by the plate reader for wavelength selection are optimized for measuring the absorbance responses of the dyes in the diluent and sample solutions. However, despite plate reader optimization, the measured results are dependent on instrument stability and on the characteristics of the individual interference filters used for wavelength selection. These two variables, which are inherent to any spectrometer, must be accounted for when making precise absorbance measurements. In the case of MVS, a specialized calibrator plate is provided that corrects these variables and allows for the precise absorbance measurements required.
MVS Calibrator Plate
The MVS calibrator plate is the key to ensuring that the absorbance measurements used to validate liquid-handling instruments are accurate and traceable to standards of the National Institute of Standards and Technology (NIST). As opposed to the case of other calibration plates that are composed of only neutral density glass standards, the MVS calibrator plate consists of sealed precision cuvettes containing solutions of the same dyes that are used in the diluent and sample solutions. By using these dye-filled cuvettes, the calibrator plate provides an optical standard for calibrating the daily performance of the plate reader and also accurately tests the performance of the interference filters used as the wavelength selection method by the plate reader. The latter function can not be accurately performed by using only neutral density glass standards.
Traceability of MVS results is maintained by measuring each cuvette in a factory reference spectrophotometer whose performance is maintained to NIST standards and encoding this information on each calibrator plate via a bar code. Normal fluctuations in day-to-day performance, common to all plate readers, are accounted for through daily measurement of the MVS calibrator plate.
MVS Data Manager Software and Barcode Reader
The MVS Data Manager software integrates the absorbance readings at 520 nm and 730 nm that are collected by the plate reader with the bar-coded information from the verification plate, calibrator plate, and MVS solutions to create a comprehensive report of the volumetric performance of each channel of a multichannel liquid-handling device. All calculations are transparent to the operator, and all data are immediately stored in a secure database for readily available viewing and analysis. The software allows for compliance with 21 CFR Part 11 and provides for optional administrative control over all functions.
Operating Protocol
The operating procedure for the MVS enables the user to verify the performance of each channel of a multichannel liquid delivery device quickly and conveniently, via the following steps:
Scan the MVS calibrator plate. This calibration step typically is performed only once daily and requires only a few minutes. By comparing the measured absorbance of the MVS Calibrator Plate with the bar-coded absorbance measured by the factory reference spectrophotometer, a calibration factor that accounts for normal fluctuations in daily performance is applied to the MVS Plate Reader output. This ensures an unbroken chain of traceability of results to national standards, facilitating comparability of results from day to day, operator to operator, instrument to instrument, and laboratory to laboratory.
Collect a baseline measurement. After scanning the calibrator plate, a baseline measurement is made by using a solution that contains no dye. Analogous to making a tare or zero on an analytical balance, this step eliminates the contribution of spurious light reflection due to the solution-filled plate from the measured absorbance.
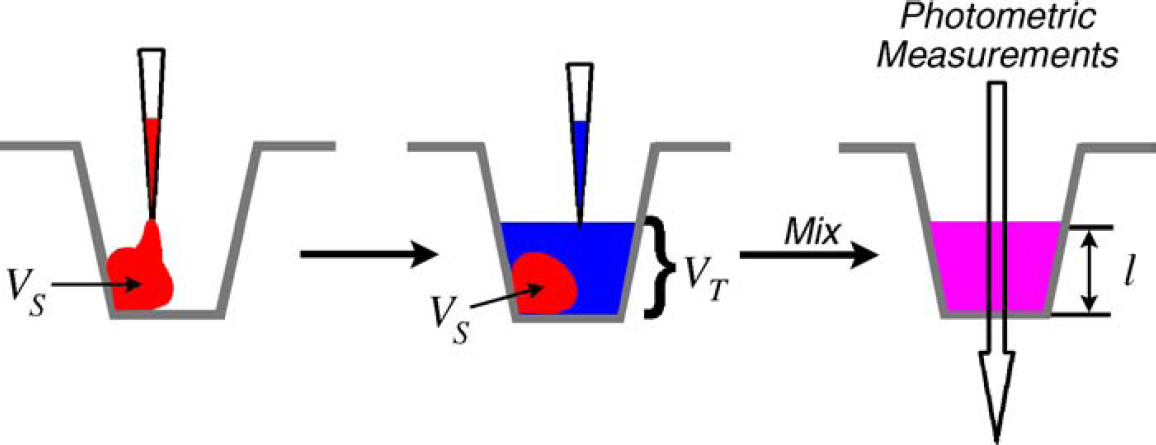
Dispense MVS sample solution by using the multichannel device under test. The multichannel liquid-handling device under test is used to dispense the MVS sample solution containing the red and blue dyes into the microtiter plate wells. For volumes below 50μL, diluent is added to a recommended total working volume of 200μL, which ensures an optimal optical path for the absorbance measurements (depicted in Fig. 3). The amount of diluent added is not critical because the concentration of the blue dye is the same in both the sample solution and diluent.
For small test volumes (VS
), a dispensed droplet of sample solution will adhere to the well sidewall and will not spread across the plate bottom. To allow for accurate photometric measurements, the well is backfilled with diluent to a total working volume (VT
) of 200μL. The two solutions are mixed before any photometric measurements are made. Because the sample solution contains the same concentration of blue dye as the diluent, the total working volume is determined from a photometric measurement at 730 nm of the beam path through the solutions. Although this figure depicts the sample solution being dispensed first, the order of solution dispense can be altered in practice.
Photometric measurements are performed of dispensed test volumes. The MVS Plate Reader performs quantitative absorbance measurements at 520 nm and 730 nm for each of the 96 wells in the verification plate. The sample volume is calculated as a function of the absorbance of the red and blue dyes, along with the bar-coded information from the characterized microtiter plate and solutions.
Test volumes and report generation are performed automatically. MVS Data Manager calculates the volume of sample solution dispensed into each well within the verification plate. A comprehensive report of the test data, including analysis of the collective data set, of individual tip performance, and of performance of each tip per dispense, is displayed on screen. User-defined pass-fail criteria are applied to all calculated volumes, with those volumes that fail to meet established tolerances being visually flagged. Once generated, the report is automatically stored in a controlled database.
Volume Calculations
The photometric measurements collected for each well in a verification plate are used to calculate the sample volume in three steps: (1) calculation of the liquid depth (based on the Beer-Lambert law), (2) calculation of the total volume of liquid, and (3) in the case of test volumes of less than 50μL, calculation of the sample volume.
Because the concentration of the blue dye is the same in all sample solutions and in the diluent, Equation 3 is used to determine the liquid depth (l) in each well, which is equivalent to the pathlength of light passed through the sample (see Fig. 2). By measuring the absorbance of the blue dye at 730 nm (A730 ) and incorporating the bar code quantity of absorbance per unit pathlength of the blue dye at 730 nm (ab ), the liquid depth is determined by the following equation:

Once the liquid depth is known, the geometrical equation for the volume of a truncated cone can be used to determine the total volume of liquid in the well. The calculation of the total volume (VT ) is based on the liquid depth (l) as determined from Equation 4, and the bar code quantities of taper angle (θH) and diameter (D) of the microtiter plate wells, as shown in Equation (5):

The calculation of the sample volume (VS ) is based on the total volume (VT ), the measured absorbance of the blue dye at 730 nm (A730 ), the measured absorbance of the red dye at 520 nm (A520 ), and the bar code quantities of the absorbance per unit path length of the blue dye at 730 nm (ab ) and the absorbance per unit path length of the red dye at 520 nm (ar ), as given by Equation 6 (see also Fig. 3).
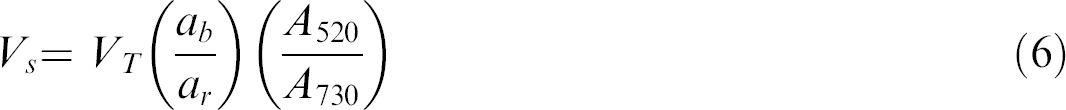
The key relation that makes this approach viable is the fixed concentration of blue dye in both the diluent and sample solutions. By controlling this concentration, the required calculation for the total volume of solution becomes independent from the sample volume calculation. This allows Equation 6 to extract the volume of sample solution, which corresponds to the test sample dispensed by the multichannel liquid handler, from the total volume of solution in the well.
Accuracy and Precision
In general, reliable methods for calibrating multichannel liquid-handling devices that determine both the accuracy and precision of device performance with one experiment are difficult to establish. Laboratories have often relied on simply measuring the volumetric precision using an approach based on either fluorometry or single-dye photometry. If the accuracy of the multichannel liquid handler is of interest, a second experiment involving a gravimetric analysis is often used. MVS determines both the accuracy and precision simultaneously.
Fig. 4 presents a comparison of the performance of MVS to two different methods for determining liquid volumes: a tare-addition gravimetric approach and the photometric approach of the Artel PCS ® Pipette Calibration System. A glass syringe with an attached reproducibility adapter (Hamilton Company, Reno, NV) was calibrated to approximately 40μL, and the performance was tested over several days. Comparison between the average volumes determined from each approach demonstrates excellent agreement between all three methods. Additionally, the MVS data corroborate the 3% inaccuracy performance claim for this system.
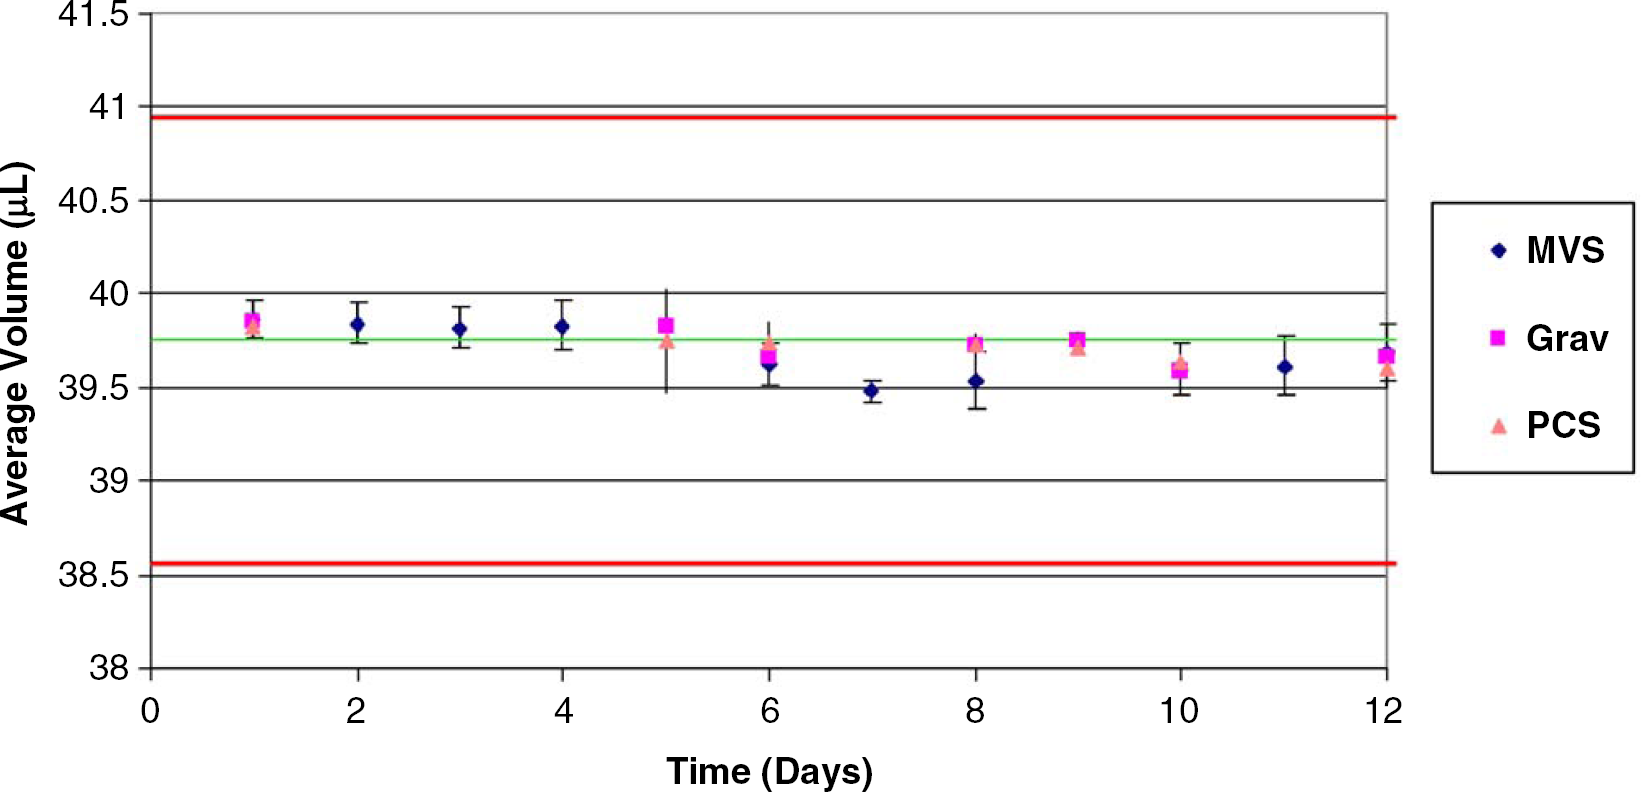
MVS performance (diamonds) compared with a tare-addition gravimetric approach (squares) and the photometric approach (triangles) employed by the Artel PCS. A Hamilton glass syringe (model 805) with an attached reproducibility adapter (Chaney adapter, model 32146, Hamilton Company) was used to dispense the calibrated syringe volume, which was tested by each method over the course of several days. The solid green line (center) indicates the calibrated volume of the syringe. The red (outer) lines indicate the ±3% inaccuracy performance claim for the MVS system. The error bars were established from multiple replicates that were collected for each volume on a given day (7 replicates for PCS and gravimetry, 8 replicates for MVS).
Through the dual-dye photometric approach of MVS, the volumetric performance for an eight-tip automated liquid handler (ALH) was measured over the manufacturer's specified working range of 50–120μL. These data, presented in Fig. 5, demonstrate the need for measuring both the inaccuracy and coefficient of variation (CV) to properly diagnose the performance of a multichannel device. The eight-volume verification protocol followed for this experiment required less than 2 hours to perform and illustrates that the instrument readily passed the manufacturer's 2% specification for CV but failed the same mark for the inaccuracy specification.

Performance data collected for an 8-tip ALH. Each tip dispensed the same test volume into all 12 wells within a row, thus filling an entire 96-well verification plate with the same volume (e.g., all 96 wells were filled with 50μL in one test, whereas all 96 wells were filled with 60μL in a different test, and so on). The mean volume for all 96 wells, along with the standard deviation about that mean were calculated for each test volume. The data presented consists of the relative inaccuracy, defined as [100 x (mean volume - target volume)/target volume], and the coefficient of variation (CV), defined as (100 x standard deviation/mean volume). Although this instrument performs well within the 2% manufacturer's specification for CV, it fails the same specification for inaccuracy at every test volume. The MVS not only provides an analysis of ALH performance based on all wells within the verification plate but also calculates the performance of each tip using the 12 individual dispenses (data not shown).
The data displayed in Fig. 5 demonstrate an ALH whose questionable performance most likely suggests the need for a service call. Although this finding may occur from time to time, it is more common to find an ALH whose poor performance may be improved by optimizing the liquid-handling protocol. Because MVS provides a method for rapid diagnosis, iterative adjustments to various protocol parameters can be altered until the measured inaccuracy and CV are optimized, thereby ensuring the best performance for that device. Such a case of performance bias based on a particular liquid delivery protocol is presented in Fig. 6.

Performance bias of an eight-tip ALH caused by a serial-dispense protocol. The protocol involved aspirating full-tip volumes, followed by serially dispensing across the plate. (A) The MVS Output Report shows a significant overage for the first dispense, which is flagged for exceeding the 10% tolerance limit. Note that the first column was independently filled with baseline solution and was not included in the data calculations. (B) The approximately 18% overage only occurred for the first dispense, with all subsequent volumes performing at or below 3%. Altering the protocol to include a first dispense into a waste reservoir removed the first dispense overage and improved the protocol performance.
The data presented in Fig. 6A are produced by an eight-tip ALH with stainless-steel fixed cannulas. The protocol typically used for this device involved aspirating full-tip volumes of 1.5 mL, followed by a serial dispense across the plate. The MVS Output Report generated for a 10-μL test volume demonstrates that the first volume dispensed from the tips exceeded the 10% inaccuracy tolerance limit and was significantly higher than subsequent dispenses. Plotting the volume inaccuracy across the plate (Fig. 6B) further clarifies that only the first dispense was high, with very good performance agreement between the remaining dispenses. Although not shown here, altering the protocol to incorporate a first dispense into a waste reservoir removed the overdispensing artifact, thereby improving overall performance.
Conclusions
The Artel MVS™ represents the first commercially available system to verify both the accuracy and precision of any multichannel liquid delivery device capable of dispensing into a 96-well microtiter plate, with results traceable to national standards. The integrated components provide the user with the ability to test the performance of a liquid delivery device in a matter of minutes, which allows for periodic full device calibration, more frequent spot verifications, or routine protocol improvement. The ability to report both the accuracy and precision of liquid delivery provides the user with a full assessment of liquid delivery device performance, thus ensuring the integrity of data produced by that device. Because MVS provides results traceable to national standards, interlaboratory comparisons can be made, further ensuring data integrity within a multilaboratory environment.