
Abstract
The protein formulation group develops stable formulations for both clinical and marketed protein therapeutics; this involves a systematic search of a large variable space. Several studies are set up each exploring the effect of a few variables at a time on protein stability. The amount of data generated from each study is substantial and is compounded as more studies are carried out. The business process from the data perspective was mapped to identify the data flow between the sub-processes. A number of redundancies in data entry that resulted in duplication of effort on the part of the researcher were identified. A custom Microsoft Excel Add-In package, using Visual Basic for Applications, has been developed in-house. To increase productivity and efficiency, at every step in the process, namely, planning, preparation, and execution and evaluation of the studies, these macros and templates allow automatic flow of information through the sub-processes. This has significantly reduced manual entry of data and errors in transcription and thereby led to savings in time and increased speed, reliability, and accuracy. Another advantage of using the macros is that the data format is standardized, facilitating the sharing of data and transfer of projects between teams. Further, metadata available through the use of the macros were used creatively to provide additional tools for overall project tracking.
Introduction
Protein formulation development is an important step in developing a protein as a therapeutic product. 1 In addition to the protein, the formulation consists of a buffer to maintain pH and excipients to stabilize the protein against physical and chemical degradation over the desired shelf life. The goal of protein formulation development is to optimize a number of formulation variables to maximize product stability under the recommended storage conditions. Stability-indicating methods are used to monitor protein degradation as a function of stress and time and this information is used to discriminate and identify the most stable formulation. On the average, a study tests the stability of eight formulations, at five storage conditions over 10 timepoints extending for 2 years and generates 400 samples, each of which is monitored using six analytical methods. Typically ∼ 15–20 long-term studies are set up, each exploring the effect of a few formulation variables at a time, before an optimal formulation is identified and recommended for the protein. Thus, during the formulation development process, a large amount of complex data is generated and has to be organized and tracked.
In the protein formulation group, the data are stored in a variety of different formats and multiple locations including laboratory notebooks, in digital form in spreadsheets, and on the computer systems that control the laboratory instruments. A large amount of time is spent in retrieving, organizing, and graphing data, because most of the data entry and manipulation is manual. In addition, the spreadsheet format adopted by the sub-groups is different, which makes sharing of data and transfer of projects between subgroups difficult. With the recent increase in the product pipeline, it became apparent that this system was neither efficient nor scalable. To effectively manage this vast data, a comprehensive laboratory information management system (LIMS) can be one solution. However, this can be expensive and can take considerable time to implement; therefore, in the interim an alternate solution was sought.
The laboratory is not required to operate under 21 CFR 11 compliance, so we proceeded to find an immediate solution that would reduce manual data entry and automate as many aspects of the workflow as possible. Since, the majority of the documents generated by the group are in Microsoft Word and Microsoft Excel formats, functionality can be embedded within them in the form of macros using Microsoft Visual Basic for Applications (VBA).
The focus of this article is to describe the protein formulation workflow and the development and implementation of an in-house custom macro package. The pros and cons of this approach in addressing the data management needs of the group are also discussed.
Workflow Analysis
Prior to developing any macros, the workflow of the group was mapped and documented. 2 A schematic of the high-level business process for a protein formulation study is shown in Figure 1 and can be divided into five sequential sub-processes. The tasks associated with each sub-process are also listed alongside.
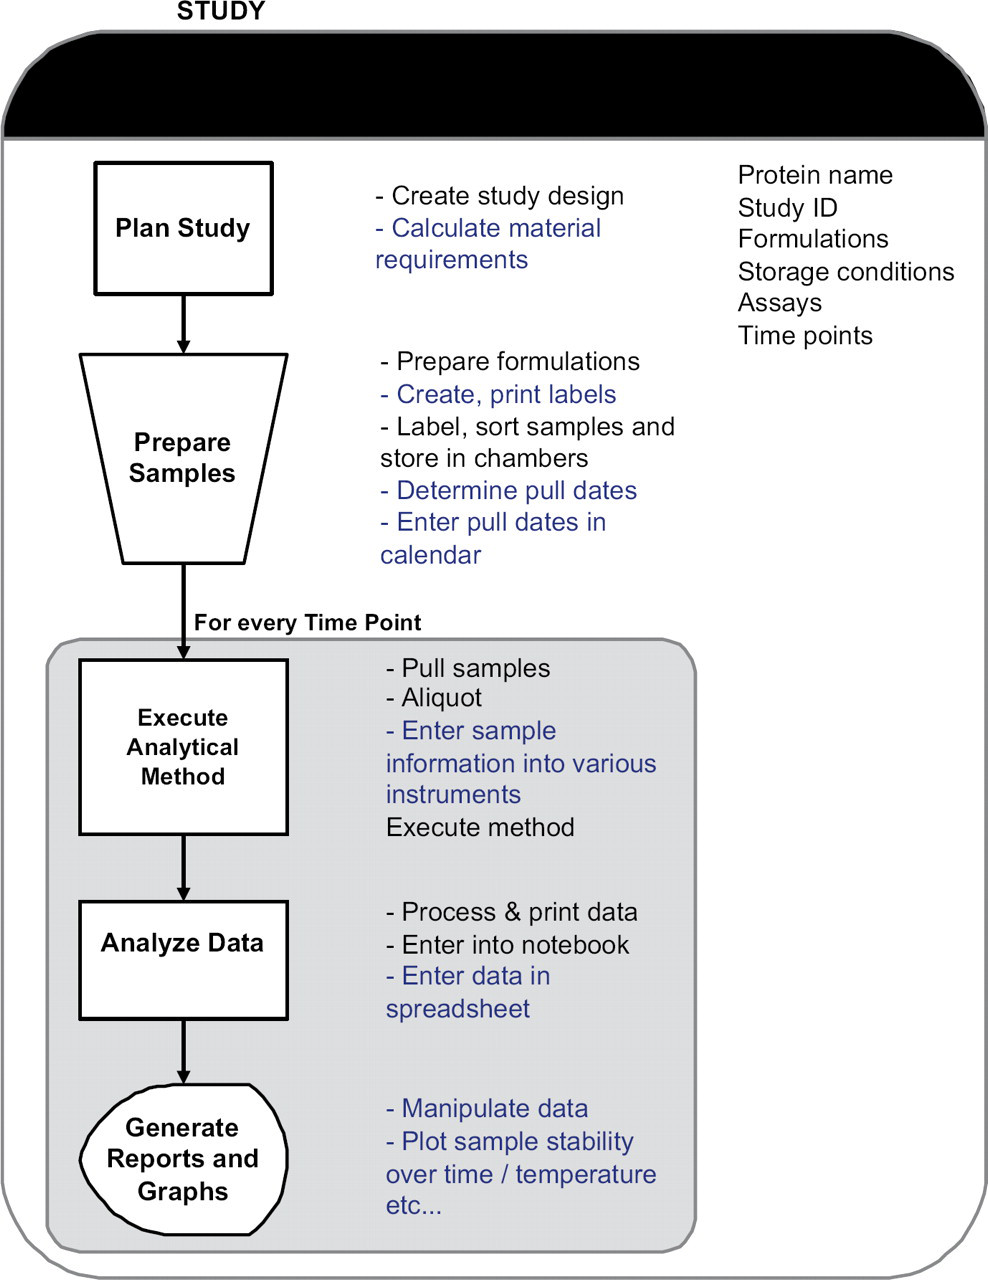
Schematic of the high-level business process of a study, showing the sub-processes and the associated tasks. Tasks automated by the macros are underlined and shown in blue.
Plan Study
The matrix of formulation variables to be tested is based on the goal of the study. A ‘Study Design’ document is created which describes the protein formulations, storage conditions, sampling schedule (timepoints), and the analytical methods (assays) to monitor protein stability. Based on the formulation matrix, material requirements for protein and the packaging containers are calculated and recorded. Labels are created in Microsoft Word and contain all the relevant information to track and identify the sample (protein name, study name, formulation, storage condition, and timepoint).
Prepare Samples
The protein formulations are prepared manually, filled in storage containers, and labeled. Samples are grouped by storage condition (e.g., temperature) and stored. This triggers the start of the study (time zero). Based on this start date and the sampling schedule, various stability analysis timepoints (‘pull dates’) are determined and tracked manually.
Execute Analytical Methods
At each timepoint, samples are retrieved from the storage locations, aliquoted, and analyzed on the various instruments as defined in the study. On the HPLC (high performance liquid chromatography) instruments, samples are placed in an autosampler tray for automatic sequential analysis. A sequence table is set up that lists the samples to be analyzed including QC (Quality Control) reference standards. The sequence table formats depend on the manufacturer of the HPLC (Agilent, Santa Clara, CA and Shimadzu, Kyoto, Japan). For all other assays, such as pH, concentration, osmolality, and particle counts, samples are analyzed manually one at a time. The data is either stored on the instrument computer or recorded directly in laboratory notebooks.
Analyze Data
Of the analytical methods, two are data-intensive. The first is the HPLC assay used to quantify various analytes in the samples, produced as a result of degradation of the protein. Different HPLC methods are used depending on the nature of the degradant (analytes) to be monitored. The raw data is processed using native software (of the instruments) to obtain information such as peak areas and relative peak areas for analytes. The results are printed on paper and transcribed manually into spreadsheets for every analyte. Approximately 3–5 analytes are measured for every sample, and therefore, for a study with eight formulations, 48–80 values (areas and relative areas) are manually entered into spreadsheets per storage condition per timepoint.
A second data-intensive method is the particle counting assay using a liquid particle counting system (HIAC Royco, Pacific Scientific Instruments). The particle counting instrument quantifies sub-visible particles in protein formulations using a light obscuration technique. Typically, differential and cumulative particle counts for seven particle size ranges are measured for every sample. Therefore, for a study with eight formulations, 112 numbers are manually entered into spreadsheets per storage condition.
Once the data are entered in spreadsheets, the researcher spends additional time sorting them into templates convenient for graphing. For the HPLC assays, further calculations are performed to extract protein recovery based on QC reference standards run during the sequence. Metadata stored in laboratory notebooks are also entered into spreadsheets so as to document all the details of the timepoint electronically.
Generate Reports and Graphs
After a spreadsheet is updated with data from the latest timepoint, the data are graphed to view trends in the degradant profiles over time at each storage condition.
The sub-processes, Execute, Analyze, and Generate Reports are repeated for every timepoint in the study. The data processing, transcription, and reporting to view trends is dependent on the number of samples and on average can take ∼4–8 h to complete. These profiles are then used to assess the protein stability in the various formulations in the study. Trends from early timepoints are used to narrow the range of formulation variables and a follow-on study is set up. Typically, a large number of studies are required to be set up so that enough data have been gathered to recommend a formulation that ensures protein stability at the recommended storage temperature over the desired shelf life.
An analysis of this workflow revealed that although the data is captured electronically at the source, nearly all the data entry is manual, because it resides in many formats across various applications. An enormous amount of time is spent transferring experimental data from notebooks or paper printouts from instruments to applications for analysis and presentation. This is a considerable duplication of effort and can lead to errors in data transcription because the same data is reentered several times. Moreover, if and when reanalysis of raw data is required, spreadsheets have to be updated with the new data and this increases processing time further. For a researcher managing several assays and studies, this can lead to a considerable backlog. Thus, to increase the efficiency and productivity, it is clear that the workflow can benefit from automation of both hardware and software. In this article, we describe the software automation of tasks (highlighted in blue in Fig. 1) to streamline the workflow and increase speed, reliability, and accuracy of data transfer.
Methods
Template Definitions
An analysis of the workflow shown in Figure 1 revealed that some of the key information is defined at the start of the study and resides in the study design and the sampling schedule documents, but the information is re-entered many times in several subprocess. Thus, if these documents are structured as templates, then the information transfer to the various subprocesses can be automated by macros. Therefore, two templates were defined, the StudyDesign.dot containing the formulation names, and PullDates.xlt defining the sampling schedule and storage conditions for the formulations. The information in these templates is populated in a standardized format by the user at the planning stage, which can then be accessed by a number of macros at various stages in the workflow.
For data import and transfer purposes, two additional Excel workbook templates were also created. These template workbooks contain a number of predefined worksheets with definitions for (i) import of data from the Agilent HPLC and the HIAC particle counting instrument and (ii) for sorting data into two template styles to generate graphs.
For the protein and container requirements for a study, we have developed an Excel template with formulas that calculates these requirements based on user input.
Identifying Instrument File Formats
Data acquired by the HPLC are processed (peak areas are integrated) using native software and the results can be printed to electronic report files. On the Agilent HPLCs using ChemStation v10, two report files (.csv) are generated for each sample. Report00.csv contains metadata such as sample information as entered in the sequence table, instrument name, method name, and operator name, whereas Report01.csv contains the total and relative peak areas for each analyte detected. On the Shimadzu HPLC using Class VP software, both the quantified and metadata for the entire sequence is captured in a single .txt file.
On the particle counting instrument (HIAC Royco), metadata and raw data for all samples analyzed in a session are stored in two report files: .dbs and .dbm. The .dbm file stores sample names, whereas the measured particle counts and particle size information are stored in the .dbs file.
The data and file formats from a Circular Dichroism spectrometer were also identified for import into Excel. However, because this assay is not a routine stability-indicating assay, details will not be discussed.
Instrument Interfaces
The pH meter (Orion 720A+, Thermo Electron Corporation, MA) and Osmometer (Model 3300, Advanced Instruments, MA) were interfaced to Microsoft Excel using the RS232 communication port. Data were imported through commercially available CPS Plus Serial Data Acquisition Software 1.1, (ProgramBL, Bosnia and Herzegovina).
Macro Coding and Testing
The macros were coded by formulation scientists who have a good understanding of the business process and who have skills in writing macros. Therefore, the macros were implemented in a relatively short time. Also, the macros that addressed the most cumbersome step in the business process, namely, data entry and organization were written and implemented first. The macros evolved to encompass all steps of the business process. Some 20 custom macros were written using Microsoft Visual Basic 6.0 3 and embedded in the Microsoft Office 2003 package as an Add-in. These macros fall into five broad categories based on functionality (i) data import (ii) template transfer (iii) planning and scheduling (iv) graphs and (v) project overview. The macros are accessed through a custom menu created on Excel's worksheet menu bar toolbar, called “Time Saver”. The visual basic module is composed of a number of subroutines and functions that make the code efficient and modularize the package for easy tracking and debugging. Several user forms were also written to obtain user input wherever necessary. An online help file written using HelpScribble software (Just Great Software, Bangkok, Thailand) is available to users. This help file is also called by the error handling routine and helps users do basic troubleshooting.
The design and run time errors in the macros were debugged using standard tools available in Excel. To identify and correct logical errors during the development phase, a core group tested the macros using representative test data sets and performing a 100% manual check of the data transfer process. Once the macros were made available to a wider group in the department, it was recommended that the data be spot checked for accuracy. While the initial macros were completely functional, with increased use, the macros have evolved to become more user friendly (based on user input) and several new features have been added to the macros package to accommodate preferences in reporting styles of other subgroups. For example, the error bars reported in graphs were calculated differently by different groups. In such cases, several options were made available for error bars calculations. In every case, when an upgrade was made, regression testing was done to ensure that previous functionality of the macros was not compromised and that new errors were not introduced.
Results and Discussion
Study Overview
A schematic of the workflow for planning and preparation of a study is shown in Figure 2. The corresponding tasks automated by the macros are shown in blue. Templates are used to define the sampling schedule (PullDates.xlt) and the formulation matrix (Study Design.dot).
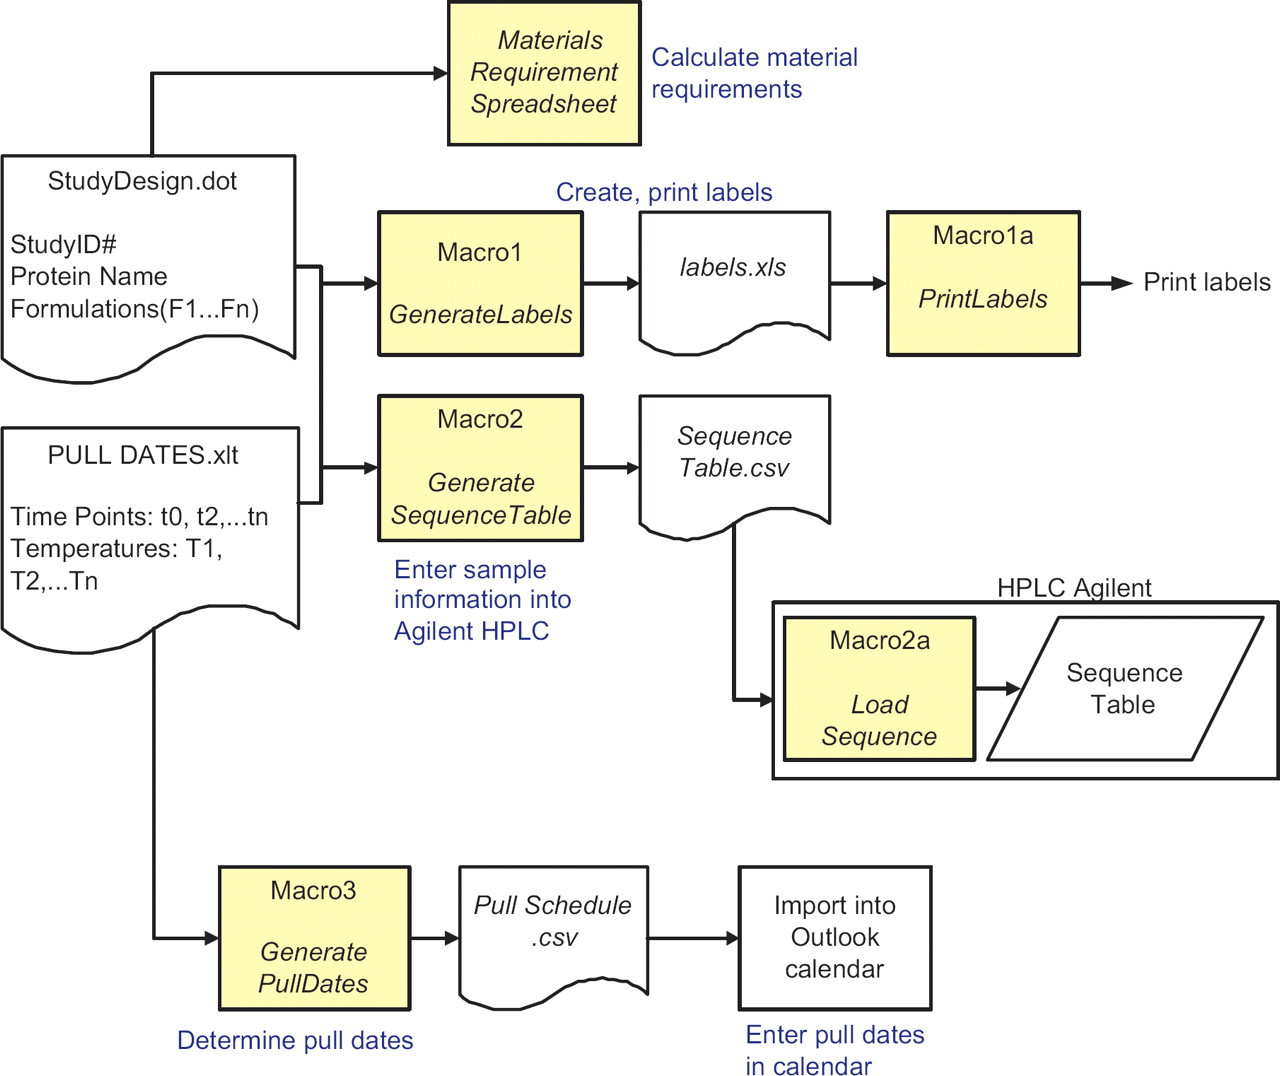
Schematic of the workflow for planning and preparation of a study using the macros. Tasks automated are underlined and shown in blue. User enters information once in Study Design.dot and PullDates.xlt. This information is used by the macros for the sub-processes.
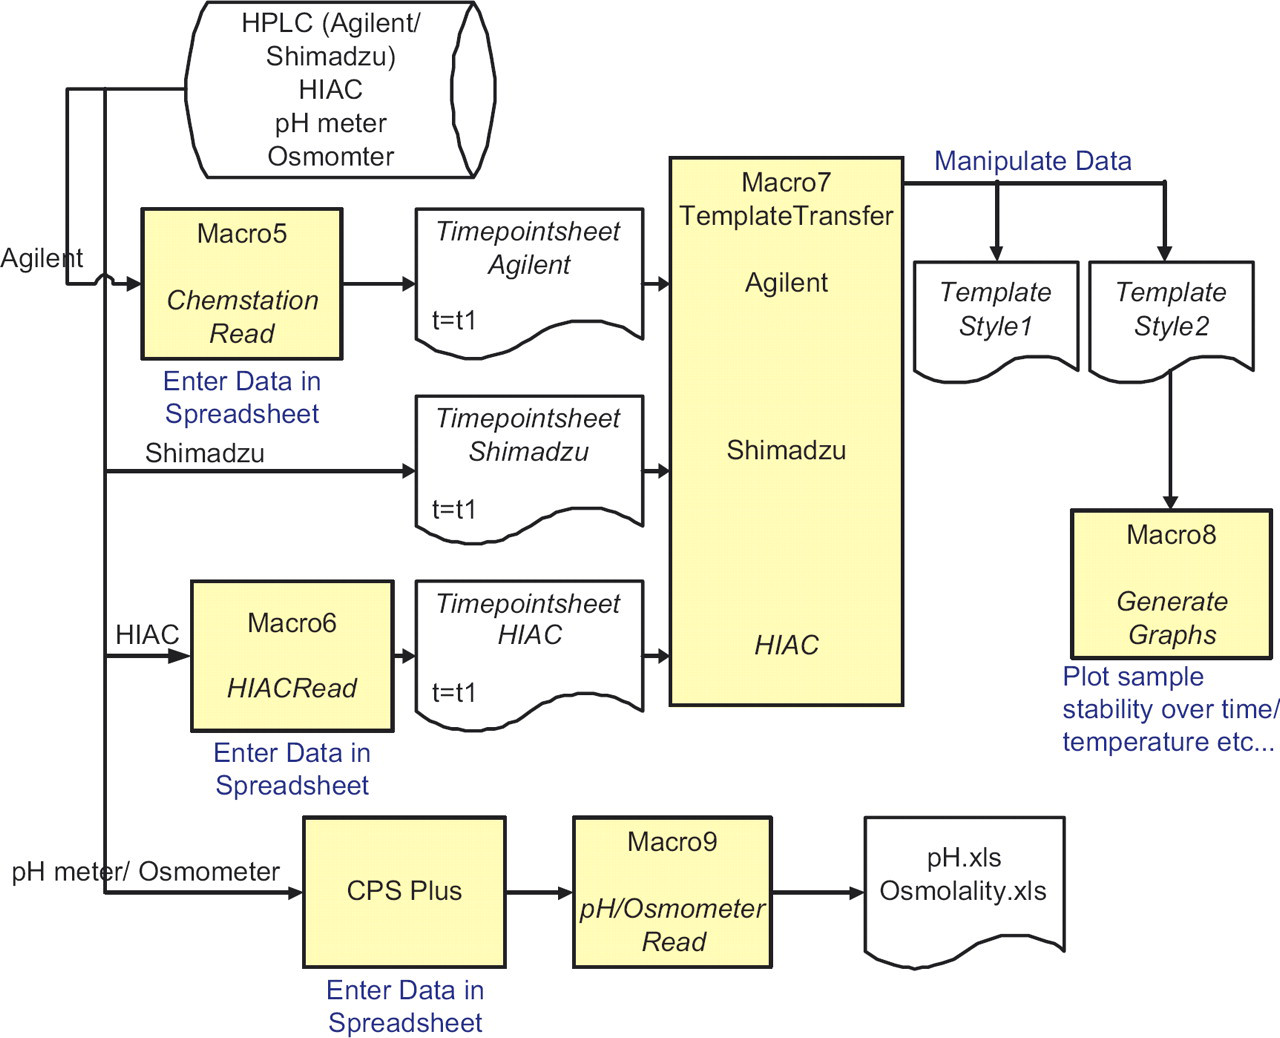
Schematic of the data transfer from Agilent/Shimadzu/HIAC into Excel. Data for each time point is imported using Macro5 or Macro6 and stored in separate worksheets (Timepointsheet) in the same workbook. This is sorted into two templates using TemplateTransfer macro. Macro8 generates graphs of stability over time or temperature using the format in Template Style 2. Data is imported from pH meter and osmometer using CPS Plus acquisition software and Macro9.
The pH meter/Osmometer data is imported into an Excel spreadsheet using CPS Plus and is parsed using pHRead/OsmometerRead (Macro9).
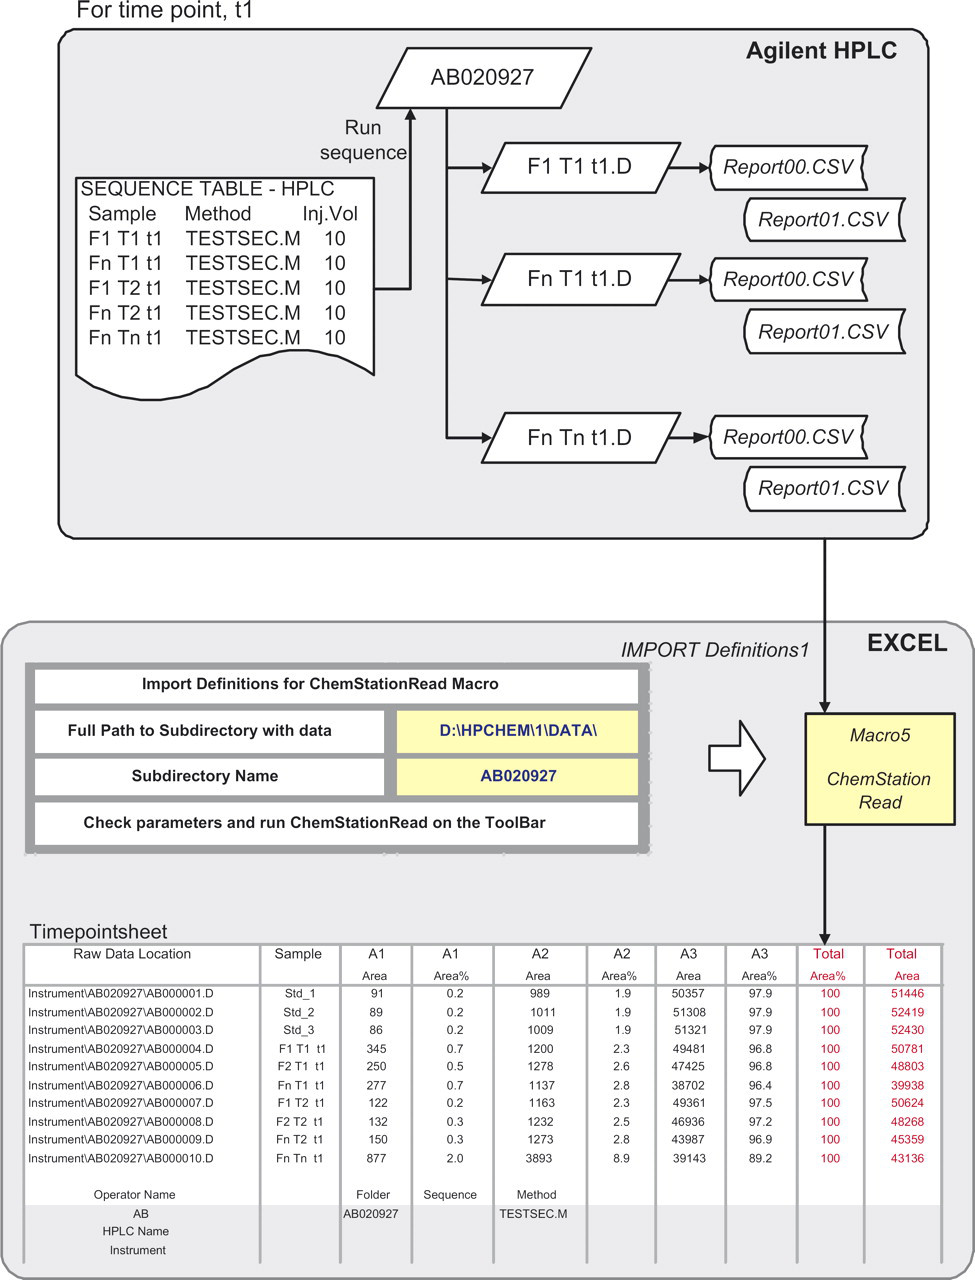
Import of data from Agilent HPLC into Excel worksheet, Timepointsheet, using ChemStationRead and Import Definitions 1. For each sample, Report00.csv and Report01.csv are read into a single row. Total Area and Total Area% are calculated and shown in red for easy validation by user. Raw chromatogram location is imported into Column 1 and is used for data audit purposes.
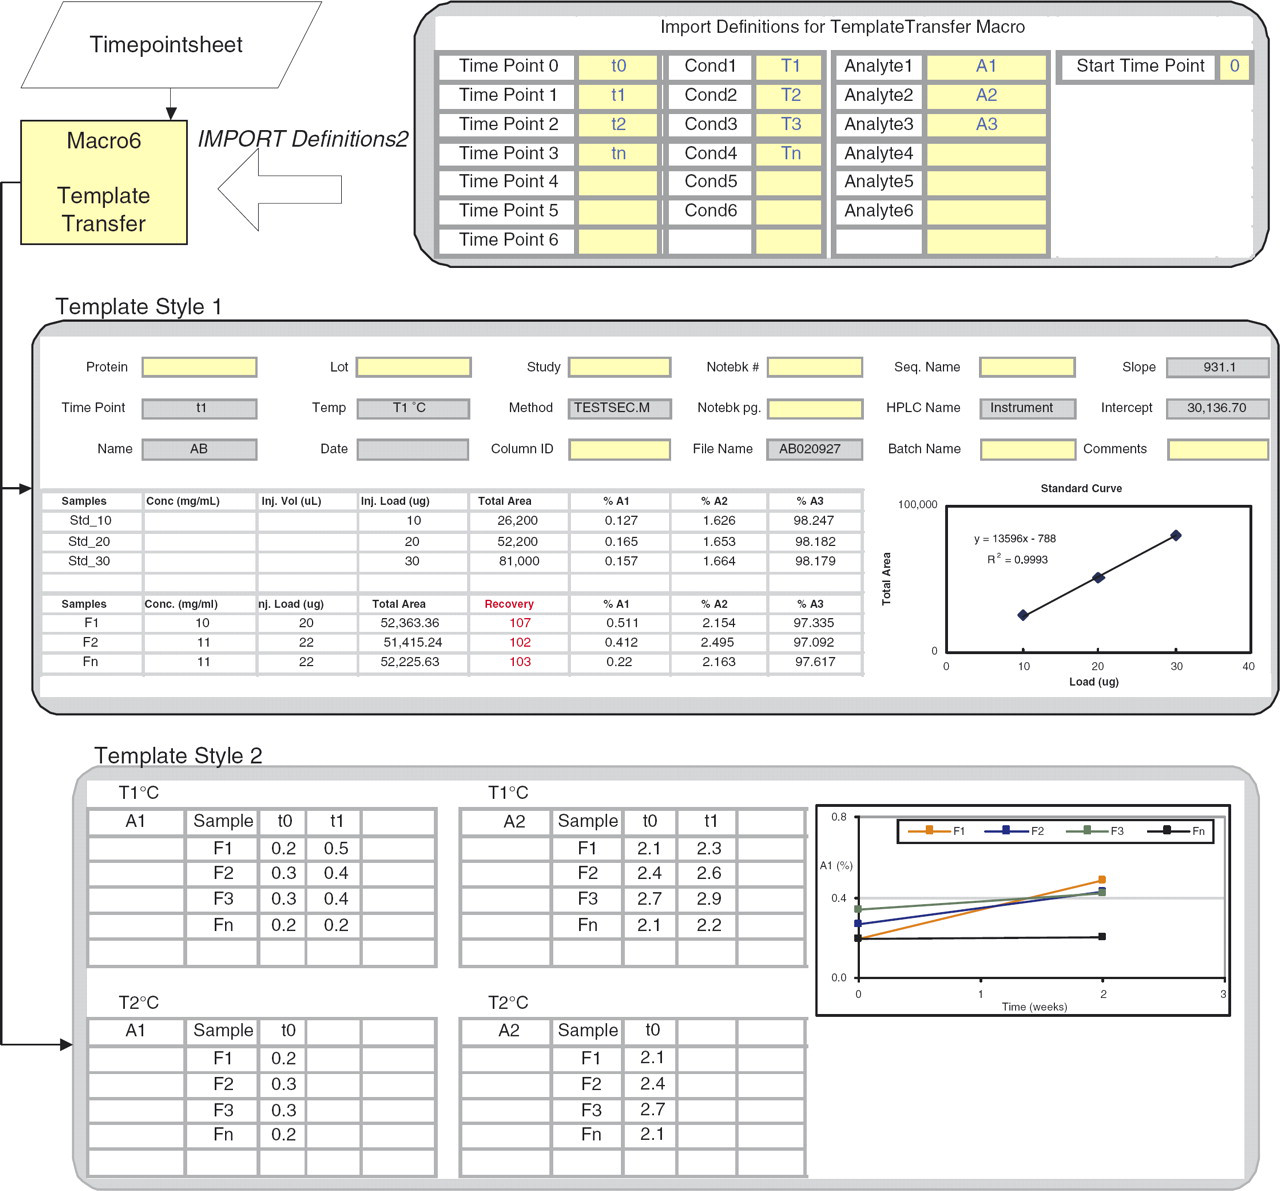
Details of the process of sorting data from Timepointsheet into two template styles. Template Style1 captures metadata from Report00.csv (gray cells). Yellow cells are user input. A standard curve based on reference standards is created and used to calculate Recovery (shown in red). Template Style2 organizes data in a format suitable for graphing to view trends in stability. Various graph types are available with options of plotting error bars.
Template Style1 contains data from a single timepoint. The metadata are displayed as a header; some data are transferred from Report00.csv (gray cells) and others such as notebook numbers and instrument details are entered by the user. The QC standards run in the sequence are displayed, from which a standard curve is calculated. This is used for quantitation of sample recovery (shown in red) and should be in the range of 100% ±10%. This is another example of where the user can verify the data quality quickly.
Template Style2 sorts data from all timepoints in a single worksheet and the organization allows GenerateGraphs (Macro 8) to generate a variety of graphs to accommodate individual user needs. Data can be plotted for all or select formulations, for all analytes, timepoints, and temperatures. Options are provided for error bars calculations that are included in the graphs automatically.
Project Overview
A wealth of information including metadata was available with no additional user input through the use of the macros. An outcome was an innovative use of this data for tasks that were not conceived of before. The following macros (Fig. 6) are such examples.
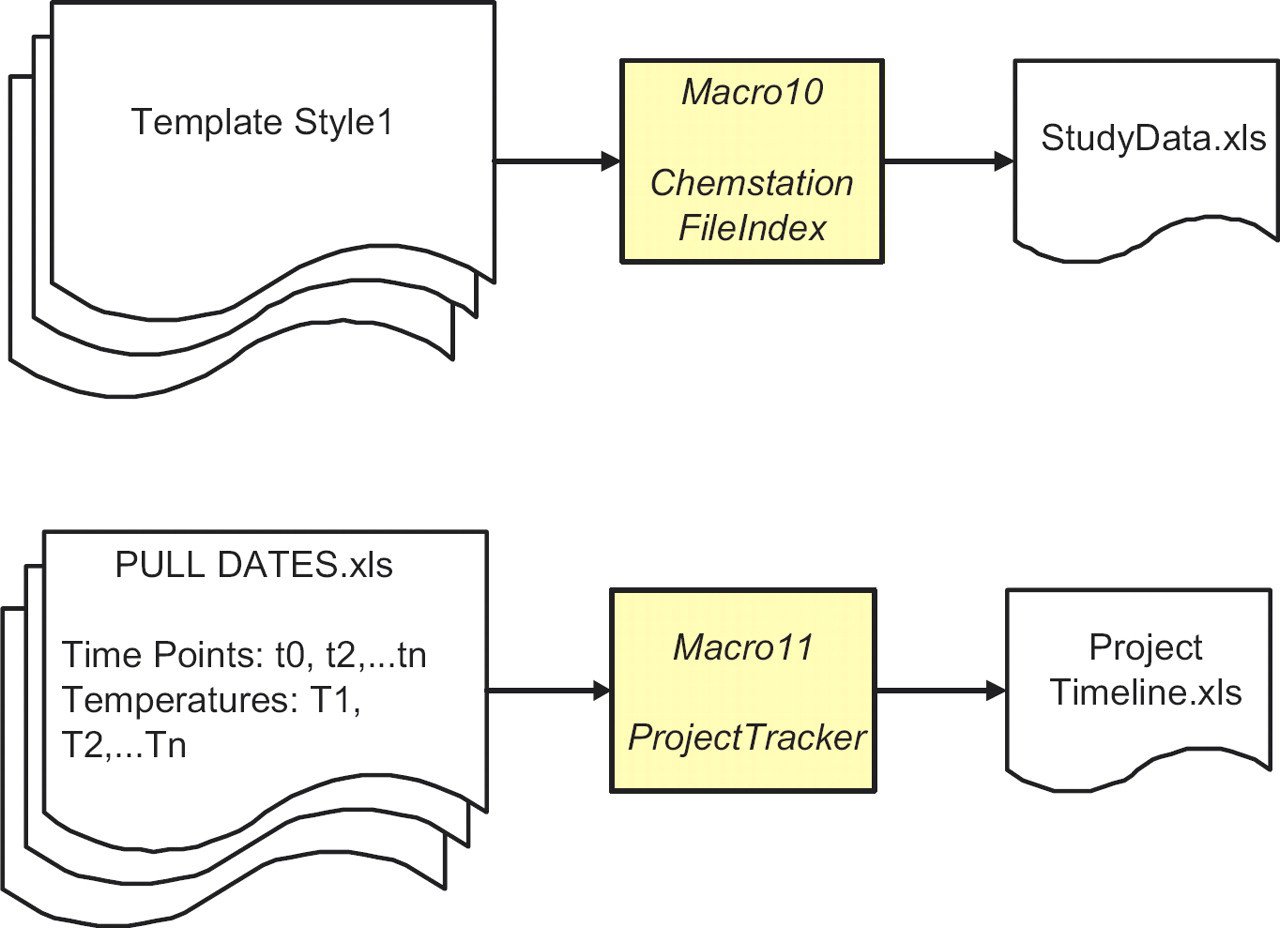
Schematic showing the compilation of the sampling schedule (pull dates) for a project to provide an overview of the progress of a project. Data audit form for all HPLC sequences and methods for a study using the header information from Template Style1.
ChemStationFileIndex (Macro 10) combines header information from several studies and is used for data audit of technical reports. It automatically includes the location of the raw chromatograms captured by ChemStationRead (see ‘Raw Data Location’ column, Fig. 4). ProjectTracker (Macro11) assembles pull dates for all studies in a project to provide a status overview. This tool projects the length of stability data from the various studies that will be available before key project decisions have to be made.
Effectiveness of the Macros
To assess the quality, efficiency, and effectiveness of the macros, responses were obtained from the group using a metrics questionnaire. The questionnaire (a Word Form) was distributed to the protein formulation group through e-mail and the responses tabulated. The results of this survey showed that ∼60% of the users found all the macros to be useful and used them routinely. For the rest, data import macros, ChemStationRead and HIACRead were the most frequently used, followed by PullDates for importing the sampling schedule into Microsoft Outlook. Each member that responded said that the use of the macros saved them at least 20% of time that they might have otherwise invested, which they can now use to interpret their data.
There are some disadvantages of this approach to data management. It is a short-term solution because there is no database at the back-end to track samples and query data across studies and projects. However, all our data are stored in a central file server (EMC Documentum, Pleasanton, CA) with versioning capabilities. The burden does lie with the user to store the files in the correct locations according to the specified hierarchy for easy access.
However, there are a number of benefits. The coding of the macros required no additional resources because as mentioned before this was performed by formulation scientists. They were tested and implemented in a short period of time and required minimal training because users are familiar with Microsoft Excel. A majority of the stability data is now being stored in a standardized format thus facilitating transfer of projects between staff. Importantly, the requirements for the macros were helpful in capturing requirements and specifications for a COTS (commercial–off-the-shelf) LIMS system. The standardized format of the data imported using the macros will allow easier migration of legacy data into the new LIMS system.
Acknowledgments
The authors thank all members in the protein formulation group who tested the functionality of the macros and provided valuable feedback. Special thanks to C. Wilkinson, B. Samady, Y. Zhang, H. Huang, N. Ball, J. Abel, A. Spencer, L. Karamujic, G. Sperrazzo, M.E. Huff Wimer, E. Kras, L. Truong and S. Paterson for their insightful requests that made the macros flexible and user friendly. We would also like to express our gratitude to M.E. Huff Wimer and M. Treuheit for a critical reading of the manuscript as well as S. Hershenson and D. Brems for their support.