
Abstract
In the quest for novel pharmaceuticals to treat important diseases, biologists often use in vitro assays to assess apparent activity. Thus, when testing novel synthetic compounds in search of a new class of drugs, it is important to know the solubility of the compound under the assay conditions used so that the activity data may be interpreted correctly. As the screening throughput increases, so do the demands on solubility determinations and the reliance on this data to aid in the selection of the more promising compounds for further studies. Since many compounds synthesized in drug discovery compounds contain UV chromophores, solubility determinations using UV plate readers are widely applicable to common druglike compounds. A more analytically rigorous approach calculates the solubility using a calibration curve rather than a ratio to a reference concentration. Rather than use the λmax of the analyte for quantification, an automated method is used for intelligent selection of the wavelength most appropriate for quantification. Using a BioMek FX and Peak Seeker, our visual basic application written in-house, 128 compounds may be assayed at a single pH within 5 h using MultiScreen Solubility plates.
Introduction
It is important to know the solubility of a novel synthetic compound under assay condition in order to interpret activity data correctly. The shake flask method 1 for determining thermodynamic solubility consists of weighing a powder into a vessel, adding solvent, agitating the mixture for typically 24 h, and sampling aliquots to determine the concentration of the dissolved analyte by quantifying with a calibration curve. While it may seem practical for a person to perform such determinations on up to 50 compounds per week, this is not sufficient to keep pace with the demands placed on solubility determinations by high throughput screening. The need to generate useful information on a large number of compounds quickly precludes the use of thermodynamic solubility determinations and requires the use of faster, more efficient methods of estimating solubility. Such kinetic solubility determinations measure the solubility of compounds in dimethyl sulfoxide (DMSO) solutions that are added to aqueous buffer. Two techniques are commonly used for kinetic solubility: nephelometry 2,3 and solution filtration followed by UV-absorption measurements. 4 Both procedures have been reported. In this technical brief, an automated method is described that examines the data, selects the most appropriate wavelength for quantification, and determines the solubility of each compound tested.
Experiment Details
Methods: Automated Liquid Handling and Assay
The procedure outlined in the MultiScreen Solubility plate (Millipore Corporation, Billerica, MA) protocol note was modified for use on a BioMek FX (Beckman Coulter, Inc., Fullerton, CA) with the following exceptions: the Minitrack (PerkinElmer, Inc., Boston, MA) was used to create the calibration curve, and the 500 nL transfers were done using the Pintool (Genomics Institute of the Novartis Research Foundation, San Diego, CA); all other liquid transfers were done using the Biomek FX. Amiodarone, tamoxifen, estradiol, diethylstilbestrol, ketoconazole, diclofenac, clofazimine, progesterone, benzthiazide, bendroflumethiazide, iodipamide, hydroflumethiazide, prednisone, butamben, hydrocortisone, and butylparaben were purchased from Sigma (Sigma-Aldrich, St. Louis, MO) and used as received. With the exception of prednisone, butamben, hydrocortisone, and butylparaben, each of the compounds was dissolved to 10 mM in DMSO. Prednisone, butamben, hydrocortisone, and butylparaben were dissolved in DMSO to create 100 mM solutions in order to increase the maximum solubility determination to 1 mM.
Creation of calibration curve plates. Using 12 μL of a 10 mM solution of each compound in DMSO, an 8-point serial dilution curve was constructed in a 384-well plate to span from 10 mM (10,000 μM) to 34.3 μM. Using a pintool developed in-house, 500 nL of each solution was transferred to a UV transparent 384-plate (Part Number 781801, Greiner Bio-One, Inc., Longwood, FL) containing 49.5 μL of buffer containing 20% (v/v) acetonitrile as a cosolvent to help the compounds remain dissolved. The final concentration of DMSO was kept to 1% (v/v) to mimic the concentration of DMSO used for the solubility determinations.
Creation of the assay plate used for solubility and the details of the assay. In order to reduce the impact DMSO may have on the determined solubility, each of the final buffer solutions used for solubility determination contained 1% (v/v) DMSO. Three microliters of each 10 mM solution were transferred to 297 μL of buffer, and the mixtures were shaken at 300 rpm for 90 min at room temperature. After the incubated shaking was completed, plates were centrifuged at 1000 rpm for 3 min, and 100 μL were transferred from each well to a MultiScreen solubility plate for vacuum filtration into a collection plate. Forty microliters of this filtrate were transferred to a UV transparent 384-well plate containing 10 μL of acetonitrile. The incorporation of acetonitrile serves the dual function of matching the matrix of the analyte to that of the calibration curve, and assists in preventing losses due to nonspecific binding.
Collection of UV Data
Using a SpectraMax Plus384 (Molecular Devices, Sunnyvale, CA), the UV data spanning 220–500 nm in 10 nm steps were collected for each of the wells in each 384-well plate. The step size was chosen to minimize data collection time and maximize the range of wavelengths examined. Representative UV absorbance data for butamben are shown in Figure 1
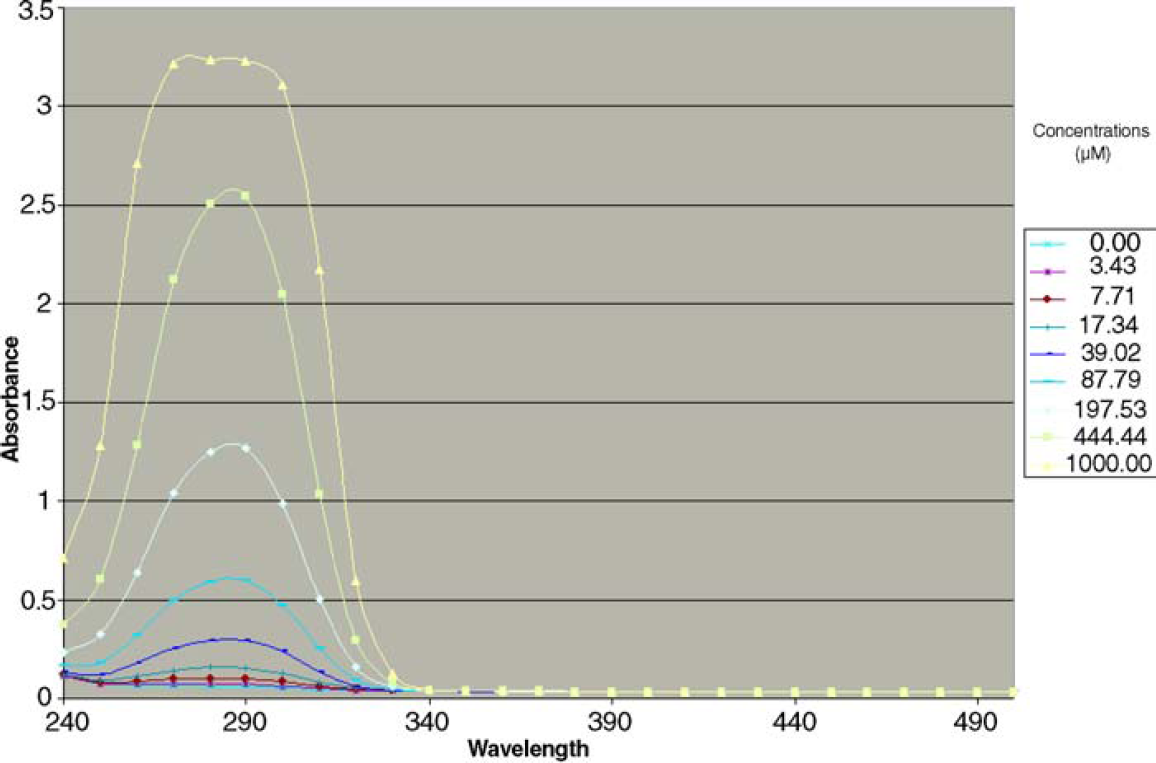
Spectra of butamben at eight concentrations.
Automated data analysis: Selection of wavelength for quantification (peak seeking). Given a dilution series for a compound, the application determines the optimal wavelength to use for concentration determination for this compound. As shown in Table 1 for butamben, the selection of wavelength for quantification is critical for accurate solubility determination. Each wavelength in the UV-visible spectral data is fitted to a line, and the responses of the two highest concentrations are compared. The algorithm then selects the most accurate solubility using the following procedure:
An example of data evaluation done by Peak Seeker for butamben
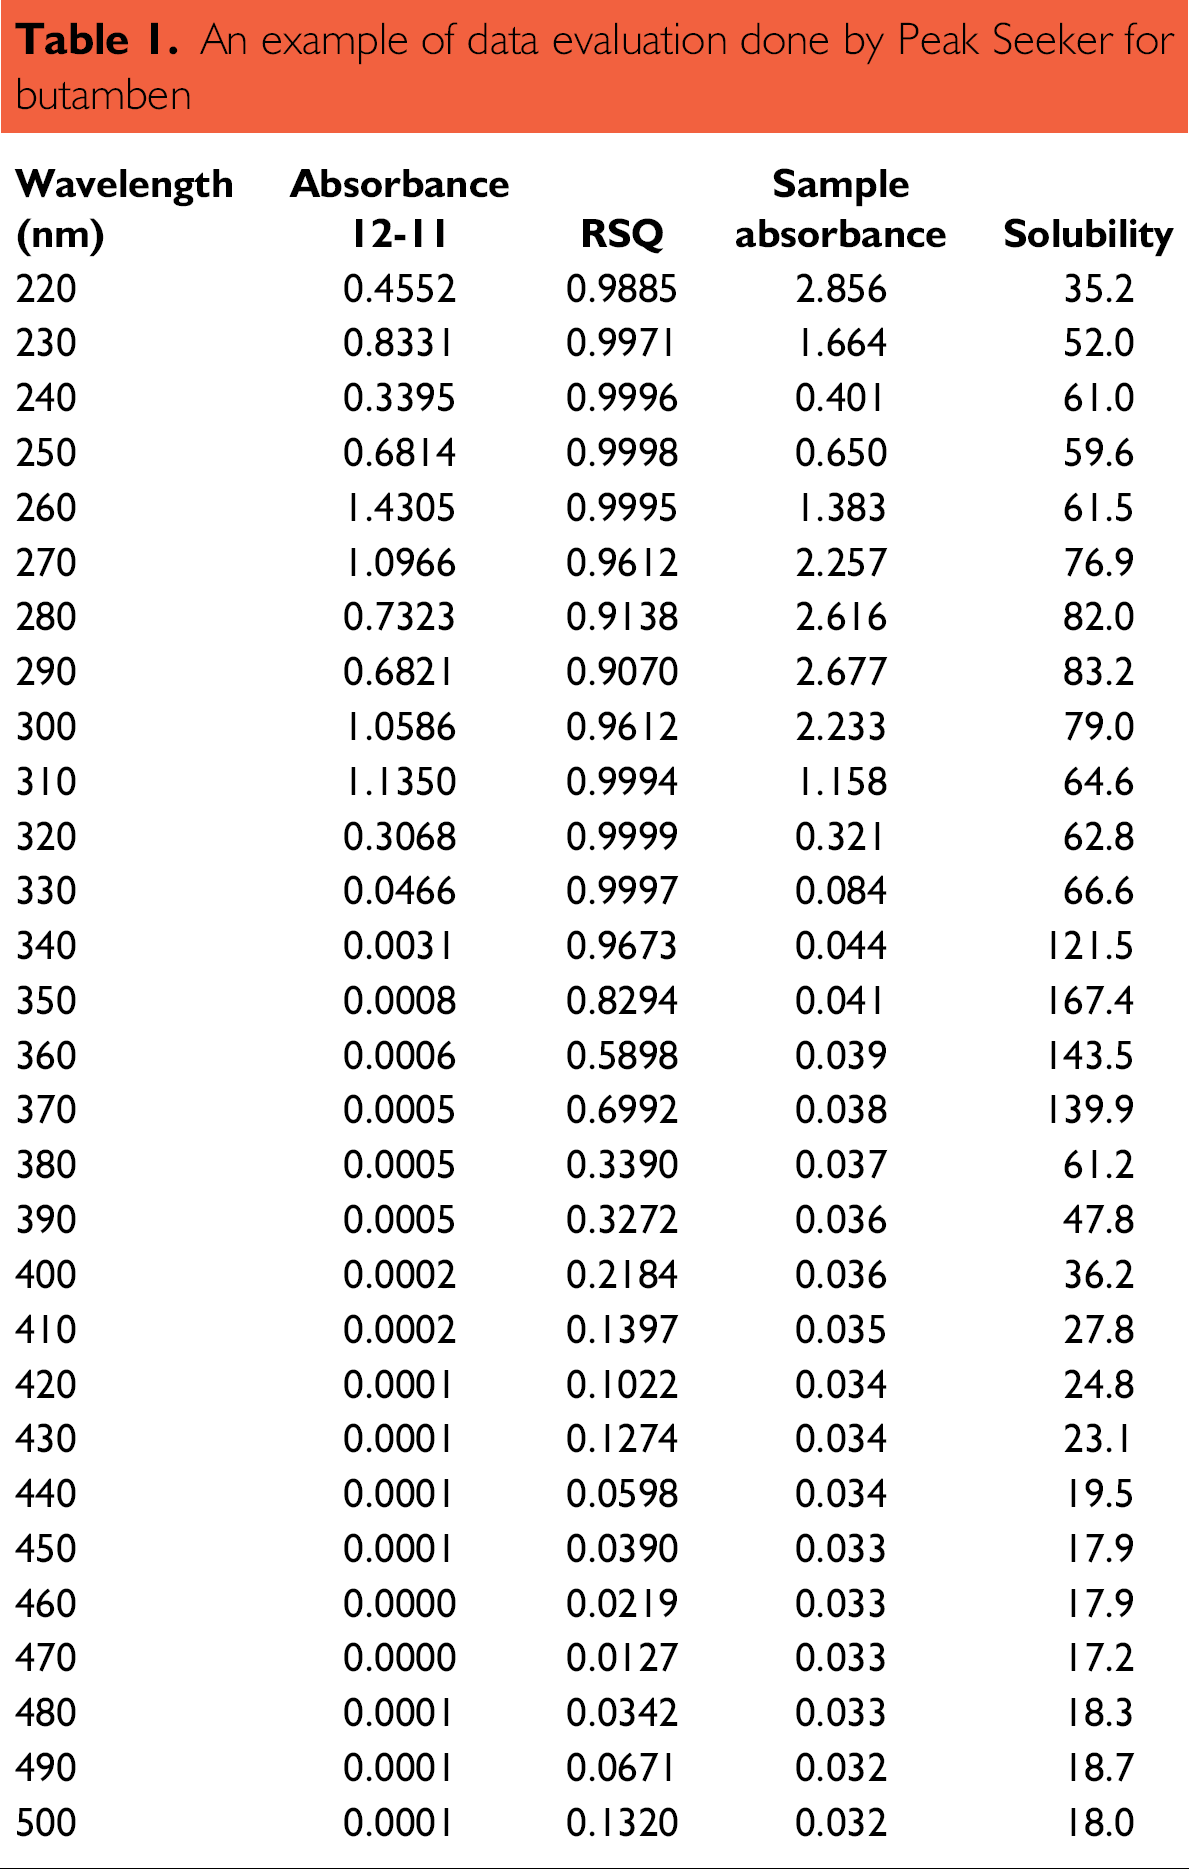
The wavelengths are ranked in descending order based on the absolute differences between the two highest concentrations. The correlation calibration curve created using each wavelength is evaluated. If the correlation at the wavelength with the greatest difference in response does not fit the >0.999 criterion, each wavelength meeting the minimum difference (determined by noise level) is checked until this correlation requirement is met. If met, the corresponding solubility is reported. If no wavelength is found that meets the minimum absorbance difference and the >0.999 correlation criteria, the correlation criterion is loosened stepwise from 0.999 to 0.995 to 0.99 to 0.95, and, finally to 0.9, and the data is reevaluated using each modified threshold. Once a wavelength is found that satisfies these two criteria, the calculated solubility is reported and no further evaluation occurs. If the application cannot identify any wavelength matching these criteria, it is assumed that the compound response is saturating the detector at the highest concentration, or random error happened to one of the data points. The point corresponding to the highest concentration on the curve is removed and the process is repeated by removing the next highest concentration while putting the removed point back in the calibration curve. The process of removing one data point at a time and correlation reevaluation will stop after the fifth highest concentration is removed. If no wavelength is found to meet the criteria, the compound is marked for additional attention.
Results and Discussion
Automated Data Analysis Using Peak Seeker
The UV absorbance data for the 1000 μM concentration of butamben, shown in Figure 1, clearly indicates saturation at several of the wavelengths measured. If the λmax of 290 nm, as may be selected from examination of the less-concentrated solutions in the dilution series, were used to construct the calibration curve, the calculated concentration would be 832 μM as shown in Table 1, an overestimate of 35%. Peak Seeker selected 260 nm for quantification of butamben, the most sensitive wavelength with a 0.9995 correlation between response and concentration. Peak Seeker determined the solubility of butamben to be 615 μM.
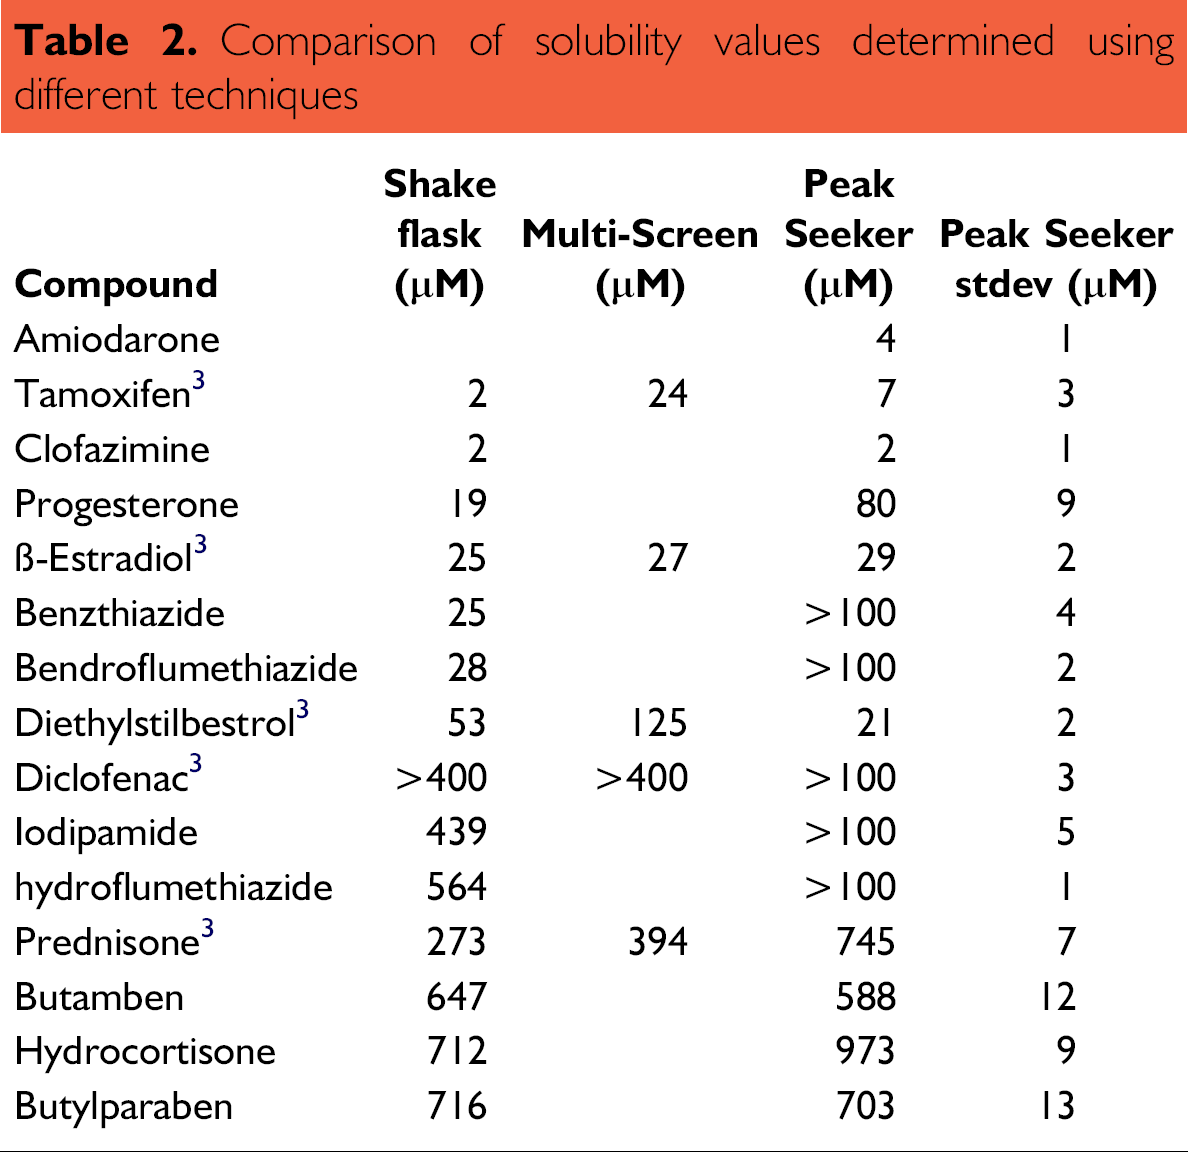
Table 2 compares the solubility determined for a set of fifteen compounds using the method described in this technical brief with literature values as a function of different techniques. The experimental procedure reported herein reduced standard deviations in determined solubility to <2 μM for 83% of the compounds. Not all of the kinetic solubility data in Table 2 agree with the literature values for thermodynamic solubility. The disagreement between the results of the two experimental methods is a limitation of kinetic solubility that has been reported 1 to be due in part to the presence of 1% (v/v) DMSO in the buffer solutions. Since biochemical or cell-based high throughput screening assays often dose DMSO solutions of compound collections, the kinetic values may better represent the concentrations achievable during these assays.
Comparison of solubility values determined using different techniques
Conclusions
As shown in this report, the accuracy of experimentally determined solubility is dependent upon choosing the correct wavelength for quantification. The Peak Seeker algorithm automates the decision-making process that a skilled scientist would perform. It was found that accuracy and precision were improved by incubating the plates and centrifuging them prior to transferring the supernatant for vacuum filtration through the MultiScreen solubility plates. Given the ease of processing large numbers of samples using automated liquid handling and automated UV-visible spectra analysis using Peak Seeker, 128 compounds may be assayed at a single pH within 5 h. The data presented is in agreement with a literature report 5 that indicated more accurate solubility determinations are achieved with calibration curves than with flux ratios. 6