
Abstract
Acoustic energy can precisely and accurately eject a droplet of liquid from a reservoir, enabling delivery of picoliter and nanoliter volumes (Ellson, R.; Mutz, M.; Browning, B.; Lee, L.; Miller, M.; Papen, R. Transfer of low nanoliter volumes between microplates using focused acoustics—automation considerations. Journal of the Association for Laboratory Automation 2003, 8(5), 29–34). Acoustic droplet ejection has been shown to be extremely precise (coefficients of variation < 2%) over a wide range of dispensed volumes (Ellson, R.; Mutz, M.; Browning, B.; Lee, L.; Miller, M.; Papen, R. Transfer of low nanoliter volumes between microplates using focused acoustics—automation considerations. Journal of the Association for Laboratory Automation 2003, 8(5), 29–34). However, measuring the performance of low-volume fluid transfers can be difficult because the data are often masked by variability in bulk dispensers and fluorescence readers used as part of the overall measurement process (Petersen, J.; Nguyen, J. Comparison of absorbance and fluorescence methods for determining liquid dispensing precision. Journal of the Association for Laboratory Automation 2005, 10(2), 82–87; Rhode, H.; Schulze, M.; Renard, S.; Zimmerman, P.; Moore, T.; Cumme, G.; Horn, A. An improved method for checking HTS/uHTS liquid handling systems. Journal of Biomolecular Screening 2004, 9, 726–733). The fluorophore used must also be stable so that thermal bleaching and photobleaching do not contribute additional variability to the measurements. This study assesses the suitability of fluorescein to measure the precision of fluid transfers of 2.5-nL DMSO droplets. The short-term and long-term stabilities of fluorescein are first qualified using a reference standard. Next, we determine the noise contribution of the filler and reader. Lastly, data are presented for the precision of 5- and 50-nL fluid transfers using this fluorescein measurement process. (JALA 2006;11:233–9)
Keywords
Introduction
Fluorescent dyes are commonly used to measure the accuracy and precision of fluid-dispensing instruments. However, fluorescence signal strength can drift over time, due to either degradation of the dye or changes in reader performance. Fluorescence is a relative measurement; therefore, performance validation measurements require reference standards to account for drifts in the strength of the fluorescent signal. 1 Additionally, good short-term and long-term dye stabilities reduce measurement error and minimize the burden of making and qualifying solutions.
Fluorescein is a compelling choice for these measurements. Although photobleaching may be a concern with very low dye concentrations encountered in labeled biological samples, fluid volume measurements herein use relatively high fluorescein concentrations that minimize the bleaching contribution to within the inherent experimental noise. Additionally, our experiments indicate that stock solutions of fluorescein exhibit excellent stability for at least 7 months. Fluorescein is also safe to handle due to low toxicity (LD50(rat, oral) = 6.7 g/kg) 2 and is very cost effective at about $0.10 per gram.
Materials and Methods
Chemical Solutions for Volume and Stability Measurements
Fluorescein “mother” stock solution (0.50 mM) was prepared by adding 0.301 g of sodium fluorescein (Sigma, cat. #F6377, St. Louis, MO) to 1600 mL anhydrous DMSO (dimethyl sulfoxide, Sigma–Aldrich, cat. #276855, St. Louis, MO) from a septum-sealed bottle. Fluorescein “daughter” stock solutions were prepared by diluting the mother stock into DMSO/H2O mixtures to give a final fluorescein concentration of 0.15 mM and DMSO concentrations of 70%, 80%, 90%, and 100%. Fluorescence determinations confirm that fluorescein concentrations across the four daughter stocks agree to within ±1%.
A mother stock of 0.5 mM Oregon Green 488 (Invitrogen, cat # D6145, Carlsbad, CA) dye analogous to the fluorescein stock was made by weighing out 0.0804 g of Oregon Green 488 and dissolving in 443.1 mL DMSO. Four daughter stocks at 0.15 mM Oregon Green 488 each and 70%, 80%, 90%, and 100% DMSO were made by diluting into DMSO/H2O mixtures.
Sodium hydroxide solution (10 mM) was prepared by adding 1 mL of 10 N NaOH (J. T. Baker, Phillipsburg, NJ) to deionized water to a final volume of 1 L. All solutions used in this study are summarized in Table 1.
Summary of fluorophore concentrations and fluid transfer methods
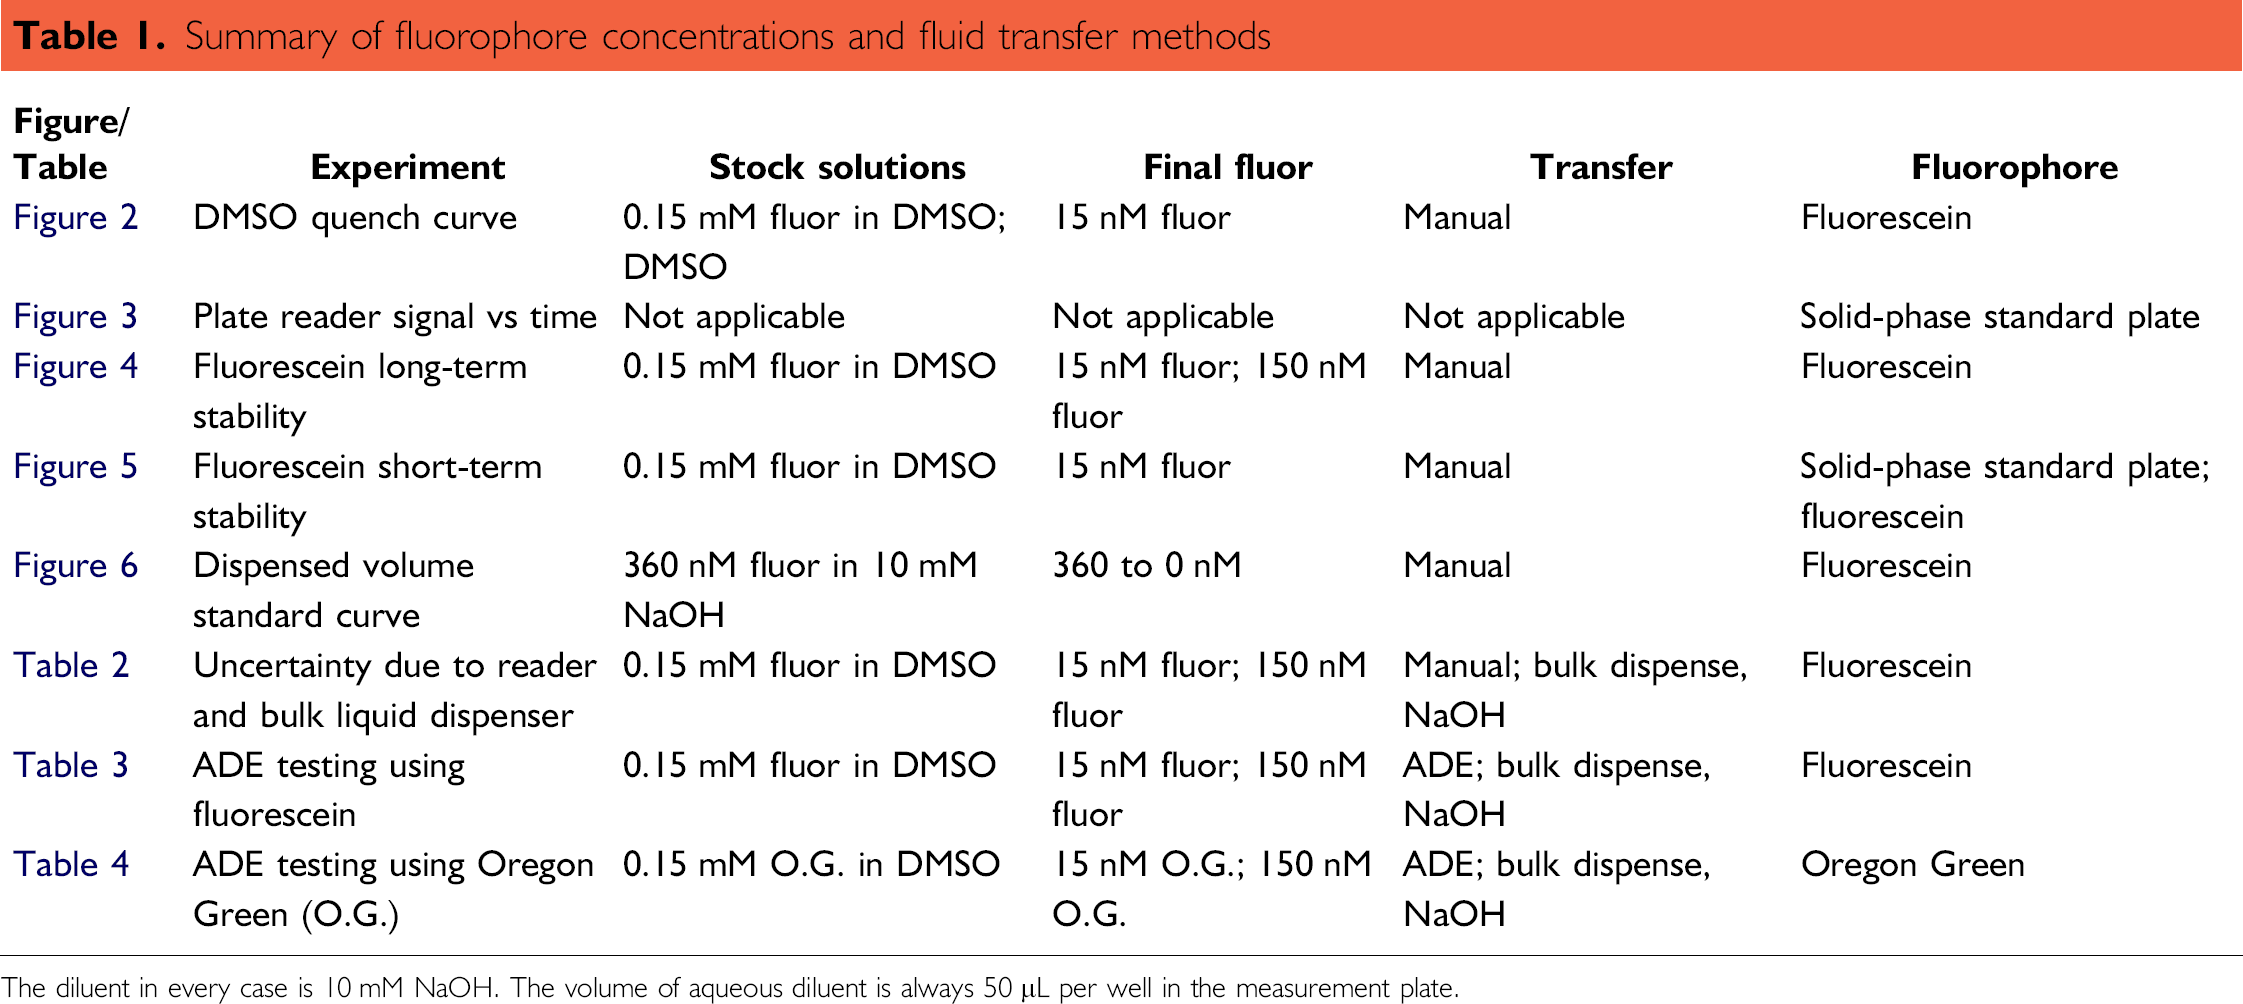
The diluent in every case is 10 mM NaOH. The volume of aqueous diluent is always 50 μL per well in the measurement plate.
Solutions for DMSO Fluorescence Quenching
For the DMSO quench experiment (see Fig. 2), nine test solutions were made by first diluting (using a Pipetman pipettor, Gilson, Middleton, WI) 10 μL of 0.15 mM fluorescein/DMSO solution with 10 mM NaOH solution to 50 mL. Anhydrous DMSO was then added (0, 40, 90, 190, 490 μL, 1, 2, 5, and 10 mL) to each, and the volume was brought to 100 mL with 10 mM NaOH, resulting in a final fluorescein concentration of 15 nM for each. Final DMSO concentrations were thus 0%, 0.01%, 0.05%, 0.1%, 0.2%, 0.5%, 1%, 2%, 5%, and 10%, v/v.
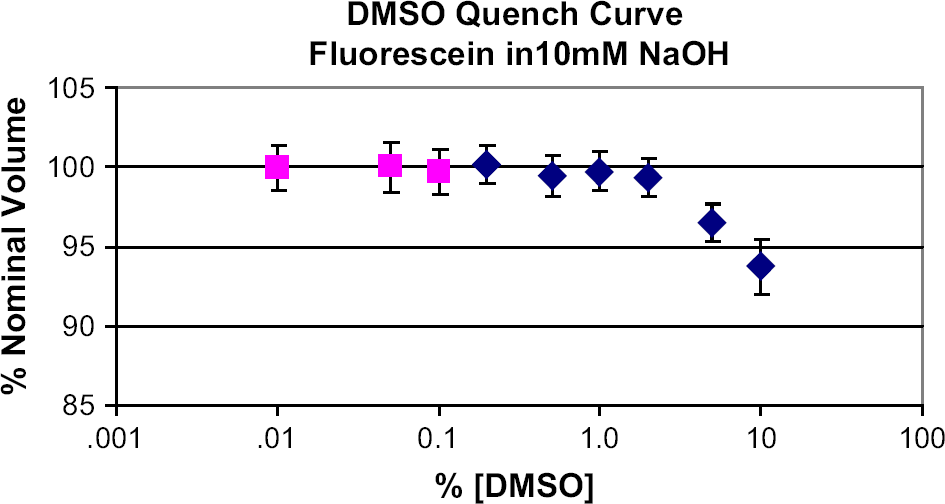
The ADE and transfer volume determination process for the Labcyte Echo 550 are depicted. The same fluorescein stock solution, type of measurement plate, plate reader, and final well volume are used for both the ADE transfer and for the plate used to generate the standard curve. As an example, a 5-nL volume dispensed into a well with 50 μL of diluent yields an expected 1:10,000-fold dilution of a 0.15-mM fluorescein stock solution, giving a final concentration of 15nM. The fluorescence intensity of this resulting 15nM solution is then compared with the expected fluorescence intensity for a 15nM solution as determined previously by the standard curve. DMSO noticeably quenches the fluorescence of alkaline fluorescein solutions at concentrations greater than 1%. In a typical ADE experiment, between 5 and 50 nL of fluorescein in 100% DMSO is transferred to a receiver plate, and 50 μL of 10 M NaOH is added. This yields a concentration range of 0.01–0.1% DMSO in the final, measured solution (red squares). DMSO shows no measurable effect on fluorescein emission at these concentrations.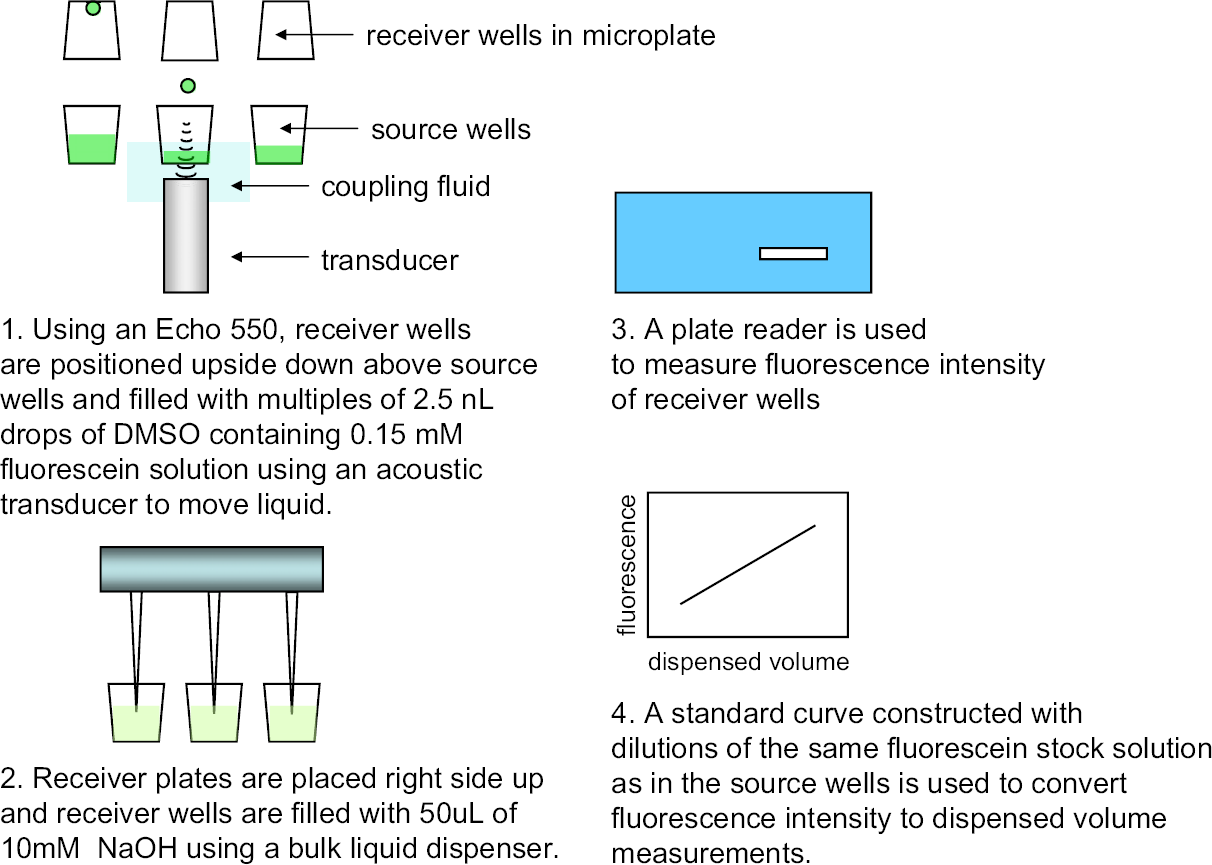
Solutions for Stability Testing
A 150-nM fluorescein/NaOH bulk solution was prepared by adding 50 μL of 0.15 mM fluorescein/DMSO solution to 50 mL of 10 mM NaOH. A Pipetman was used to transfer the fluorescein/DMSO aliquots. A 15-nM fluorescein/NaOH bulk solution was made by subsequently diluting the 150-nM solution 1:10 in 10 mM NaOH. One or both of these types of solutions were used in the long-term and short-term stability tests (Figs. 4 and 5), and in correcting for the error due to the bulk pipettor and reader (see Table 2).
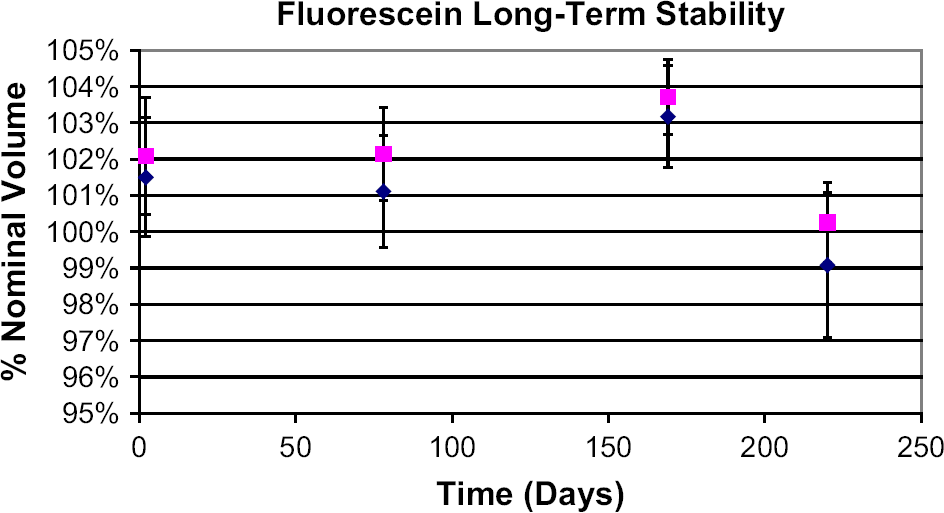
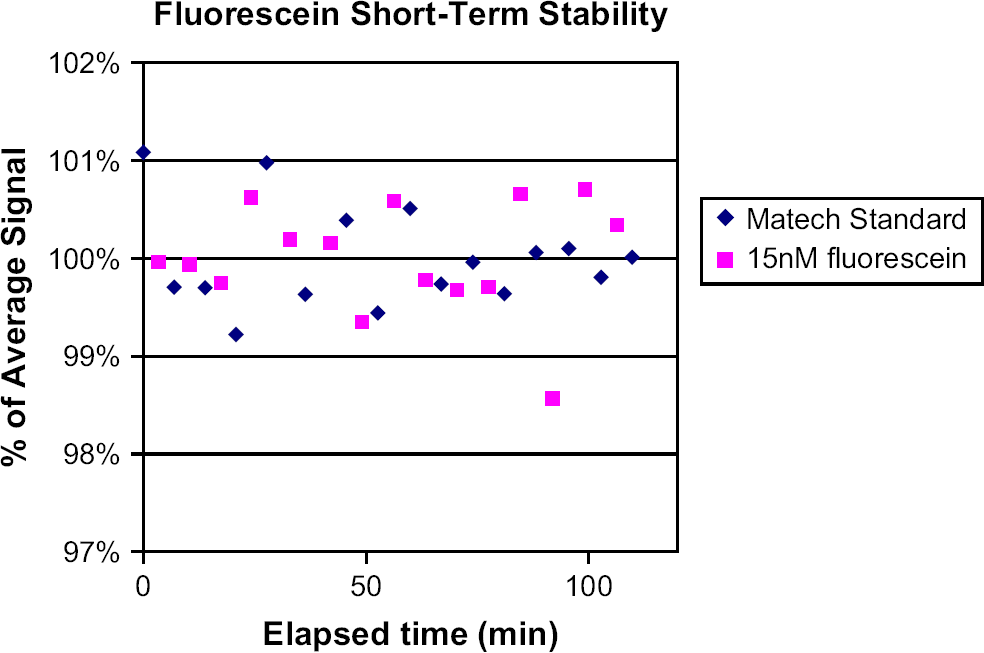
Repeated reads of a solid-phase fluorescence reference standard plate over 130 min. The first read (red square) is routinely omitted from the fit. Note that the maximum deviation of any point from the fit is on the order of ±1%. Plates were read in a SPECTRAFluor Plus plate reader. Fluorescein signal does not decrease when stock solutions are stored up to at least 7 months. Red squares indicate 1:1000 dilution, and blue diamonds indicate 1:10,000 dilution. Error bars are ±1 standard deviation for the 384-well plate. Data shown are for 0.15 mM fluorescein stock in 100% DMSO. A 70% DMSO solution was also tested at two points: time zero and 7 months. Results were similar (data not shown). The ±2% variation in measured nominal volume over 7 months is similar to our observed variation of ±2% for accuracy measurements using fluorescein. A 15-nM dilution of fluorescein in NaOH shows no photobleaching in repeated reads in a fluorescence plate reader over 110 min. A plate containing 15 nM fluorescein in 10 mM NaOH was read repeatedly, alternating with reads of a solid-phase fluorescence reference standard plate in the same reader (1420 Victor3). Note that the extent of signal variation is similar in both the reference plate and the experimental plate containing fluorescein, and that random variation occurs about the mean. Note also that the maximum deviation of any solid-phase reference standard data point from the average is on the order of ±1% (compare with Fig. 3). Over a similar time course, repeated reads of a plate containing 15 nM fluorescein and a solid-phase standard plate in the 2100 EnVision or SPECTRAFluor Plus also fail to demonstrate photobleaching of fluorescein (data not shown).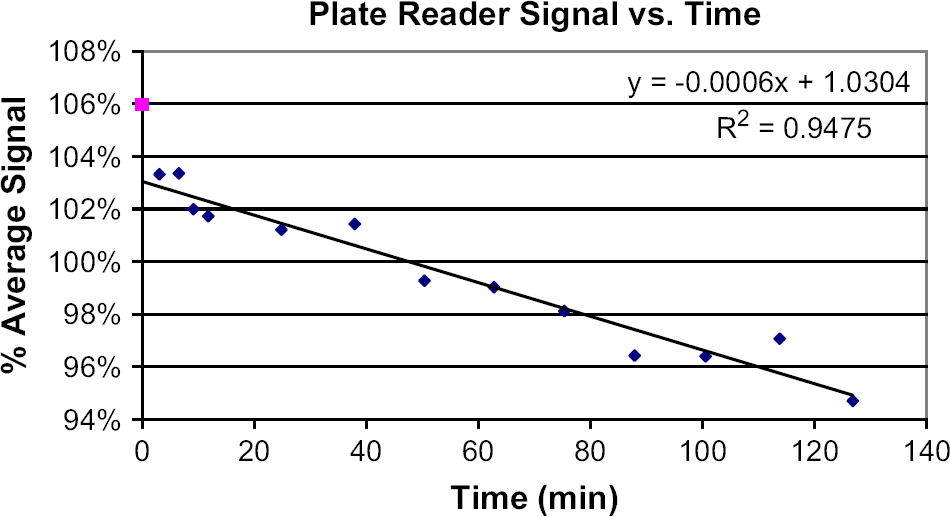
Uncertainty due to reader and bulk liquid dispenser
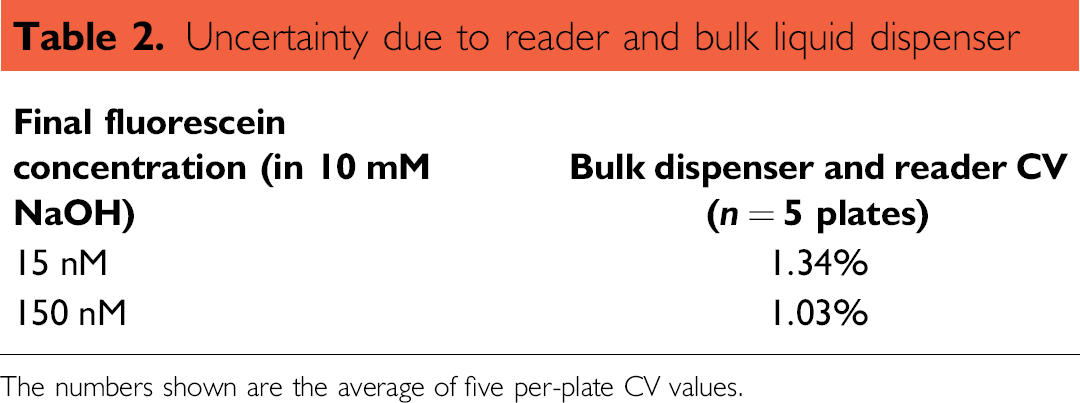
The numbers shown are the average of five per-plate CV values.
Preparation of Standard Curve for Dispensed Volume Measurements
A typical transfer volume standard curve consists of a two-fold serial dilution of sodium fluorescein ranging from 360 down to 2.8 nM in 10 mM NaOH, and includes wells of 10 mM NaOH only (0 nM fluorescein). The 360-nM solution is made by adding 72 μL of a 0.15-mM fluorescein solution in DMSO (using a Pipetman) to 30 mL of 10 mM NaOH. This curve is prepared by successive two-fold dilutions of the 360-nM fluorescein solution in 10 mM NaOH using a hand-held multichannel pipettor (Brand Transferpette-12 pipettor, BrandTech Scientific, Essex, CT). The multichannel pipettors and Pipetman are standardized gravimetrically. The plate containing the serial dilution plus blank wells containing only 10 mM NaOH (50 μL per well) is read in a fluorescence plate reader to create the final standard curve.
Acoustic Drop Ejection
Multiples of 2.5-nL drops were transferred from source plates to receiver plates via acoustic drop ejection (ADE) using a Labcyte Echo 550 compound reformatter (Labcyte, Sunnyvale, CA). Source plates (Labcyte cat. #P-05525) are specially qualified for use in acoustic transfer. Once the drops have been transferred, the receiver plates are filled with 50 μL of 10 mM NaOH using a bulk liquid dispenser (Evolution P3 dispenser, PerkinElmer, Boston, MA), and the fluorescence intensity is measured in a plate reader. A standard curve is used to convert fluorescence data into volume transferred as shown in Figure 1.
Fluorescence Measurements
Fluorescent signal from receiver microplates (Greiner cat. # 781096, Monroe, NC) was measured using a fluorescence plate reader with excitation wavelength centered at 485 nm and emission filter centered at 535 nm (either a SPECTRAFluor Plus reader, Tecan, Männedorf, Switzerland or a Wallac 1420 VICTOR3 reader, PerkinElmer, Boston, MA), or a fluorescence plate reader with excitation wavelength centered at 450 nm, and emission centered at 535 nm (Wallac 2100 EnVision reader, PerkinElmer, Boston, MA) using appropriate bandpass filters. The readers were varied to avoid reader-specific conclusions although no attempt has been made to compare readers across every experiment.
Solid-Phase Standard Reference Fluorescence Plate
Plates were from Matech (Westlake Village, CA). HT-517 or BR-517 plates were used ($750 per plate and $650 per plate, respectively).
Results
Fluorescein Signal Stability
It is well known that fluorescein is susceptible to photobleaching. 3 However, the extent of photobleaching is dependent on many factors such as conjugation of the dye to other molecules, flux of light impinging on the fluorophore, solvent used, and dye concentration. 4 For example, when fluorescein-labeled biomolecules are imaged with laser-based confocal scanning microscopy, signal intensity decreases faster with time compared to stabilized fluorescein derivatives such as Oregon Green. 5 This context-dependent photobleaching has given rise to the misconception that fluorescein is generally unsuitable for quantitative work of any kind. Data collected over several years using sodium fluorescein yield per-plate coefficients of variation (CV) of less than 2%. 6
Fluorescence Quenching by DMSO
To assess the suitability of fluorescein as a stable indicator in the presence of DMSO, nine samples with constant fluorescein concentration (15 nM in 10 mM NaOH), but varying concentrations of DMSO were measured for fluorescence using the 2100 Envision reader with an excitation filter centered at 450 nm and an emission filter centered at 535 nm. The results show that DMSO quenches fluorescein at DMSO concentrations greater than 1% (Fig. 2). Quenching does not contribute to error in the current study where the maximum DMSO concentration is 0.1%.
Correcting for Inherent Signal Drift in Plate Reader
The performance of all optomechanical devices changes over time with inherent short-term fluctuation (drift) and long-term aging of the light sources, detectors, and moving parts. Short-term drift, which is often mistakenly attributed to dye instability, can be caused by fluctuations in lamp energy, photomultiplier drift, and/or temperature drift as the instrument warms up with use. These changes should be tracked and corrected where possible to minimize experimental error.
To measure fluorescence plate reader drift, a reference plate containing a solid-phase stable inorganic fluorophore (Green Fluorescent Reference Standard, Matech, Westlake Village, CA) was read in the Spectrafluor Plus approximately every 10 min over 130 min. The downward, linear signal drift on this instrument is apparent in Figure 3. Drift that occurs during the time between reading a standard curve plate and an experimental plate can be quantified and corrected as follows. The stable reference plate is read immediately before and after reading the standard curve plate, and the two reference reads are averaged. When the experimental test plate is read, the read is again bracketed by reads of the stable reference plate, and the reference reads are averaged. The ratio of the two averaged reference read values provides a drift correction factor. The standard curve is first used to determine the volumes of the experimental test plate, and these volumes are then multiplied by the correction factor. This corrects for any instrument drift that might have occurred during the time between developing the standard curve and running the experiment.
It is important to note that not all plate readers behave in the same manner. For example, the Victor3 instrument does not exhibit the declining drift seen in the SPECTRAFluor Plus (see Figures 5 and 3, respectively). The 2100 Envision reader shows a “flat” signal (random distribution about an average) over time (hours or days) that tends to “step” a few percent up or down over a period of weeks. We have evaluated a number of plate readers for purchase and have rejected several that had a flat signal on average, but whose precision was so poor (CV > 1% over repeated reads) that they were unusable.
We impose the drift correction based on the solid-phase standard plate read in every case, as it can correct for a step discontinuity in reported signal as well as a linear drift.
Long-Term Stability of Fluorescein Stock Solution
To evaluate the long-term stability of fluorescein, a solution of 0.15 mM sodium fluorescein in 100% DMSO was stored in the dark in a tightly sealed polypropylene bottle. Aliquots were removed from the source periodically, and diluted 1:1000 and 1:10,000 into 10 mM NaOH. These dilutions were transferred, 50 μL per well, to a 384-well plate (Greiner Bio-One cat. #781096, Monroe, NC) and the fluorescence intensity of the plates was recorded using a 2100 Envision plate reader, applying the reader drift correction as above. The stability of 0.15 mM sodium fluorescein in 70% DMSO was also evaluated at the start and end of the 7-month time course. At the relatively high concentration used in these studies, fluorescein exhibits no significant signal degradation with up to 7 months storage (Fig. 4).
Short-Term Stability of Fluorescein
To assess short-term photobleaching, we used the 1420 VICTOR3 plate reader and exposed 15 nM fluorescein in 10 mM NaOH and the solid-phase reference plate to a constant illumination lamp for periods of 100 μs, at 5- to 6-min intervals over 110 min. These experiments reveal no noticeable bleaching of either the fluorescein or the reference plate over the duration of the test (Fig. 5). The average signal from the fluorescein was constant over time, showing random scatter about the average. This pattern was similar to the solid-phase reference plate. Similar results were seen with the SPECTRAfluor Plus and 2100 Envision readers (data not shown).
Linearity of Fluorescein Signal
A typical dispensed volume standard curve (described in Typical ADE dispensing volume standard curve. The 120-nL volume point is excluded from the fit. The curve represents the dilution of drops of 0.15 mM fluorescein in DMSO into 50 μL of 10 mM NaOH in the receiving well. Therefore, a total dispensed volume of 5 nL corresponds to a final concentration of 15 nM fluorescein in NaOH. The curve is used in the range of 5–50 nL total drop volume transferred. An inset shows an expanded view of the 0–10 nL dispensed volume portion of the curve.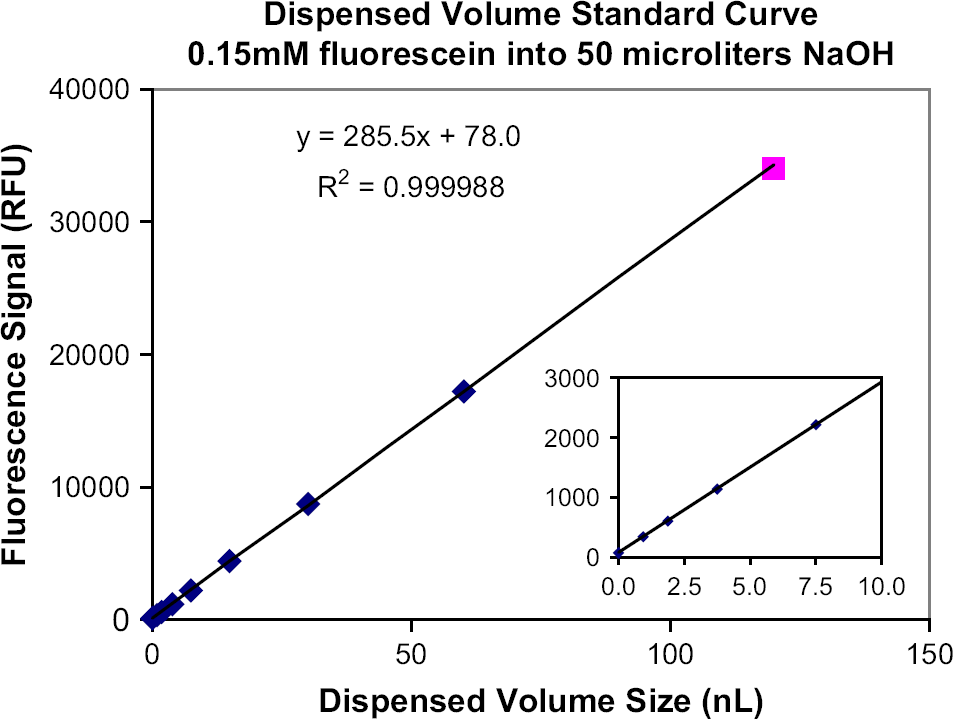
Precision Measurements
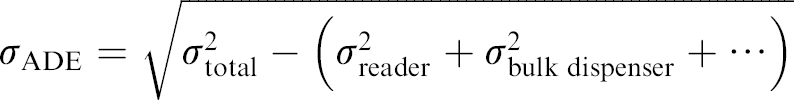
In general, the square of the total error in a system is equal to the sum of the squares of all the contributing errors if the errors are independent of each other. If a first experiment measures the total error contribution of all instruments, that is, bulk liquid dispenser, plate reader, and ADE combined, and a second experiment is performed that eliminates the contribution of bulk dispenser and reader, the error due to ADE can be calculated as follows:
To determine the error contributions from the bulk liquid dispenser and the 2100 Envision plate reader, plates were bulk-filled with homogenous fluorescein solutions. Using the bulk liquid dispenser equipped with a 384-channel head, two replicate sets of five 384-well plates (Greiner Bio-One cat. #781096) were filled: one set with 50 μL of 15 nM fluorescein (in 10 mM NaOH), and the other set of five plates filled with 150 nM fluorescein. Each plate was read on the 2100 Envision plate reader using the solid-phase stable reference plate for drift correction as above. Fluorescence was measured for each well, and the per-plate CV was calculated across each plate to measure well-to-well variation (Table 2).
To determine the variation associated with ADE, Echoqualified source microplates (Labcyte Inc., cat. #P-05525, Sunnyvale, CA) were filled with 0.15 mM fluorescein in DMSO solutions containing varying concentrations of water (70%, 80%, 90%, and 100% DMSO). To validate that ADE was insensitive to the volume in the source microplate, the ejections of each DMSO/water solution were measured at different source fill volumes (20, 30, 40, and 50 μL) of fluorescein/DMSO. Using the Echo 550 liquid handler, 5 nL of 0.15 mM fluorescein in 70% DMSO was ejected into each well of two separate 384-well plates using multiples of 2.5-nL drops. This was repeated for fluorescein in 80%, 90%, and 100% DMSO, and again with 50-nL transfer volumes. Thus, each of the eight conditions was tested in 768 wells, for a total of 6144 measurements. All wells were bulk-filled with 50 μL of 10 mM NaOH to yield final fluorescein concentrations of 15 and 150 nM. Fluorescence was measured for each well to calculate the average variation (Table 3). The variation contribution from ADE was isolated using the calculation of the sum of squares error.
ADE testing using fluorescein
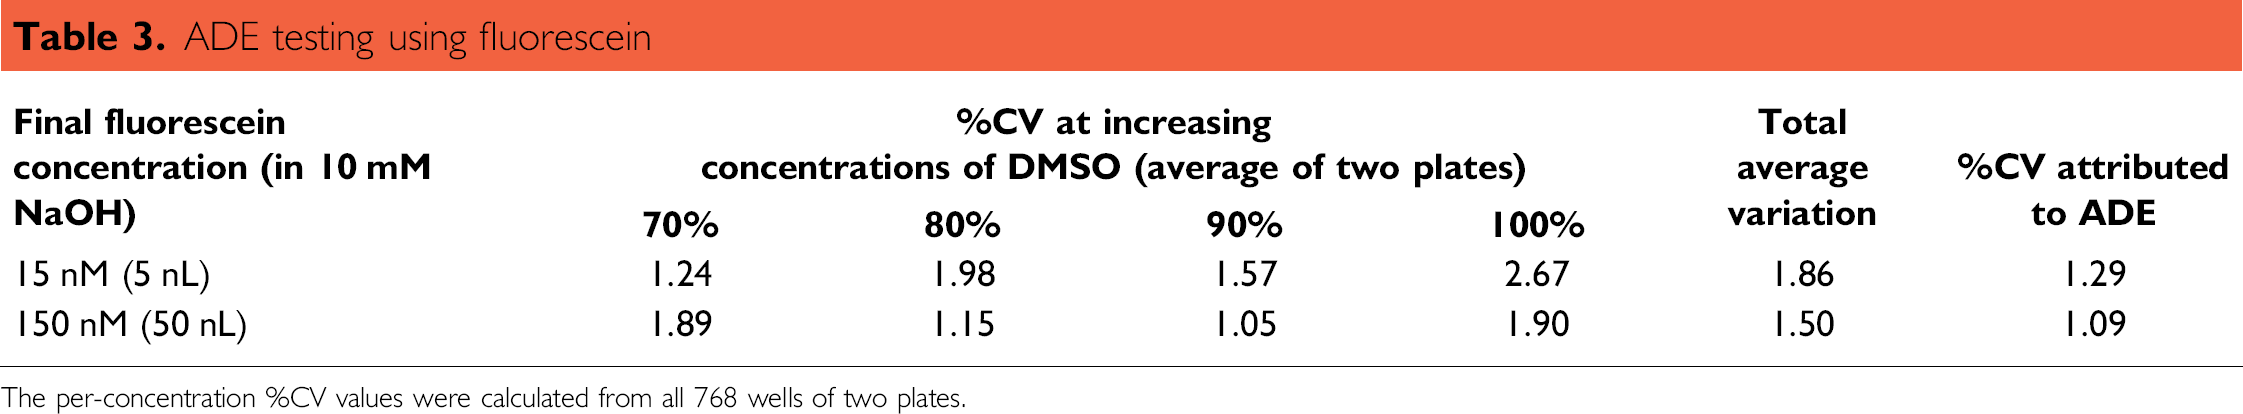
The per-concentration %CV values were calculated from all 768 wells of two plates.
The combined variation associated with the 2100 Envision plate reader and the Perkine Elmer Evolution P3 pipetting platform (bulk dispenser) was 1.34% for 15 nM fluorescein and 1.03% for 150 nM fluorescein (Table 2). Total combined error measured for the bulk liquid dispenser, fluorescence reader, and ADE was 1.86% for 5 nL transfers and 1.50% for 50 nL transfers. As shown in Table 3, using the sum of the squares of standard deviations calculation to isolate the ADE variation contribution yields a total %CV for ADE to be 1.29% at 5 nL and 1.09% for 50 nL. In these experiments, higher fluorescein concentrations are associated with lower error; however, additional studies must be conducted to determine whether this is a statistically valid correlation.
Sample calculation (5-nL transfer case):

The experiment was repeated using the Oregon Green 488. The methods and measurement were analogous, except for the choice of dye. Since Oregon Green's fluorescence is stabilized relative to fluorescein with respect to photobleaching, we wanted to see if this dye offered any improvement in precision data quality in an ADE transfer. As shown in Table 4, Oregon Green showed no advantage over fluorescein.
ADE testing using Oregon Green and comparison with fluorescein
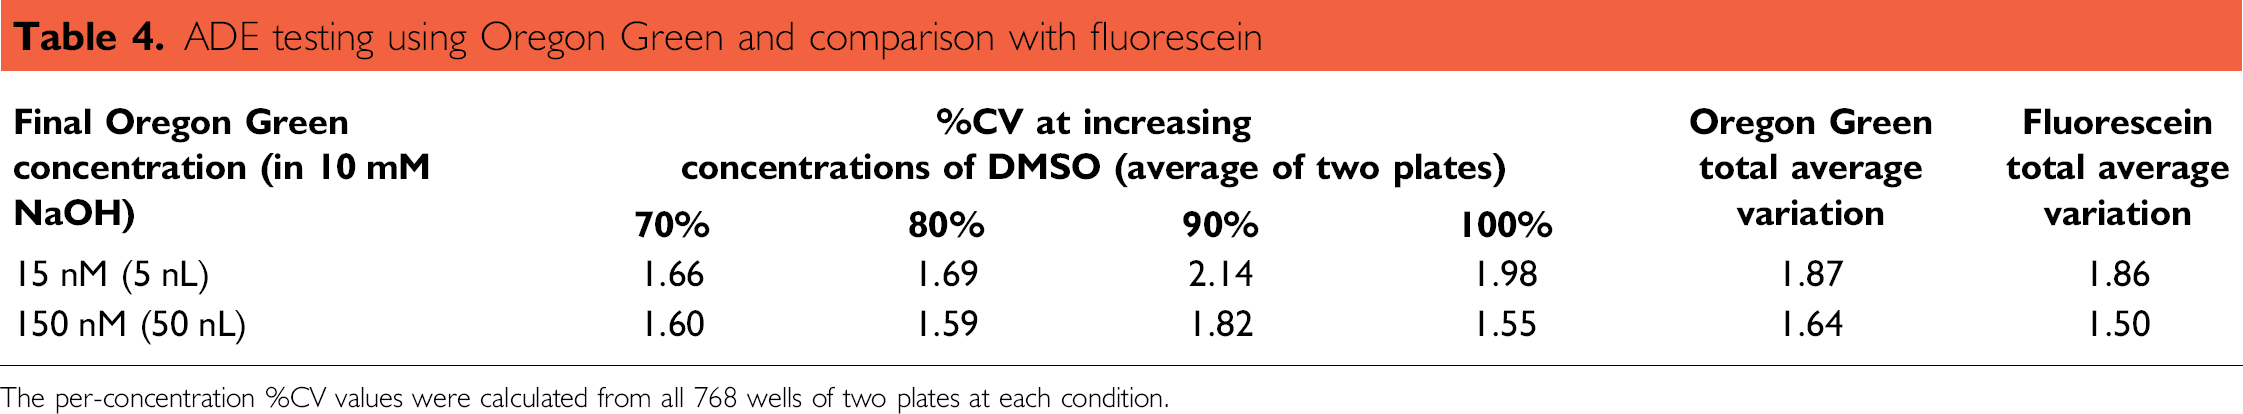
The per-concentration %CV values were calculated from all 768 wells of two plates at each condition.
Conclusions
The known instability of fluorescein as a biological probe does not affect its suitability in unbound form to quantify liquid transfer. By adhering to the following guidelines, one can reliably use fluorescein to determine the accuracy and precision of a nanoliter dispensing system:
Stock solutions of fluorescein in 70–100% DMSO must be stored in the dark and exposure to light minimized.
Measurements in final alkaline dilution must contain less than 1% DMSO.
A stable, solid-phase fluorescence reference plate must be used at the time the standard curve plate is read, and also at the time the experimental plates are read. This is necessary to correct for variability over time in the plate reader, which is ubiquitous but rarely acknowledged.
When stored properly in the dark, a stock solution of 0.15 mM sodium fluorescein in 70% and in 100% DMSO gives a stable signal within ±2% for at least 7 months. Our results also demonstrate the short-term stability of unbound fluorescein for liquid transfer validation tests, because a solution of 15 nM fluorescein did not show evidence of photobleaching when read in different plate readers over the course of more than 100 min. In addition, a solid-phase stable fluorescence reference standard plate can be used to calibrate for reader drift and improve the precision of volume measurements over multiple plates to about 2% CV. Use of the solid-phase standard plate is also, in effect, a calibration of measured volume accuracy. Although accuracy is not emphasized in this paper, we typically achieve consistency in measured volume to within ±2% as predicted by our measurements of fluorescein solution stability.
Precision measurements are enhanced by the isolation of error from individual experimental processes. Isolation of variability due to the acoustic transfer process allowed the qualification of 5- and 50-nL volume transfers down to 1.29% and 1.09% CV, respectively, by subtracting the noise contributed by the plate reader and bulk liquid dispenser.
Cost and lack of benefit from other dyes for our applications is the primary reason Labcyte has chosen to use fluorescein in preference to other dyes for validation of nanoliter dispensing. Labcyte uses over 100 L of 0.15 mM fluorescein in DMSO solutions per year. At $0.10 per gram, this works out to roughly $0.56 per year. Oregon Green 488, to use a contrasting example, costs 40,000 times as much at $4000 per gram. We would spend over $22,000 per year to do the same experiments with this dye. Fluorescein of $1 worth gives us approximately 16,000 experimental source plates. One experimental source plate's worth of Oregon Green 488 costs $2.50.
Footnotes
Acknowledgment
The authors would like to thank Siobhan Pickett for her painstaking reading of this manuscript.