
Abstract
An automated online sampling and measurement system that can be assembled for less than $5000 in components (including spectrophotometer, pump, computer, valves, and relays) is described. The public domain Visual Basic source code that we developed is posted at http://www.ees.ufl.edu/homepp/koopman/hamilton_etal/. This system has proven to be very successful for measuring biomass in long-duration (36 h) experiments. In addition to providing a measurement record, this system could also be part of an automatic process control system.
Introduction
Bacterial growth experiments may last several days, or even weeks. During this time it may be necessary to adjust bioreactor-operating parameters, which requires either the attention of a researcher or an automated control system. We have developed an inexpensive system for continuous absorbance measurements using flow-through spectrophotometers and solenoid valves under the control of a Visual Basic program. This system periodically samples a bioreactor, measures the biomass absorbance, and then rinses the sample line between measurements.
Materials, Methods, and Results
A layout sketch of the experimental apparatus is given in Figure 1. Batch culture experiments were carried out in a stirred bioreactor (Multi-gen model F-2000, New Brunswick Scientific, New Brunswick, NJ). The bioreactor was cycled between aerobic and anoxic conditions to explore diauxic growth of Pseudomonas denitrificans (two periods of exponential growth interspersed with a period of lag). The cycling was accomplished by alternately sparging the culture with air and nitrogen from pressurized cylinders. The switching between these gases was accomplished using two computer-linked solenoid valves, one on each feed line. Gases were sterilized by filtration (0.22-μm Whatman HEPA-Vent filters) and prehumidified by sparging through sterile deionized water before introduction to the bioreactor.
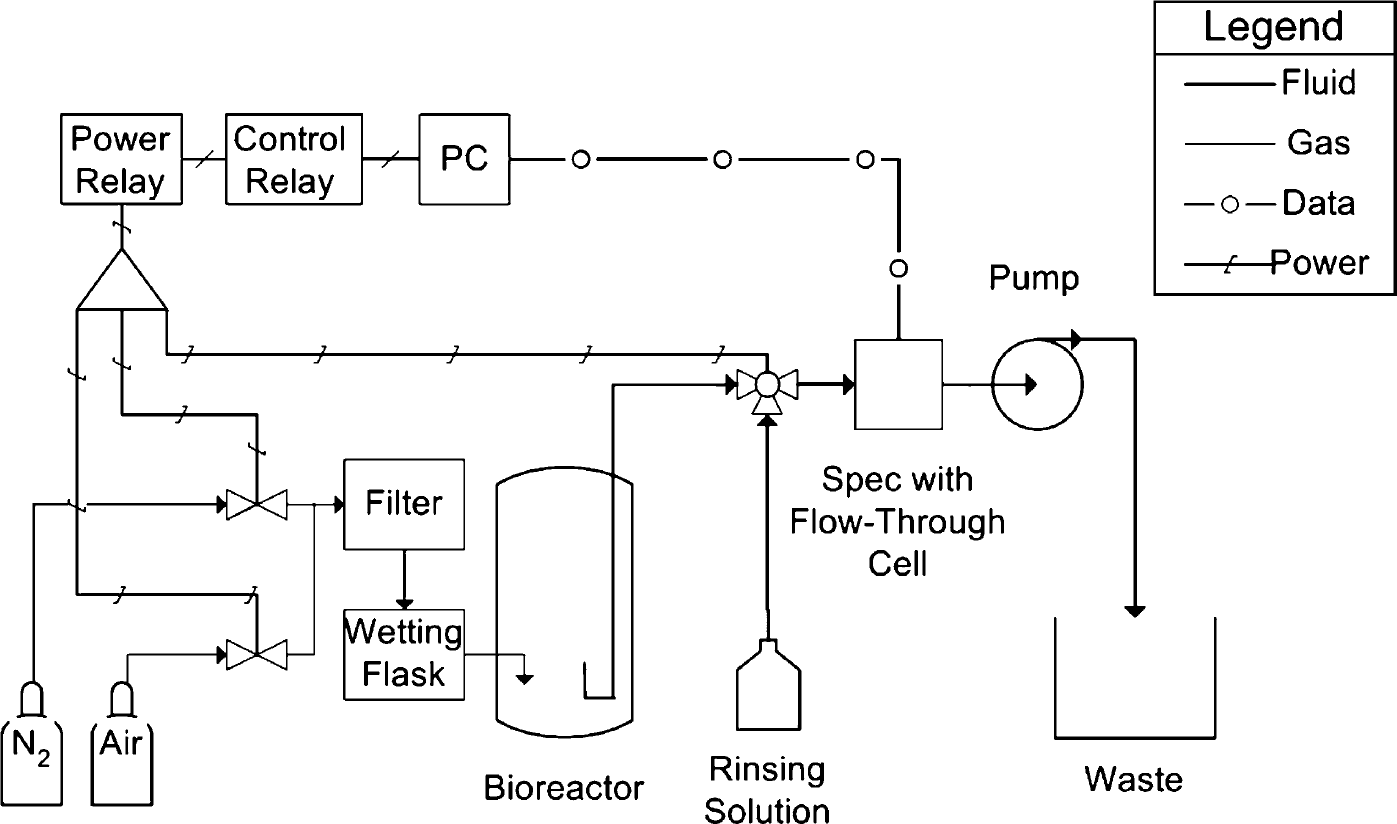
P&ID drawing.
Biomass was sampled from the bottom of the bioreactor through 0.03-in. i.d. Tygon tubing (Master-flex 06409-13). The biomass was passed through a flow-through cell in a spectrophotometer (Thermo-Spectronic Genesys 10UV). This spectrophotometer is relatively inexpensive and supports communication with a personal computer. The tubing end in the bioreactor was bent upwards to prevent gas bubbles from entering the sample line. (Bubbles tended to become trapped in the spectrophotometer flow cell.) The spectrophotometer was inclined at 3° to help bubbles pass through the flow cell. A computer-linked three-way stainless steel solenoid valve (Parker/Skinner 3133BSN1AN00N0M1S1P0) controlled whether sample or a rinsing solution reached the spectrophotometer.
A major problem of the sampling system was accumulation of biomass on the inner walls of the flow cell. This caused the measured absorbance to increase with time, regardless of the true sample absorbance. Higher flows failed to shear biomass from the wall and, in fact, exacerbated the problem. In response to this, a rinsing system was added. In this system, a solenoid valve switches the sampling line feed to a rinsing solution after a measurement is made by a spectrophotometer.
Initially, sodium dodecyl sulfate (SDS) solution was used for rinsing, but it was found that the SDS itself accumulated on the walls of the cuvette, compounding our biomass accumulation problem with “soap scum”. We ultimately found that a solution of 50 mg/L chlorine in water (1:1999 by volume of 10.5% sodium hypochlorite) substantially limited accretion of biofilm within the flow cell without causing any other problems. Figure 2 shows two typical runs, one rinsed with chlorine solution and one without rinsing. Both of these sets of data were taken from the same bioreactor so that, in the absence of biofilm accretion, they should be identical. The rinsed data alternated between measurements of biomass and rinse solution. As seen in the figure, the measurements taken of the rinsing solution remained very near the baseline (zero absorbance) throughout the experiment. If there were accumulation of biofilm inside the instrument, we would have observed an increase in absorbance of the rinse solution. The measurements of biomass absorbance taken in this instrument can therefore be considered to be free of systematic errors caused by accumulation of biofilm. In contrast, the measurements taken without rinsing are substantially higher than those taken with rinsing. This suggests an accumulation of biomass on the walls of the flow cell of the unrinsed spectrophotometer and, in fact, biofilm and particulate matter were observed in previous experiments that used unrinsed sample paths.
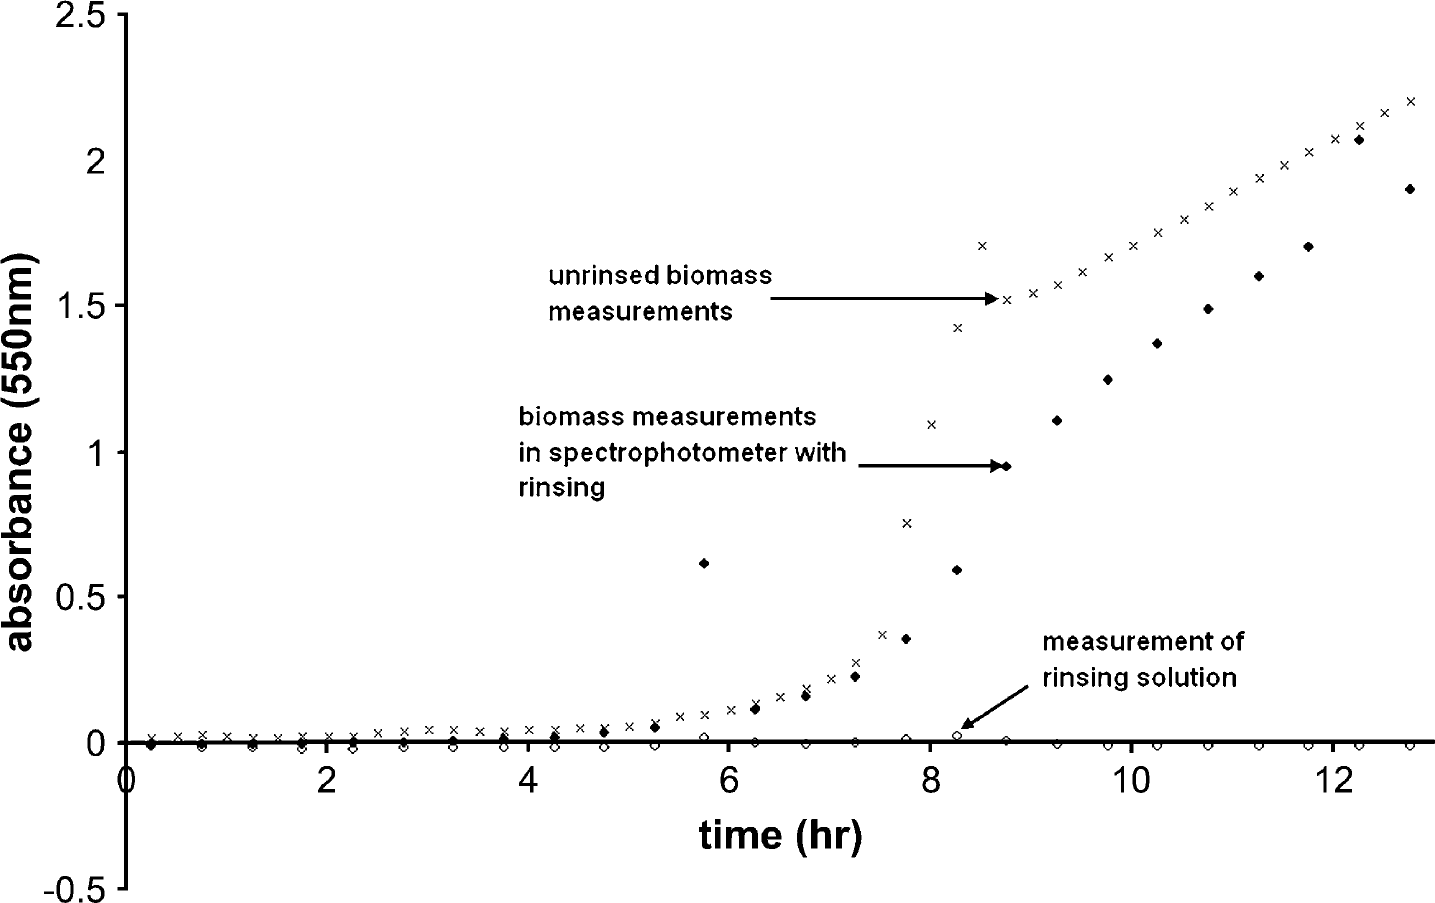
Effect of rinsing sample path on biomass measurements.
When the system is switched from rinsing solution to reactor effluent, it takes approximately 8 min for the measured absorbance to match that of the bioreactor. To be safe, the entire measurement cycle was set to 30 min: 15 min of rinsing, at which point a measurement is taken to check for accumulation in the flow cell, followed by 15 min of reactor biomass and a reading to determine reactor biomass concentration.
There were a few cases in which biofilm accumulation in the flow cell was not completely eliminated. By taking measurements during the rinsing phase we have a way to track the accumulation of biomass on the wall of the quartz flow-through cell. This value can be subtracted from the sample measurement to give the suspended biomass contribution. This system has been shown to work acceptably at absorbances as high as 1.5 at 550 nm (1035 mg dry wt/L), and for our typical operating range of 34-270 mg dry wt/L (absorbance at 550 nm 0.05-0.40) it works very well.
A personal computer running on Microsoft Windows 98 coordinated the valve positions and spectrophotometer measurements using a control program written in Microsoft Visual Basic 6.0. Communication with the spectrophotometer was through a serial port. The program controlled the solenoid valves through a USB-controlled relay (J-Works JSB210-16) that, in turn, operated a power relay (24 V AC). The program also collected and displayed data and enabled the user to set experimental parameters (e.g. duration, sampling period, rinsing period, gas control logic). A flow sheet of the program and its source code are posted at http://www.ees.ufl.edu/homepp/koopman/hamilton_etal/.
The program is communicated with the spectrophotometer using the “mscomm” Visual Basic control, which provides simple access to serial ports. The computer sent a “PRINT” string to the spectrophotometer whenever a measurement was required. The spectrophotometer then returned a string containing the date, time, wavelength, and absorbance.
A challenge in writing the code was the indeterminate delay between the request for a measurement of absorbance and the receipt of the string containing that measurement. This was overcome using the OnComm event of the mscomm Visual Basic control. This event is triggered on receipt of data and then signals the program to process the received data by calling a user-written method (named OnComm) of the mscomm object. This method extracts the absorbance from the received string and stores it in a variable. The program periodically checks whether this variable contains a number (it is reset to null in between measurements).
The USB-controlled relay unit is manipulated using a set of predefined functions provided by the manufacturer. These functions are part of a precompiled dynamic link library (.dll) file. The functions are called to execute hardware level commands that send data across the USB cable to the control relay unit. The control functions are accessed by including a provided module, JWorksRelayModule. bas, in the Visual Basic project. An example of the use of the provided functions is given in the following code fragment, which uses the IsModuleRelayOff function to check whether the relay for nitrogen (valveNitrogen) is closed and, if so, opens the relay using the Module RelayOn function. The vbNullString argument of these functions is null if the computer is communicating with a single control relay unit and is replaced with a string containing a serial number to specify a particular relay unit in the case of multiple units.
If IsModuleRelayOff (vbNullString,_valveNitrogen) Then
Call ModuleRelayOn (vbNullString,_valveNitrogen)
End If
The interface of the program (Fig. 3) gives the status of the gas/sampling system (absorbance, type of gas in use, type of fluid in rinse/sample line, length of rinse phase, length of sample phase, time until next absorbance measurement, elapsed time of experiment) in up to three reactors. It also shows plots of absorbance and aeration status vs time, as well as a log of data being written to a file. Another function of the interface is to allow real-time changes to control parameters. Figure 4 shows a different screen that allows parameters for up to three reactors to be entered.
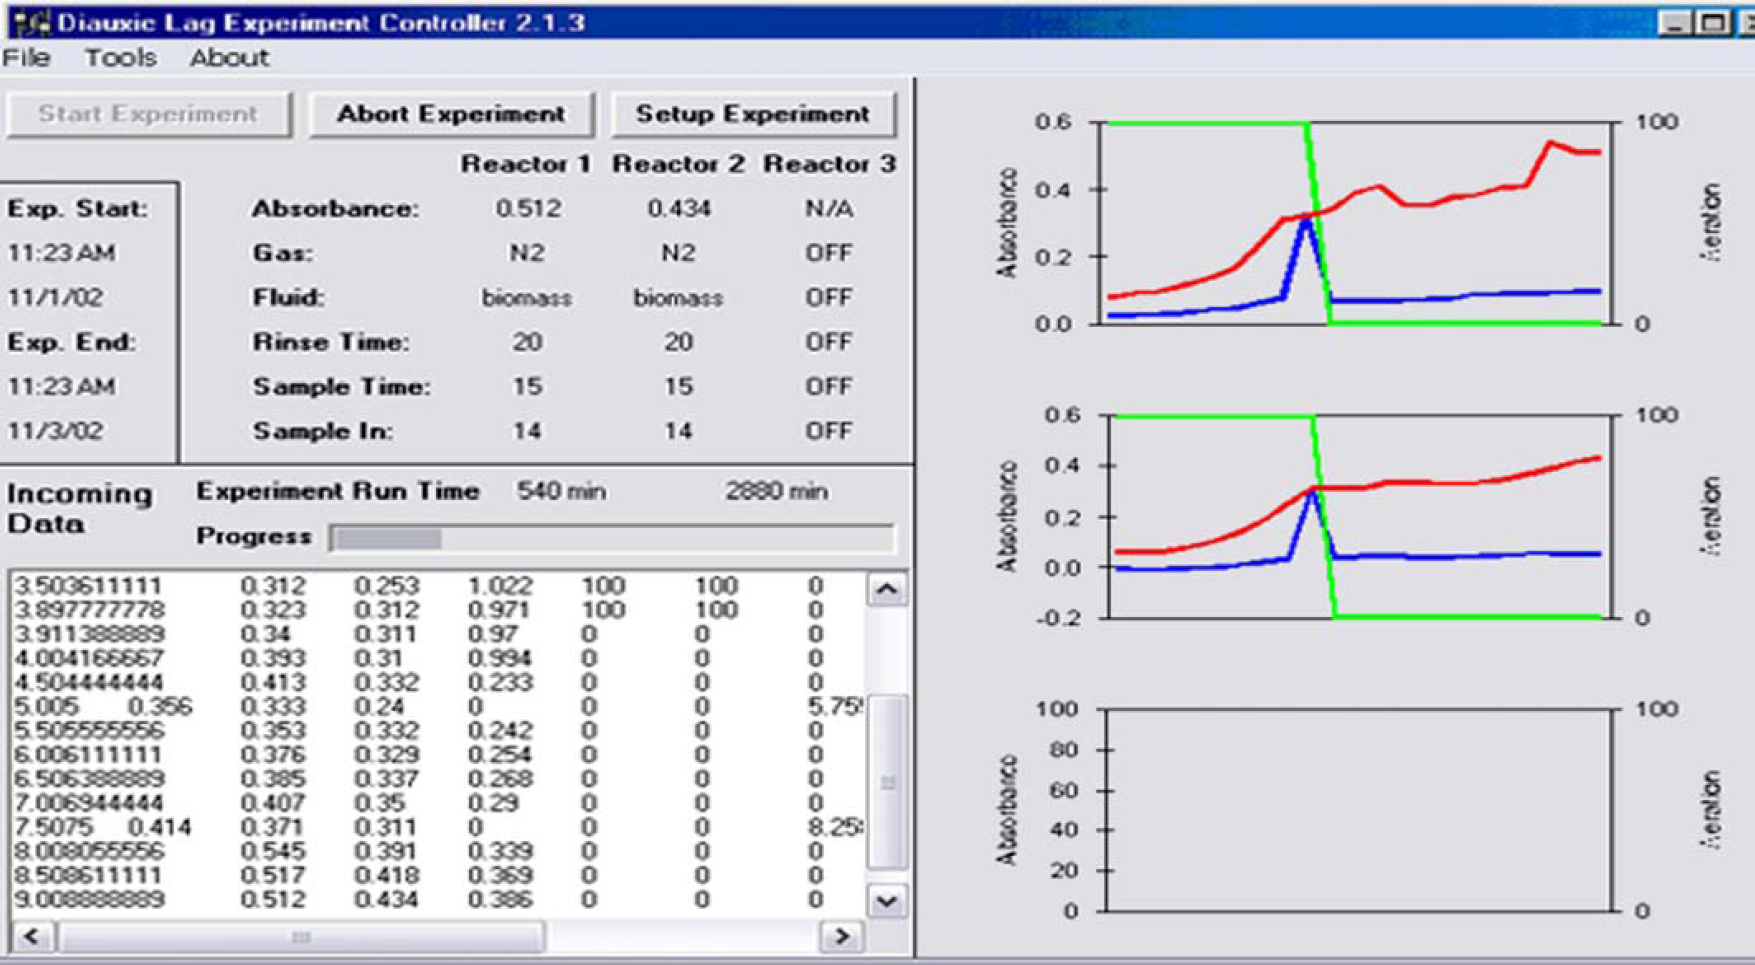
Software interface including current status and measurement history.
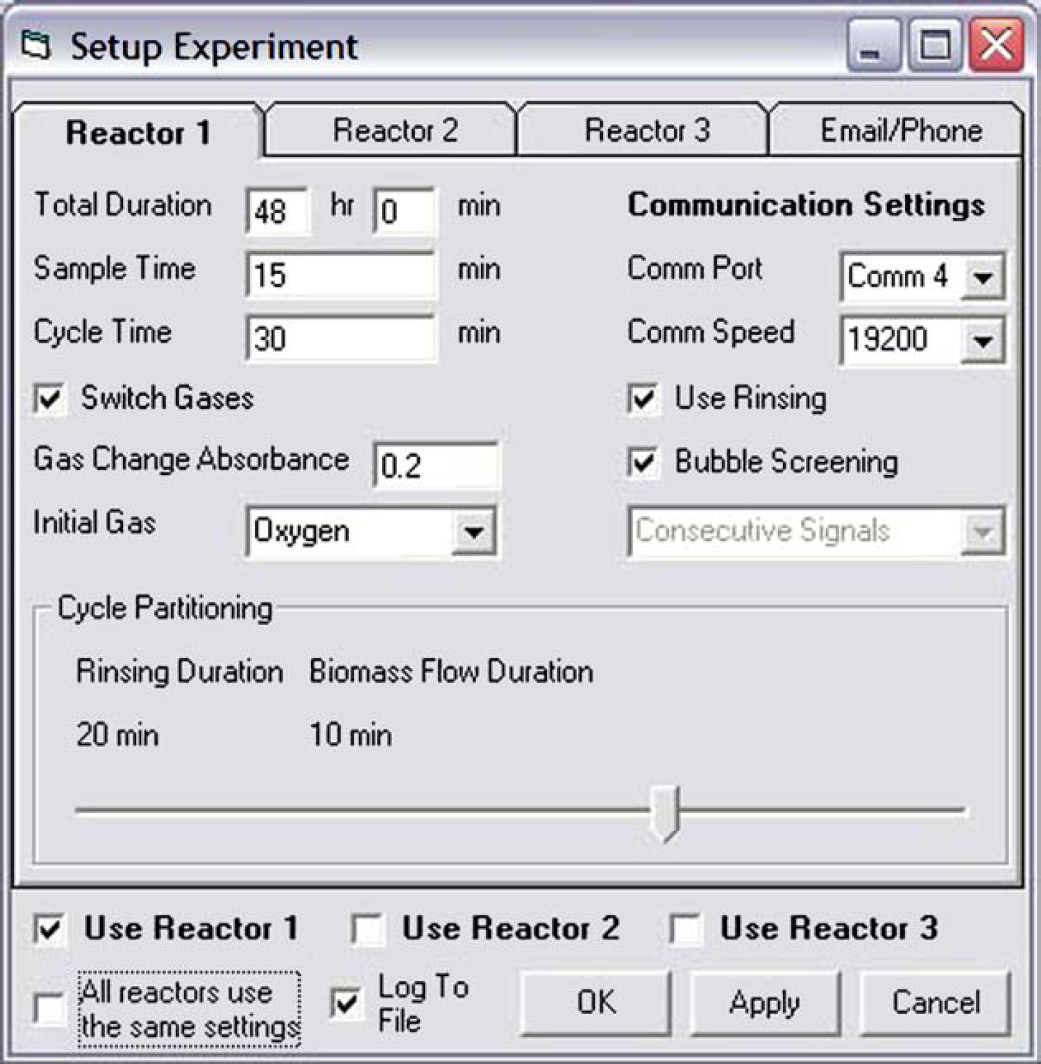
Experiment configuration screen.
A noteworthy feature of the software is its capability to send e-mail automatically. Using the MAPIMessages and MAPISession controls in Visual Basic, a function was written that would send the current spectrophotometer measurement to a list of e-mail addresses. When combined with wireless messaging, this provided a means of alerting remote users by mobile telephone to key changes in system status.
Another useful resource is the freely available software WinVNC (http://www.uk.research.att.com/vnc/) that allows the user to remotely monitor and administer the lab computer. This was very useful during experiments that required manual intervention after a long and variable bacterial growth phase.
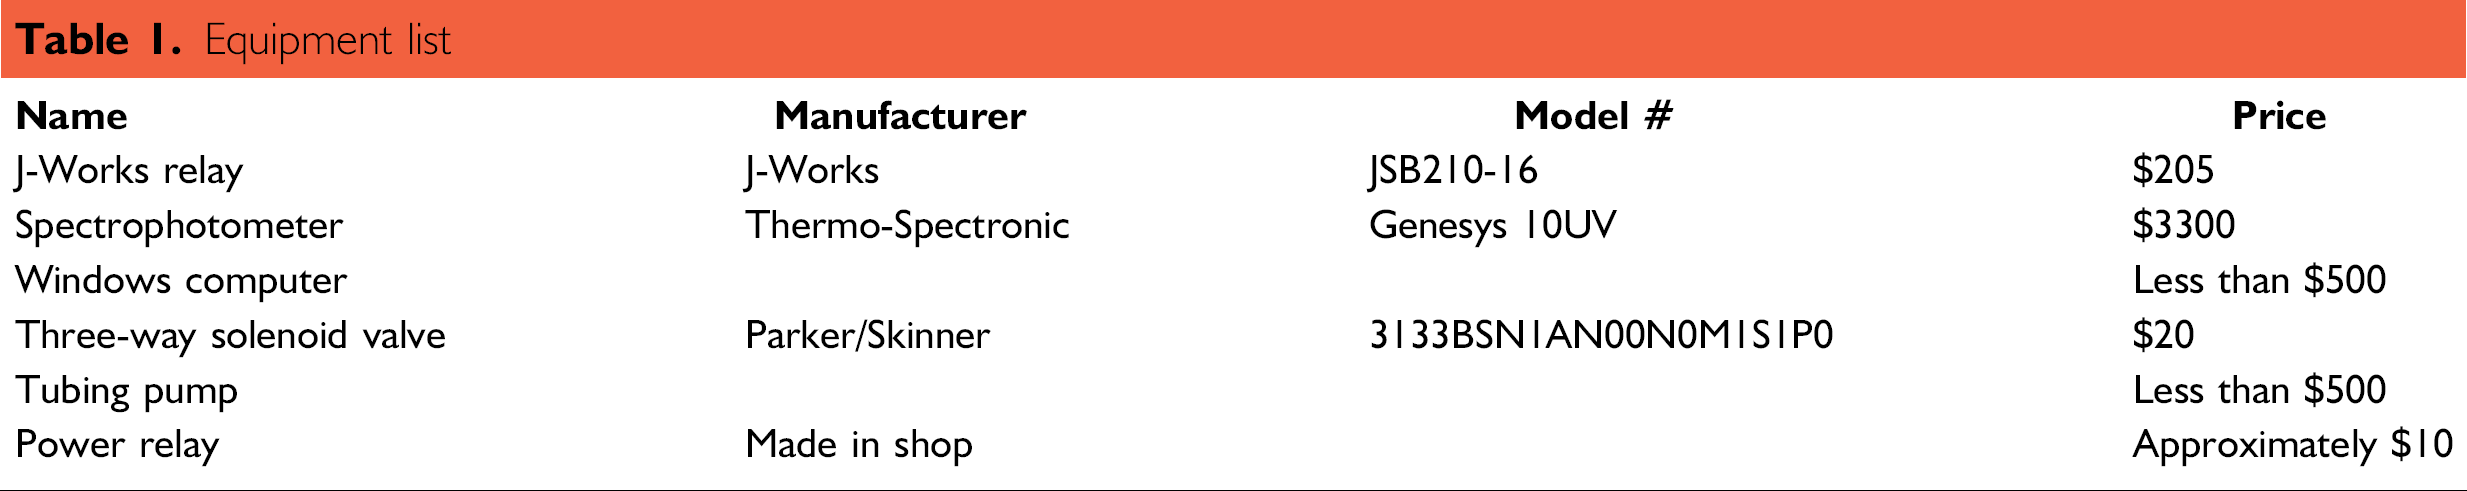
The components of the gas and rinsing control system are listed in Table 1, along with their prices. The total system cost for parts was approximately $4500. The system is easily scaled to multiple bioreactors. For example, we are currently using it with three bioreactors and three spectrophotometers. This required the addition of a USB device (Keyspan USB 4-Port Serial Adapter) for additional serial ports.
Equipment list
Conclusions
The automated, online sampling and measurement system has proven to be very successful in our experimental work. We currently observe only one to two bad measurements in a 14-h experiment (28 biomass measurements). Thus, using information provided in this article, it is possible to assemble an effective continuous sampling and measurement system that functions over extended time periods and requires only a modest investment. In addition to providing a measurement record, this system could also be part of an automatic process control system.