
Abstract
There is a growing need to precisely quantify the selectivity of large compound sets in high throughput screening, directing investment in lead optimization towards compounds with a high chance of success. High-content, high-density screening technologies such as multiparametric ultra-HTS provide a basis for highly precise screening with unprecedented scope for delineating process artifacts from reliable signals. However, the full potential of these technologies can only be realized with suitable experimental design and sophisticated data analysis tools.
We present two advanced analysis workflows demonstrating how multiparametric readouts from a high throughput primary screen can improve decision quality in the hit identification process. The first involves discrete thresholding and the application of multiple selection criteria. The second uses machine learning algorithms and allows an unbiased consideration of all measured parameters.
Introduction
Recent advances in confocal technology provide the opportunity to detect several different readouts of single molecules simultaneously in an industrial, robotic ultrahigh throughput context (Fig. 1). 1 –3 Multiple readout parameters such as particle number (concentration), molecular brightness (total fluorescence), or fit error (χ 2 ) are recorded simultaneously and can be used to enhance quality assessment.
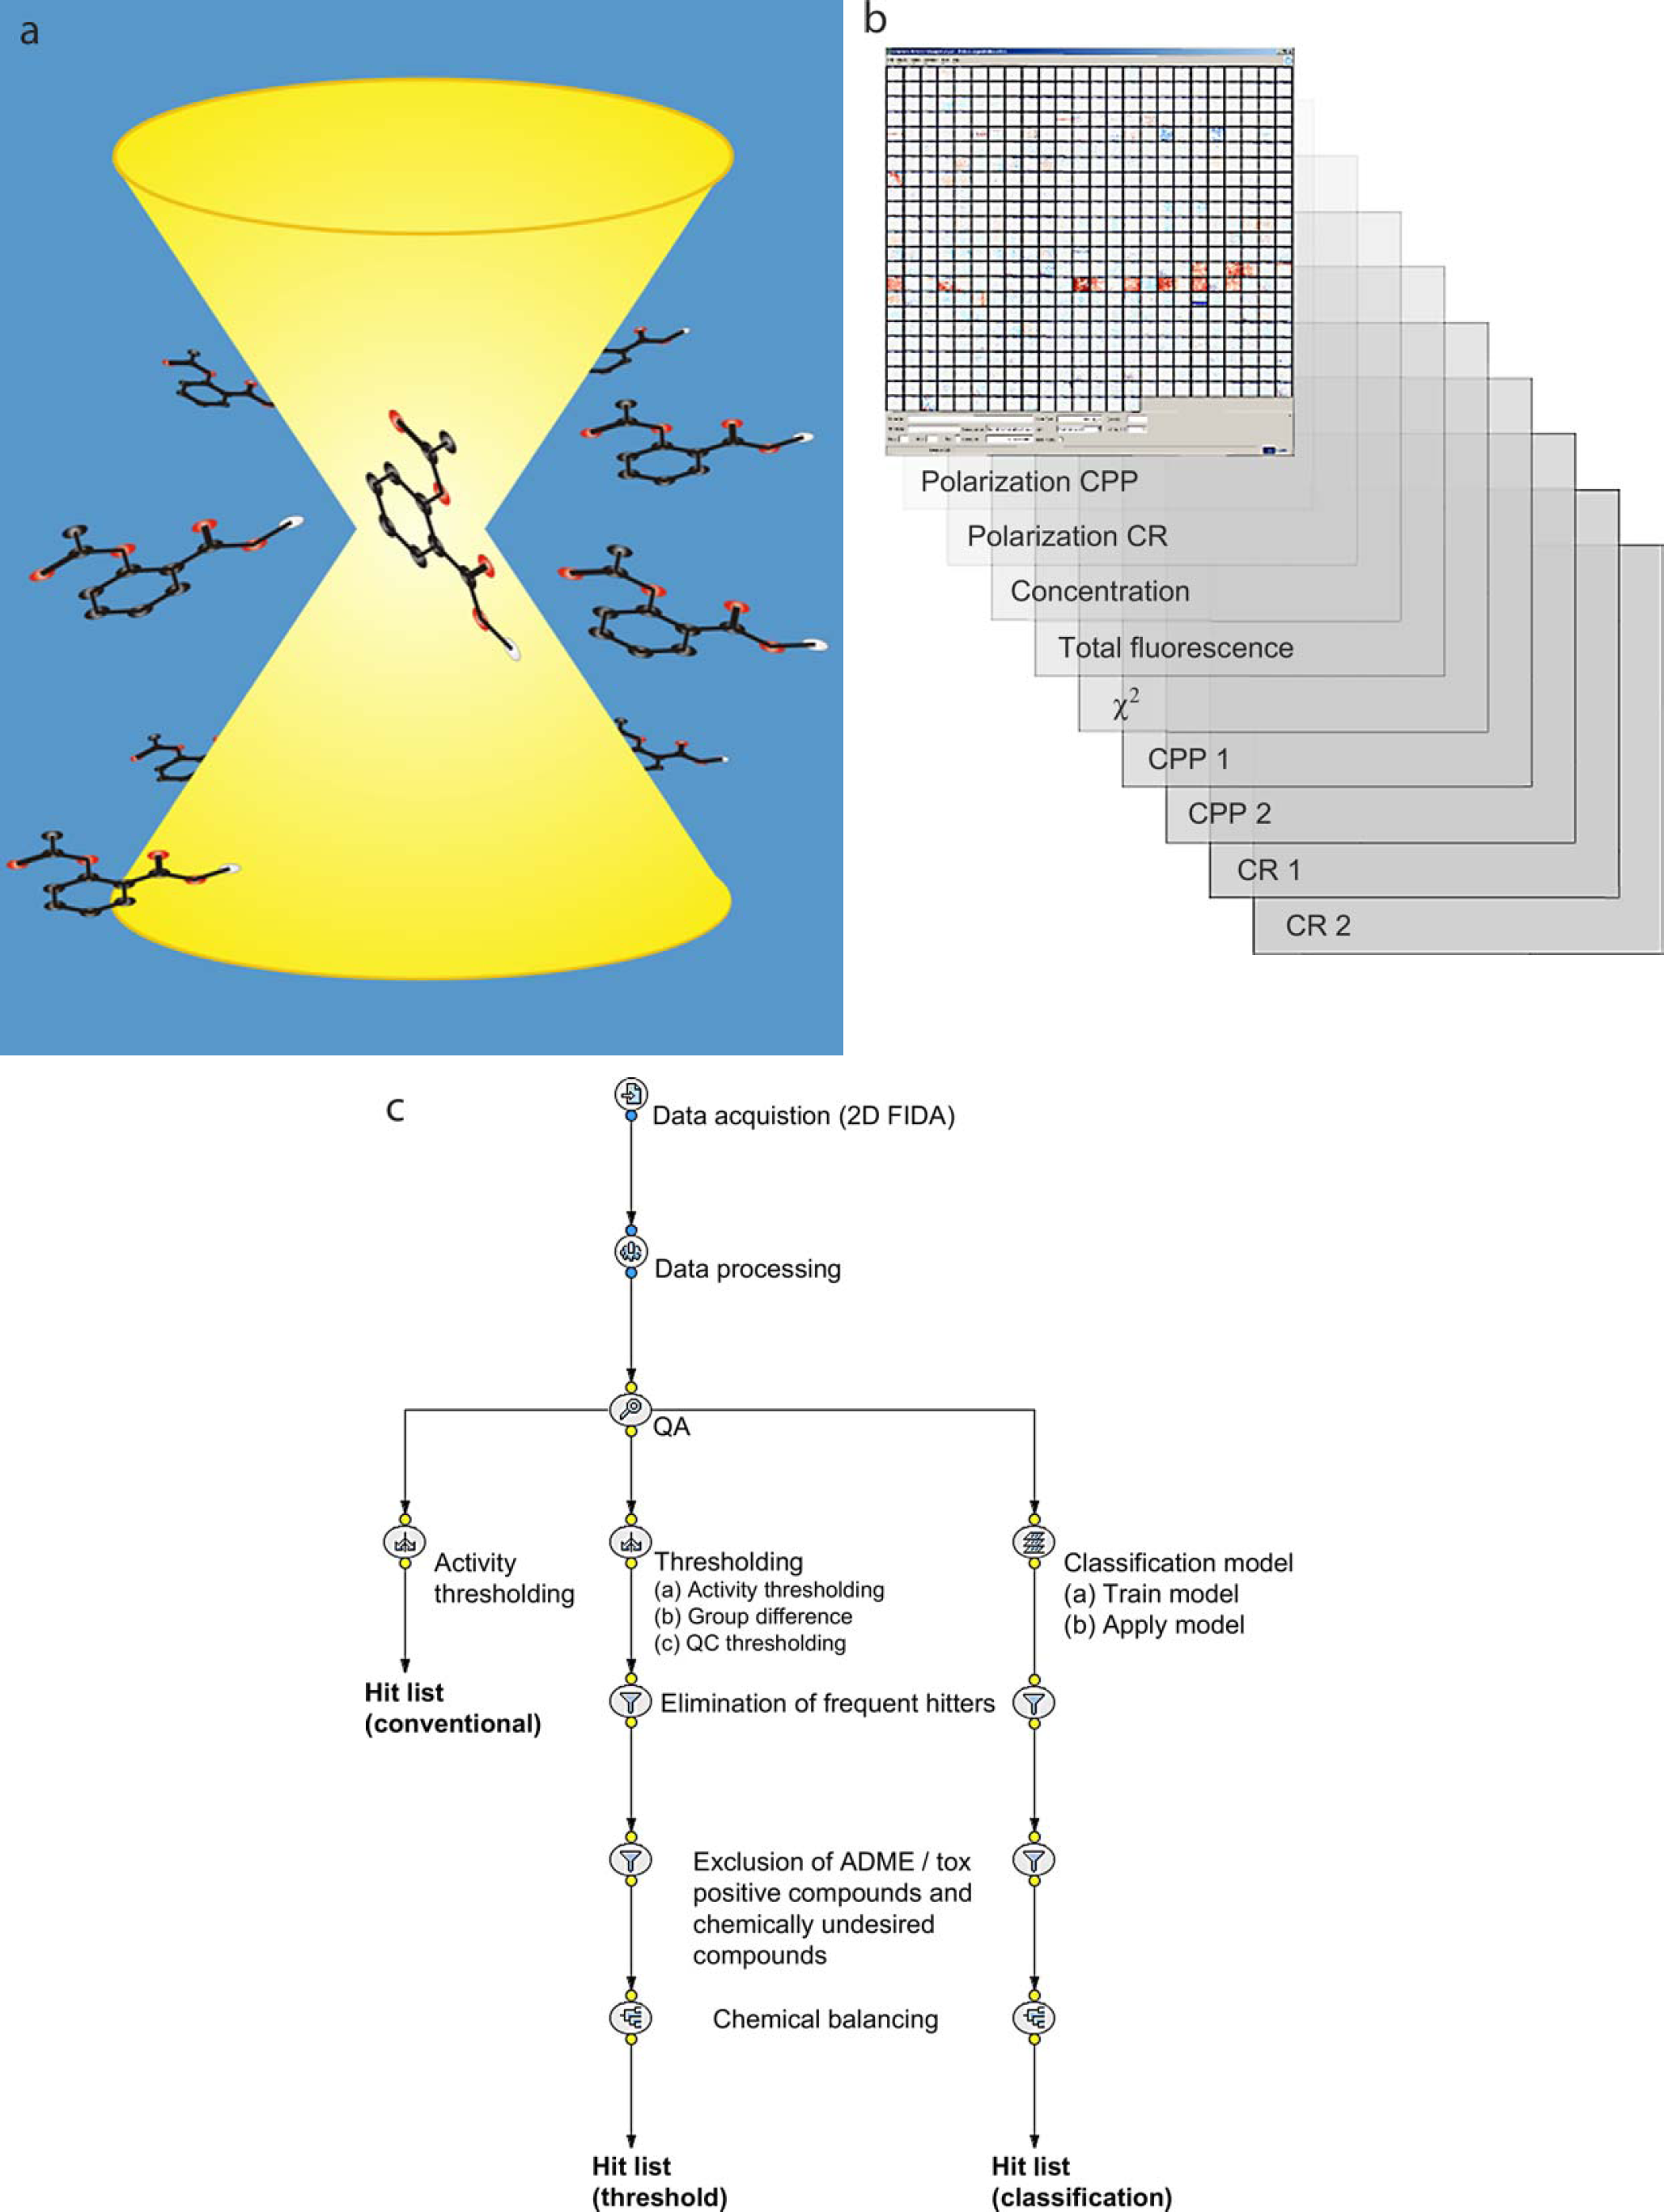
Overview of screening methods and hit selection procedures: (a) a biochemical assay of protein-ligand interaction was developed for use with 2D FIDA technology (see Methods); (b) each well yields a total of nine parameters; and (c) alternative workflows for hit list generation. All workflows are applied in an automated fashion, scaling to the large number of screened compounds and ensuring standardization.
These advances open the way for substantial improvement in the quality and reliability of compound hit lists produced from primary screens. Conventionally, hit lists are generated by thresholding primary data on the basis of compound activity values. Further refinement of the hit list can be achieved by thresholding on quality criteria, a procedure that benefits from the additional parameters produced by high-content screening. Finally, compounds can be excluded on the basis of toxicological, absorption distribution metabolism excretion (ADME), and other information, and the final hit list can be balanced to cover a relevant chemical structure space.
High-content data can be exploited further by deploying machine learning classification algorithms to classify compounds according to hit quality. These methods offer an alternative to hit selection based on fixed thresholds. Classification can be performed using all parameters, offering an unbiased consideration of all available screening information. This prioritizes the entire compound library, and this information can be used to guide further hit list refinement.
We describe a compound hit list generated using activity and quality thresholds, as well as explicit selection criteria. In addition, we assess hits obtained using the classification approach. The Evoscreen MarkIII 4 system (Evotec OAI/Evotec Technologies, Hamburg, Germany) was used to obtain high-content data based on two-dimensional fluorescence intensity distribution analysis (2D FIDA). Our results highlight the precision of the 2D FIDA technology and the importance of scalability and standardization in the quality evaluation and analysis of high-content, high-throughput data. 5
Methods
Primary screening data from a protein-ligand assay was obtained for a library comprising 943,000 compounds. Six hundred and fifty microtiter plates (2080 wells/plate) were screened, yielding nine different parameter values per well (Fig. 1), and a total of 12,168,000 data points. Screening was performed using 2D FIDA. The technique monitors the different polarization of the fluorescence signals. Based on these measurements, the reader calculates four count rates, two activity parameters (polarization counts per particle [CPP] and polarization count rate [CR]), and the quality parameters total fluorescence, concentration, and χ 2 .
Data processing and quality assurance were performed using the Screener AssayAnalyzer software product (Gene-data AG, Basel, Switzerland). The software features a suite of statistical algorithms designed to detect process artifacts and other data quality issues, automatically distinguishing between correctable and nonrecoverable artifacts. Correction is achieved by adjusting for systematic biases. Wells affected by artifacts deemed nonrecoverable are masked from downstream analysis. 6
Examples of this processing are shown in Figure 2. The right panel shows six plates after automatic processing. Nonrecoverable artifacts are shown in gray. Proprietary algorithms have been applied to the signals to compensate for biases that occur systematically across plates. The middle panel shows the correction factors that have been applied to the signals.
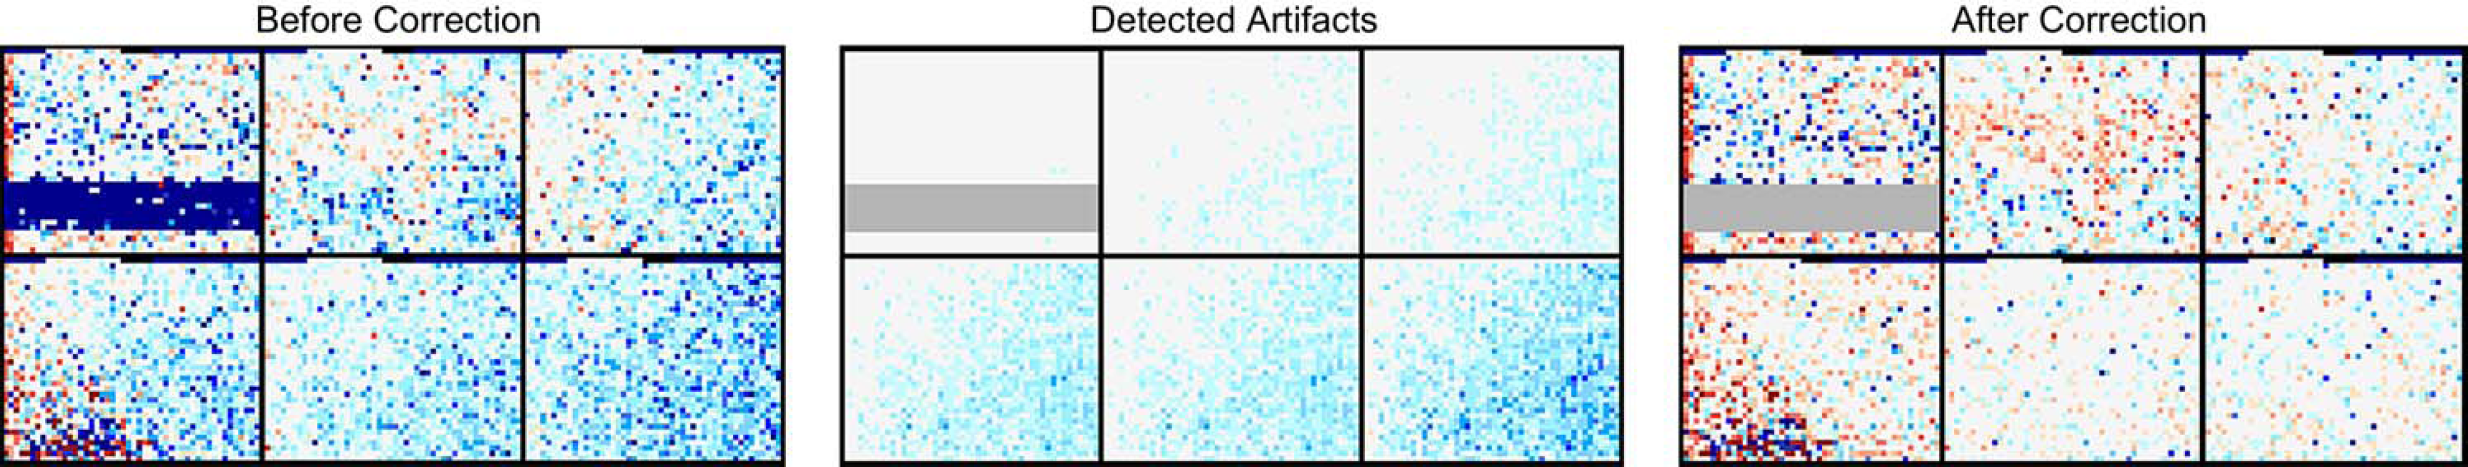
Correction and masking of individual wells. Color-coded activity profiles of six plates, each containing 2080 wells, shown before (left) and after (right) correction and masking. Dark blue denotes inhibition; red, stimulation. Left (before correction) shows normalized signal values; middle (detected artifacts) shows correction factors applied to plates; and right (after correction) shows processed signals featuring correction and masking (gray wells).
The stripe pattern evident in the lower half of the first plate is probably due to a blocked pipette and has been masked. An edge effect is also apparent, recurring across several adjacent plates. This may be caused by uneven heating or evaporation gradients. Because of the systematic nature of this bias, corrections can be applied to the affected wells. Automated processing applied across the entire assay ensures consistency in the quality assurance process.
Hit List Selection Procedures
Two hit lists were produced, the first using thresholds and explicit selection criteria and the second using the classification procedure. The threshold and selection procedure is performed as follows: First, an activity threshold of 50% inhibition (6.2 robust standard deviation [SD]) is applied to select for active compounds. A total of n = 4120 compounds passed this threshold. Compounds with large differences between the polarization CPP and polarization CR activity estimates are also removed (n = 2894 compounds passed this step; see Fig. 3). Next, quality parameters are considered. Measurements with QC parameters deviating more than ± 3 robust SD from their nominal value are considered artifacts and eliminated (n = 2164 compounds passed this step). Note that applying multiple thresholds, as described here, can have interesting consequences on the false positive rate. As the number of threshold steps increases, so too does the confidence that results contain fewer false positives. Each compound has a unique profile across all parameters and must simultaneously pass all thresholds (tests) to be included in the final hit list. Assuming that n tests are independent, the global alpha level is given by multiplying the individual alpha levels. Hence, we believe that the false positive will decrease with the number of filters applied.
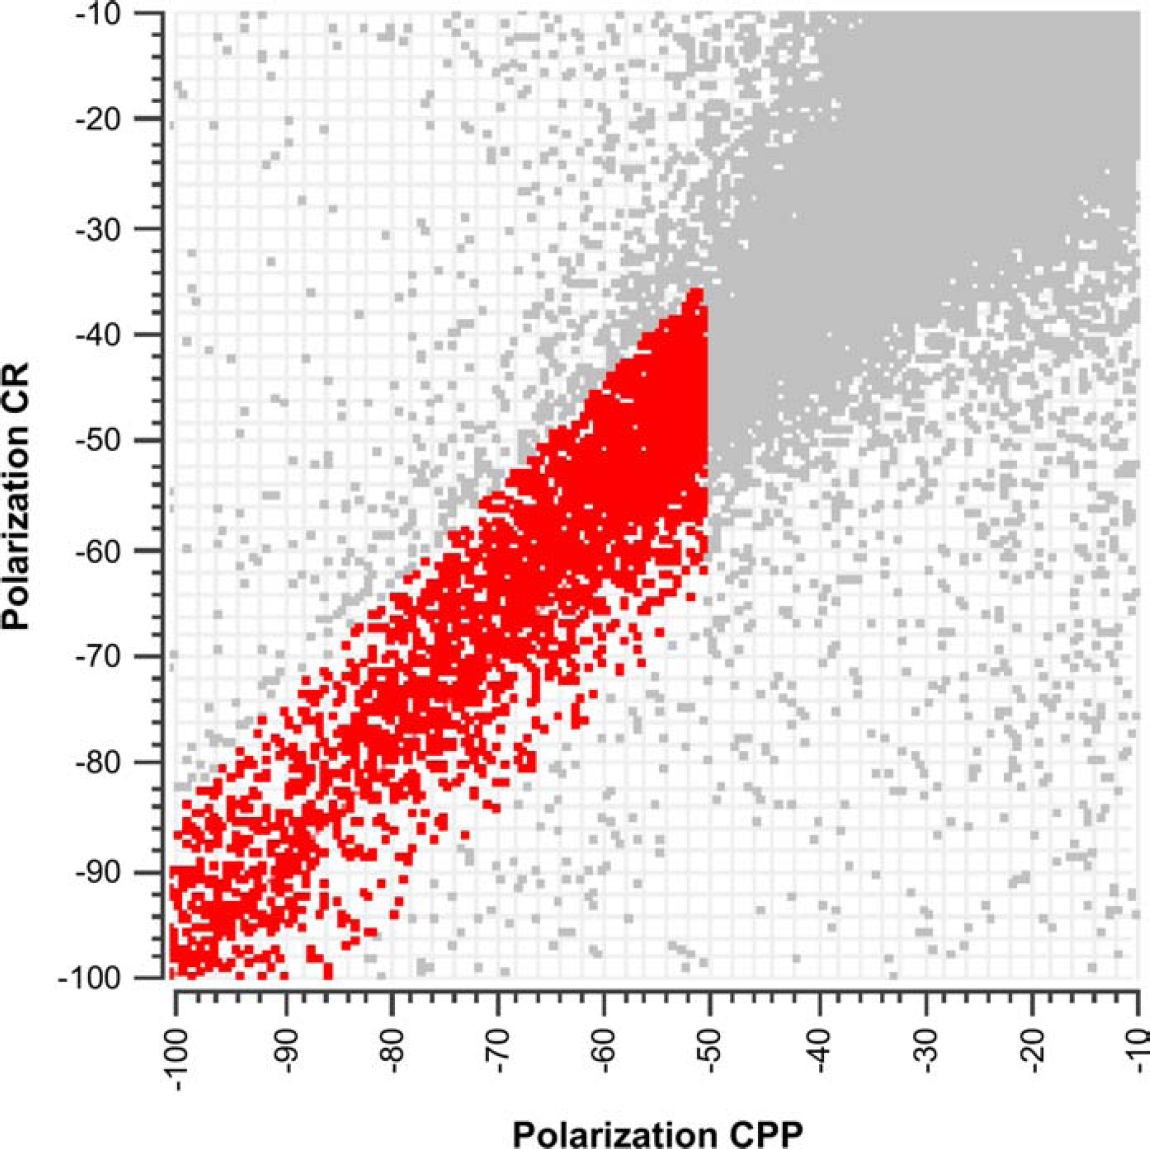
Data thresholded on activity and explicit selection criteria. The complete compound library is plotted in gray. Compounds plotted in red have polarization CPP values less than −50% inhibition and 15% difference between the two activity estimates, polarization CPP, and polarization CR.
Further refinement of the hit list is achieved by excluding undesired compounds. Each assay measures a distinct property, such as nonselectivity (frequent hitters), potentially toxic side effects, undesirable ADME properties, and of course, inhibition on the target assay. These criteria are applied simultaneously by correlating compound activity across a set of different assays (Fig. 4). Following this step, the hit list comprised 1923 compounds.
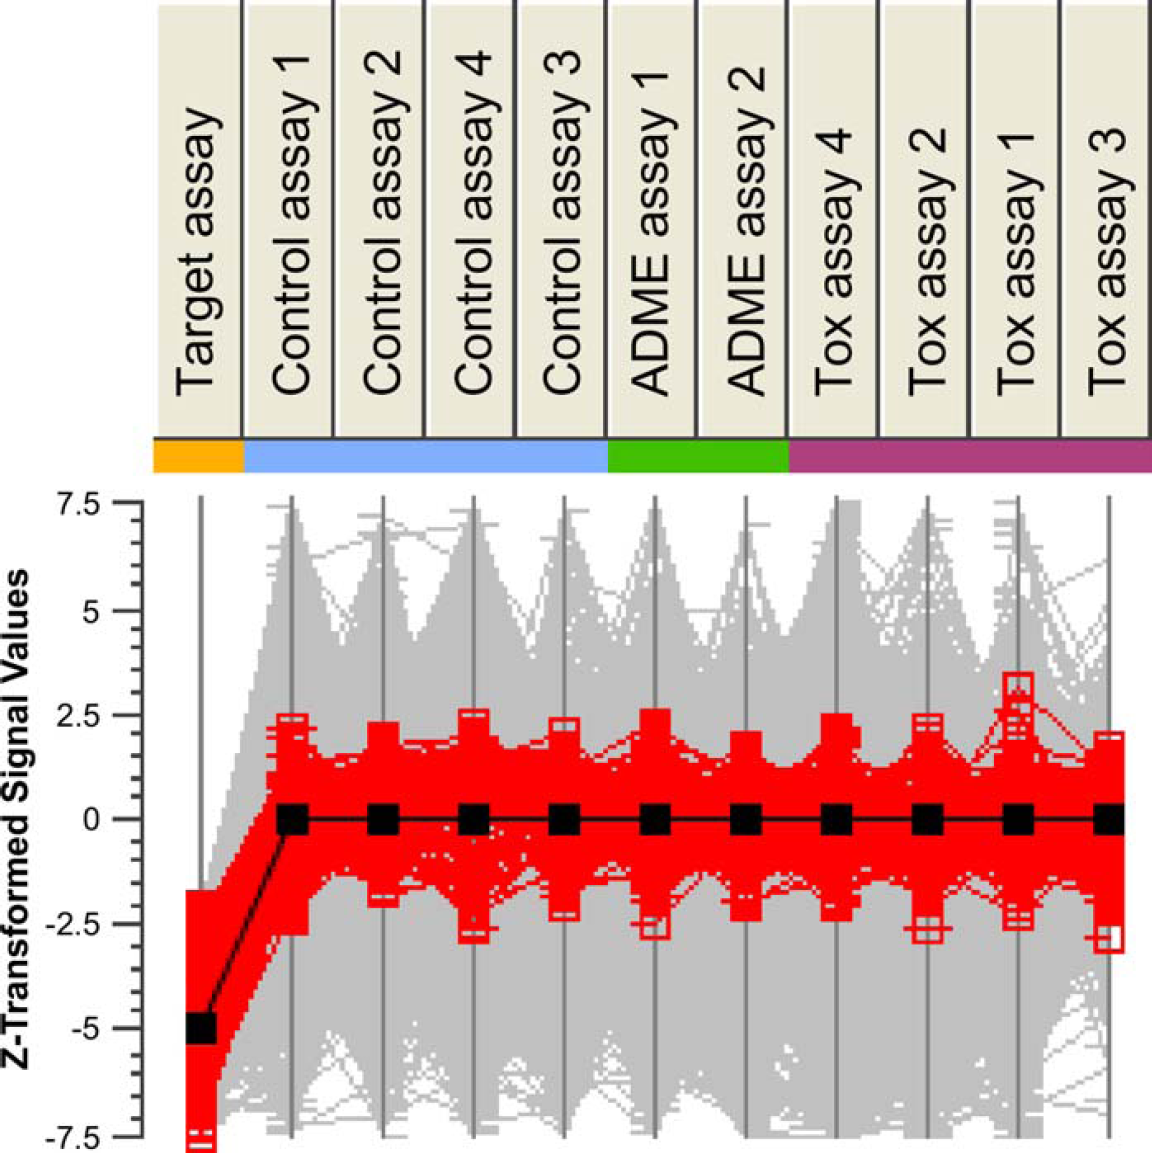
Selection of hits based on a comparison across multiple assays. Profiles of z-transformed activity estimates (polarization CPP) across the target assay, control assays, and further assays designed to explore potential ADME and toxicological issues (see Methods). Black line indicates the profile of activity responses across the assays that would represent a combination of strong inhibition in the target assay and minimal interaction on counter screens. Compound profiles similar to the black profile are highlighted in red.
Because activity values in each individual assay reside on different scales, the values are first z-transformed. Compounds are then ranked according to their distance from an ideal profile (solid black line). The ideal profile is one of high inhibition in the target assay and zero activity in counter screen assays. The procedure is performed interactively, with the ability to alter the desired profile value on an individual assay and to adjust the overall distance threshold. Once a suitable threshold is found, compounds that do not achieve the threshold are excluded from the hit list. Following this procedure, further compounds are removed from the list in order to balance the list across chemical structure classes. 7
The final hit list is then compared with the results of a validation assay. This assay features dose-response measurements, and therefore provides a more robust estimate of target activity than can be obtained from the single compound concentration tested in the primary screen. On the basis of these results, compounds are defined as either verified hits (identified as a hit in the primary screen as well as in the validation screen) or false positives (identified as a hit in the primary screen but not confirmed in the validation screen). This makes it possible to estimate the hit verification rate of the procedure.
The classification procedure was used to generate an alternative hit list. All nine readout parameters are included in the analysis. The procedure is used to create a predictive model yielding an estimate of the likelihood that a compound belongs to the class-verified hits or false positives. Compounds are then classified according to their so-called affinity to the class of verified hits.
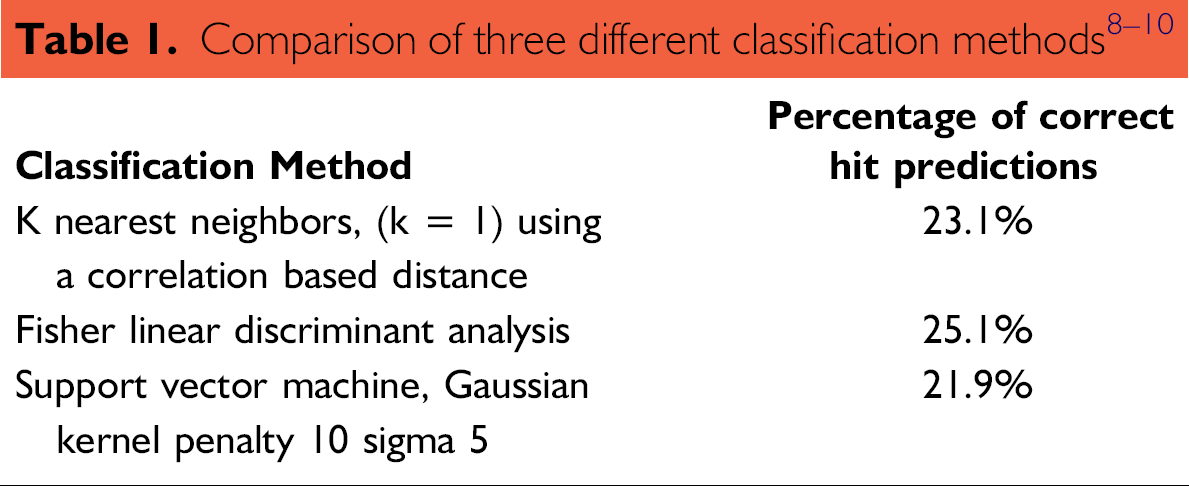
An in silico method was used to cross validate the predictions of the classification model. The cross-validation algorithm randomly and repeatedly (100 times) divides compounds from the validation screen into a training set (80%) and a test set (20%). The algorithm uses the training set to create a classification rule that will subsequently be applied to the test set. The test set is then used to determine the percentage of correct predictions to the class-verified hits. Classification results were obtained using three alternative classification algorithms: K Nearest neighbors, Fisher linear discriminant analysis, and support vector machine.
Compounds were then excluded on the basis of toxicological, ADME, and other information. The final hit list is also balanced across chemical structure classes. Both hit lists were executed in an automated fashion using the screening data analysis platform Screener Sarileo (Genedata AG). All selection criteria are recorded for the purpose of auditing and repeating the analysis for subsequent screening data.
Results
The final hit list comprised 1923 compounds selected from the original primary screen. Of these, 414 were confirmed in the dose-response validation screen. A hit is called a verified hit if an IC50 value in the μM range or better has been determined in the validation screen. Properties of the compounds identified by each hit list creation procedure are described below.
Threshold Procedure
Hits identified by the threshold and selection procedure are compared with the results of the validation screen. The hit verification rate was calculated as the proportion of hit list entries subsequently confirmed as hits in the validation screen. A value of 21.5% is obtained. Note that a consequence of removing frequent hitters is that the number of hits in both the hit list and the validation screen will decrease. This has a detrimental effect on the overall verification rate. However, it does not make sense to include these compounds in the hit list or in subsequent validation screens. This should be taken into account when interpreting the verification rate.
Figure 5 compares the distribution of total fluorescence values of false positives with hits verified in the validation screen. Compounds belonging to the hit list are highlighted in either blue or orange. Blue corresponds to hit list items that have been verified as a true hit in the validation screen. Orange corresponds to false positives.
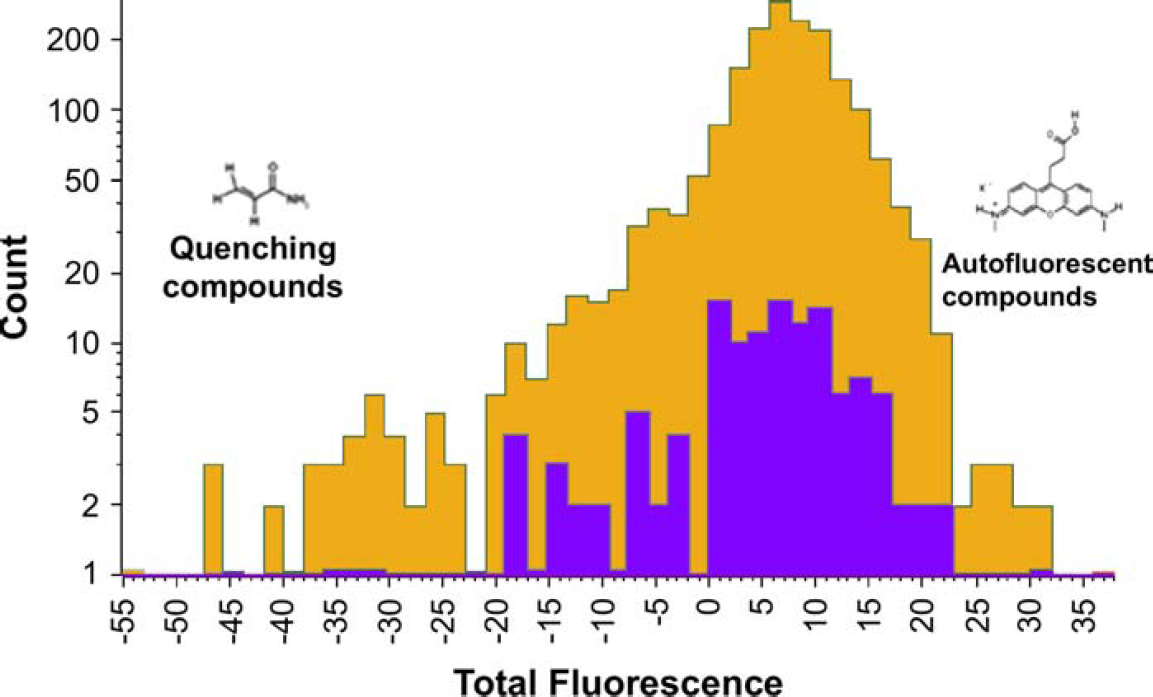
Comparison between verified hits (blue) and compounds identified as false positives (orange) in a subsequent validation screen. Verified hits are tightly confined within the middle range of fluorescence values.
Verified hits lie within a confined range of fluorescence values. By contrast, compounds subsequently identified as false positives occupy a broader range. Beyond the lower extreme of this range, we find significant overlap with known quenching compounds. Beyond the upper extreme, auto-fluorescent compounds are found frequently. The tight confinement of verified hits within this range validates the use of thresholding on the total fluorescence value. Indeed, the results suggest that more stringent thresholding could be applied in subsequent campaigns.
Classification Based Procedure
Three algorithms were used to evaluate the quality of hits identified by the classification procedure. The cross validation method yields an estimate of the hit verification rate corresponding to each algorithm (Table 1). The Fisher linear discriminant analysis (LDA) produced the highest verification rate. Training the LDA on all compounds from the validation screen and applying it on the primary screen data reveals that many compounds classified as hits lie below the −50% inhibition threshold. Note that these are excluded by the thresholding procedure.
Conclusion
We describe an automated quality assessment of multi-parametric ultra-HTS data and the application of two advanced hit selection procedures. Hit lists were derived from the results of each procedure by excluding frequent hitters and further compounds on the basis of toxicological and ADME information, and by balancing the list to cover a relevant chemical structure space. Both procedures scale readily to large data sets and feature a high degree of automation and standardization.
The threshold method features multiple selection criteria, including conventional activity thresholding. This list was evaluated by comparing it to a list of compounds subsequently verified as true hits in a validation assay. A hit verification rate of 21.5% was obtained. The results demonstrate the predictive power of multiparametric readouts to distinguish between true biological activity and nonbiological compound interferences.
The classification method uses the results of a verification assay to distinguish between verified hits and false positives. Each compound is assigned an estimate for the likelihood that it will be verified as a true hit. An advantage of this procedure is that all measured parameters are considered simultaneously and without bias. Using in silico methods to estimate the hit verification rate, a value of 25.1% was obtained using LDA.
Both methods are suitable for sequential campaigns and may also be combined. For sequential campaigns, ongoing results can be used to determine optimal activity and quality thresholds, or as training sets for the development of successively more accurate classification models. Future studies will explore the general applicability of thresholds and classifiers deduced in this screening campaign to subsequent campaigns.
Acknowledgment
We would like to thank Peter Haberl for helpful discussions on Bonferroni correction.