
Abstract
Successful high-throughput screening requires methods for determining the precision of liquid dispensing. We compared absorbance and fluorescence methods. We found that plate-to-plate variability was large enough to mask the difference in optical methods. When a dual-dye method was used, we found that absorbance and fluorescence gave similar results in 96- and 384-well plates. In 1536-well plates, the two methods gave differing results, but centrifugation reduced the difference, suggesting that entrapped air bubbles or unsettled meniscus shapes artificially raised the coefficients of variation of fluorescence reads.
Introduction
High-precision liquid dispensing in high-throughput screening (HTS) leads to better data quality. Consequently, test methods are needed to verify that liquid dispensers are performing as required, and there is an ongoing effort to develop and improve the test methods. 1 –3
To be useful, dispenser test methods should have a number of attributes, including ease of use, low cost, safe, fast, repeatable, and robust. They should also be of high precision. This last attribute is important in that the imprecision indicated by a test method is usually that of the total system; it includes imprecision not only from the dispenser but also from dispense artifacts such as bubbles and meniscus effects, from contaminants that interfere with the method, from the microplate, and from the detection system. In order to measure the dispenser imprecision, the contributions to imprecision from these other sources should be much less than that of the dispenser. In practice, it can be difficult to determine which sources are the most significant contributors.
Test methods that utilize optical measurements of dispensing, in particular absorbance and fluorescence methods, are routinely used in HTS to verify dispenser precision. These methods do have the aforementioned attributes and usually work well in 96- and 384-well microplates. However, in 1536-well microplates with their smaller wells, these methods are more susceptible to artifacts that can degrade the fidelity of the test method.
In this paper, we directly compare absorbance and fluorescence methods in 96-, 384-, and 1536-well plate formats to determine the relative advantages and disadvantages of each.
Materials and Methods
Tartrazine (Sigma-Aldrich, St. Louis, MO) at a concentration of 400 mg/L in 10 mM phosphate-buffered saline (PBS, Sigma-Aldrich) was used for all absorbance tests, and fluorescein (Sigma-Aldrich) at a concentration of 100 nM in PBS was used for all fluorescence tests unless otherwise indicated. In dual-dye tests, a solution of tartrazine (400 mg/L) and fluorescein (100 nM) in PBS was used.
Black-wall, clear-bottom plates in 96-, 384- and 1536-well formats (Greiner Bio-One, Frickenhausen, Germany) were used for absorbance tests and dual-dye tests. Black-wall plates with either black or clear bottoms were used for fluorescence tests.
Unless otherwise specified, dispense volumes of 100, 25 and 3 uL were used for 96-, 384- and 1536-well plates, respectively. In 96- and 384-well plates, the plates were dispensed with handheld pipettors. In 1536-well plates, an AquaMax DW4 liquid handling system (Molecular Devices Corporation, Sunnyvale, CA) was used.
All plates were read in an Analyst GT Multimode Detection System (Molecular Devices Corporation). Tartrazine absorbance was read at 425 nm, fluorescein was read at 485 nm excitation and 530 nm emission.
Data Analysis
Unless otherwise specified, the same volume was dispensed into all wells of a plate. Dispense precision is reported as the coefficient of variation (CV) of the optical readout, which was calculated as standard deviation divided by the average. In order to compare precision between test methods, it is necessary to know whether or not an observed difference is statistically significant. Statistical significance was represented by 95% confidence intervals for each CV and depicted graphically as error bars. The 95% confidence intervals of the CV were calculated using the chi-squared statistic (χ2), which quantifies confidence in the variance and standard deviation of a population in much the same way as the more familiar t-statistic does for the mean of a population: 4
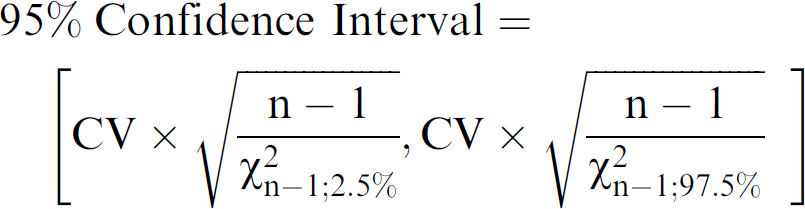
where n is the number of data points used to calculate the CV and the square bracket notation indicates the lower and upper bounds of the 95% confidence interval. For a fixed confidence level of 95%, the size of the confidence interval depends only on the number of data points and the CV, so for 96-, 384- and 1536-well plates, the 95% confidence intervals are:
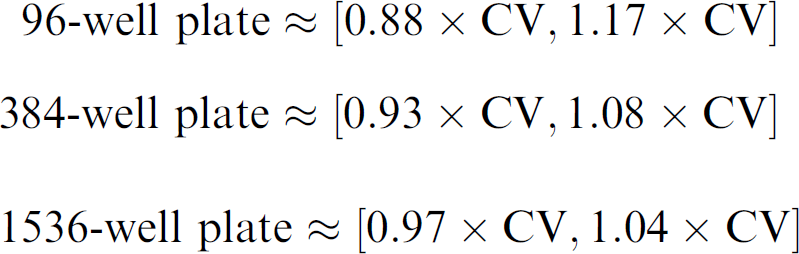
The confidence intervals are used to compare one CV with another; if the confidence intervals of the CVs do not overlap, they are statistically different at the 95% confidence level.
Optimizing Plate Reader Setup
As mentioned in the introduction, it is actually the imprecision of the total system (dispensing, microplate, and reader) that is ultimately reported by the plate reader. Consequently, it is important to optimize the plate reader setup to obtain the highest possible readout precision.
To illustrate this concept we consider one example here. The Analyst plate reader reads one well at a time by moving the microplate to position each well under a fixed optics module. As the microplate comes to rest, the decelerating forces cause the free surface of the liquid (the meniscus) in the wells to oscillate. Such oscillations, though not directly observable when the plate is inside the plate reader, can be easily observed by tapping the side of a liquid-filled 96-well plate on the lab bench. The oscillations noticeably decay a few tenths of a second after tapping the plate. With the Analyst plate reader, the user can adjust the motion settling time, which is a delay time between cessation of microplate motion and initiation of reading. 5 This delay is used to allow time for the meniscus motion to cease, thus improving precision. Sample data, shown in Figure 1 for a 96-well absorbance plate repeatedly read at different settling times, demonstrate that reader precision improves with longer settling times up to 200 ms. When 384- and 1536-well plates are read on the Analyst plate reader, precision is optimized with smaller settle times because there is less meniscus motion in the smaller wells of those plates (data not shown).
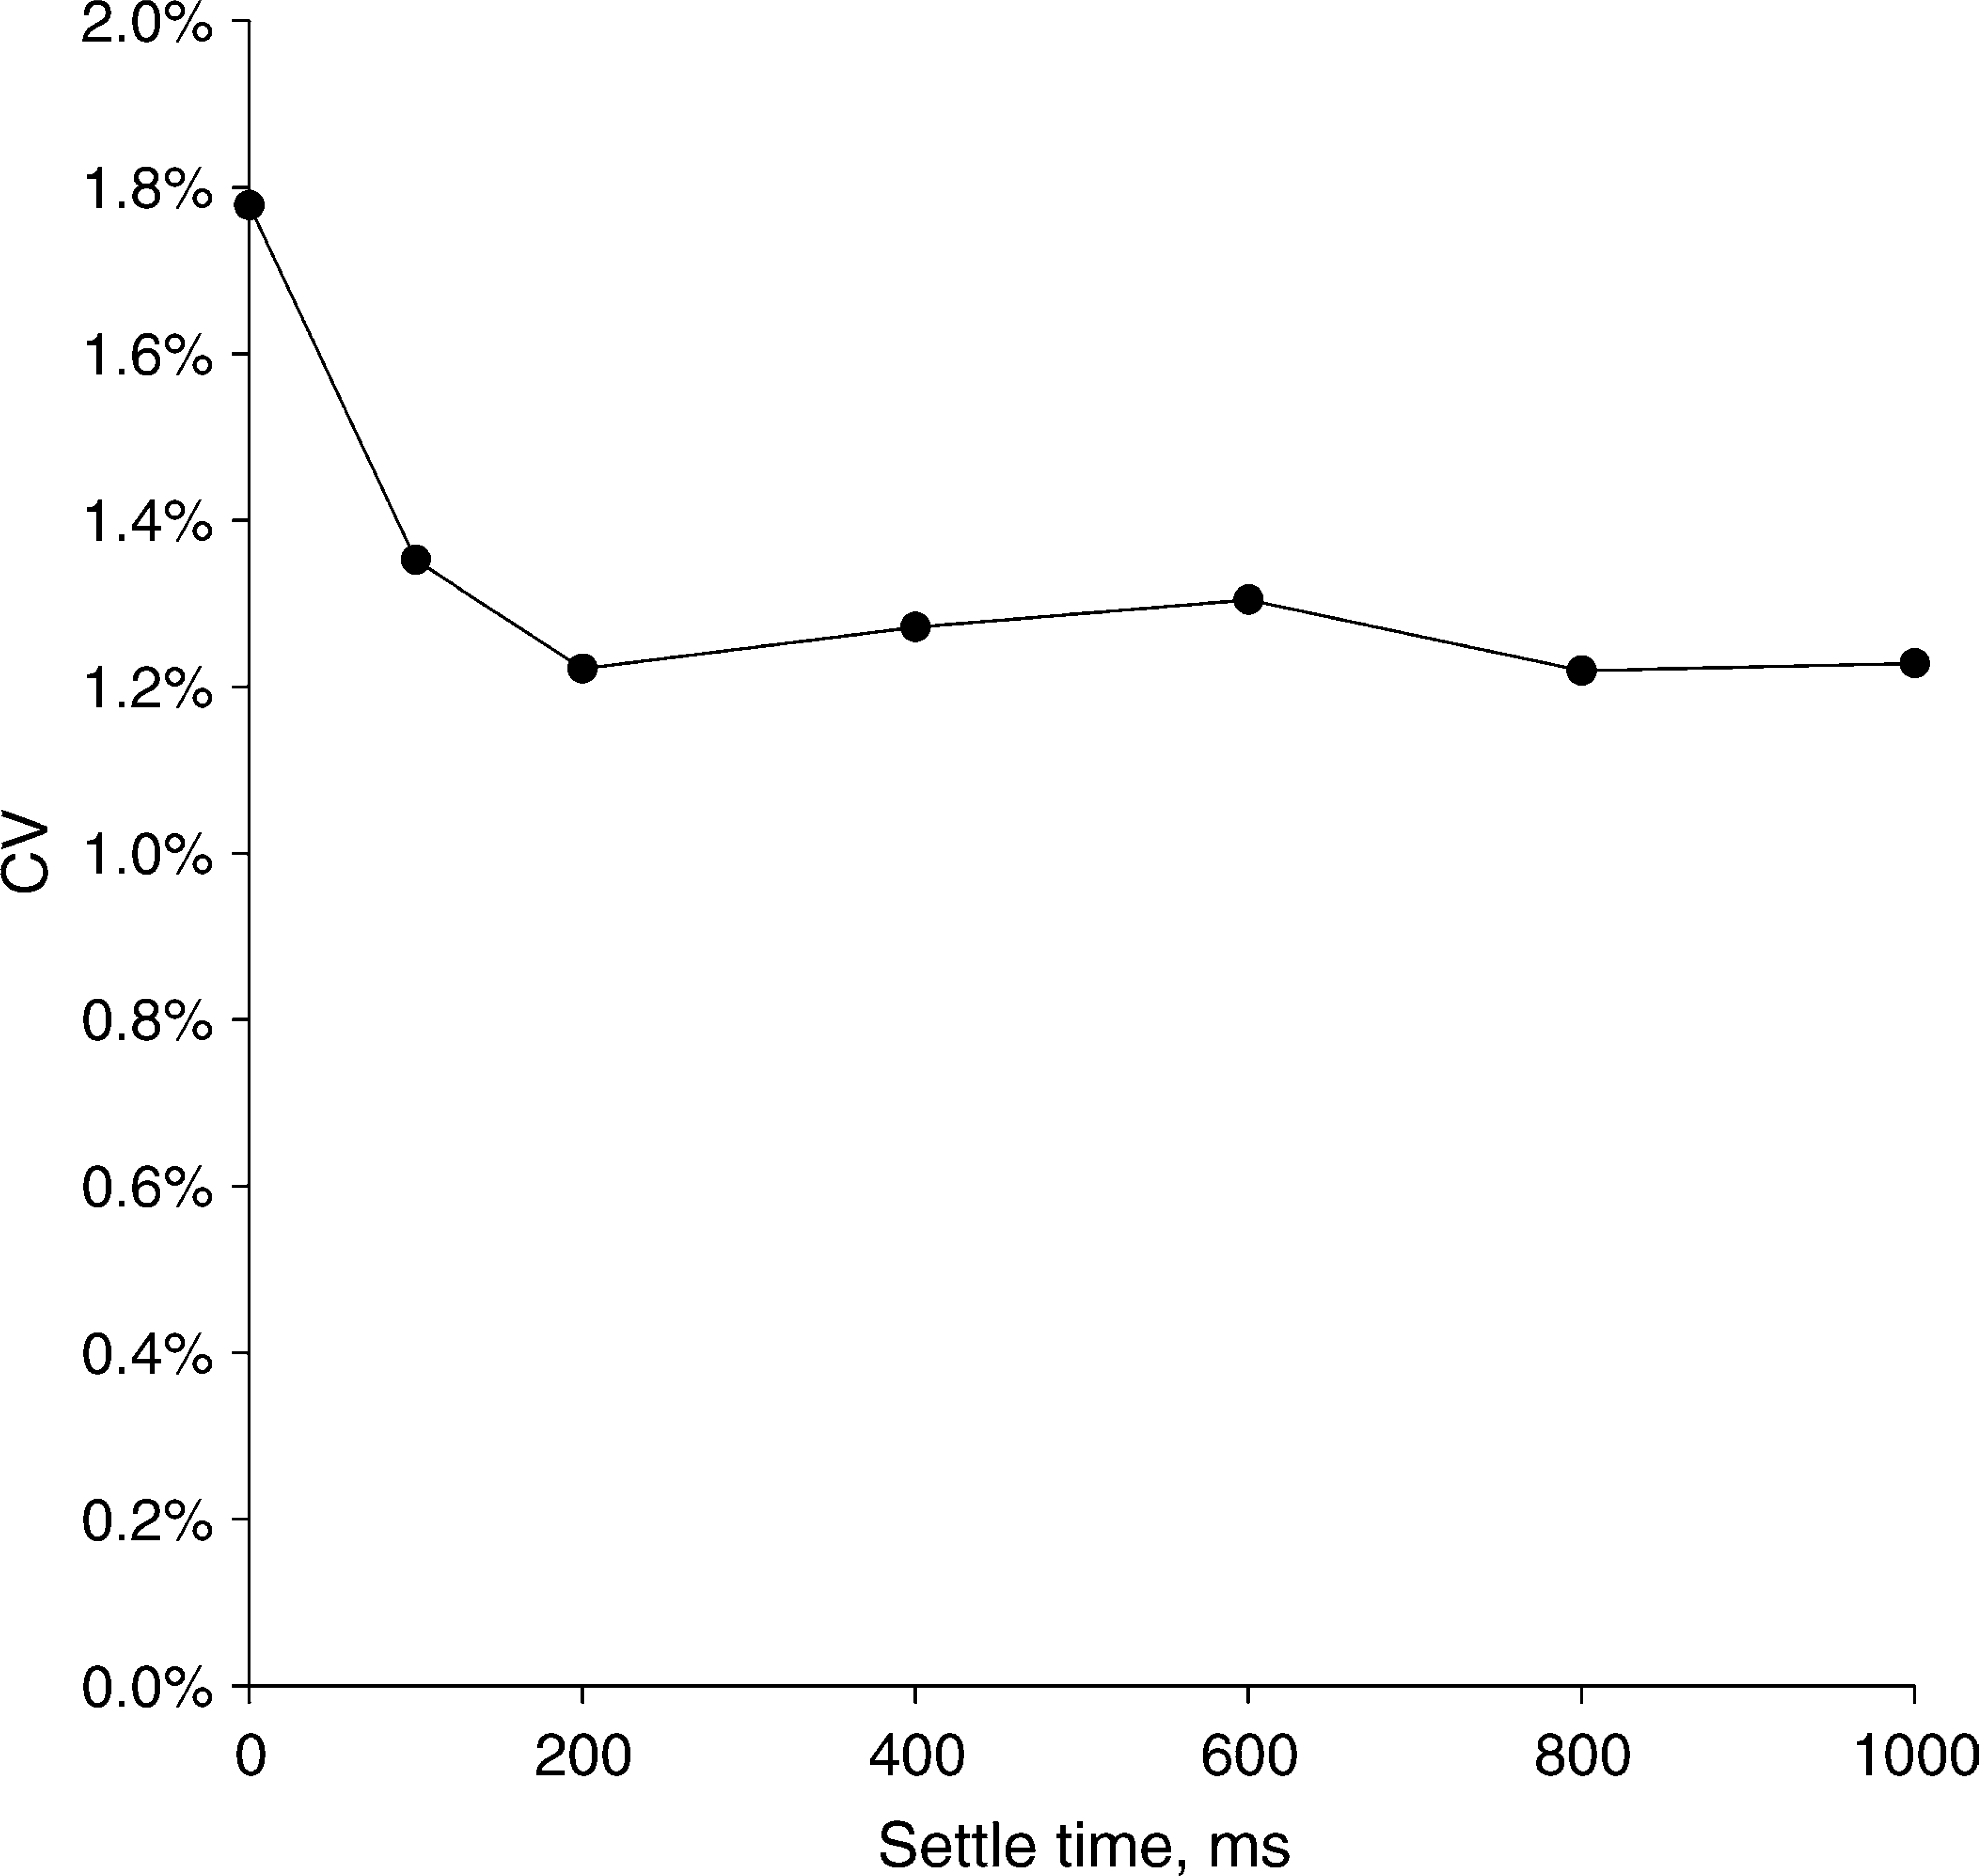
A 96-well plate with 100 uL of tartrazine was read at different motion settling times in an Analyst plate reader. The motion settling time allows the liquid in the well to come to rest before the well is read. Longer settling times give better readout precision.
Likewise, care should be exercised to optimize other plate reader settings or dye chemistry that influences precision. In particular, the following items deserve attention: (1) Signal-to-background (S/B). Select a dye concentration that gives a signal at least 100x larger than the system background; otherwise, background subtraction is required. (2) Reader setup. Adjust reader sensitivity, gain, and other settings to give optimal detection of the selected dye. The settings should give a high signal to reduce readout noise and shot noise but not so high that the plate reader response becomes nonlinear.
It is also important to note that the readout of the microplate reader must be proportional to the liquid volume in the well, otherwise determinations of precision based on those readouts will be inaccurate. One example where readout may not be proportional to liquid volume is a microplate with conical wells or wells with significantly sloped walls, so that the optical path length through the sample does not increase linearly with liquid volume. This characteristic is very pronounced in some small volume microplates that have truncated-cone well shapes. A second example is a combination of plate reader, microplate, and dye that result in low signal-to-background. In this case, it is necessary to correct the readout by background subtraction to assure that readout is proportional to volume.
We verified proportionality of signal to liquid volume on the Analyst plate reader in both absorbance and fluorescence modes by creating a volume series of the dyes (0, 20, 30, 40,…, 100 μL/well in 384-well plates) and reading the signal response versus volume of dye. The responses, shown in Figure 2, demonstrate that the Analyst plate reader gives a signal response that is substantially linear with dispensed volume in both absorbance and fluorescence modes over the volume range of 0-80 uL.
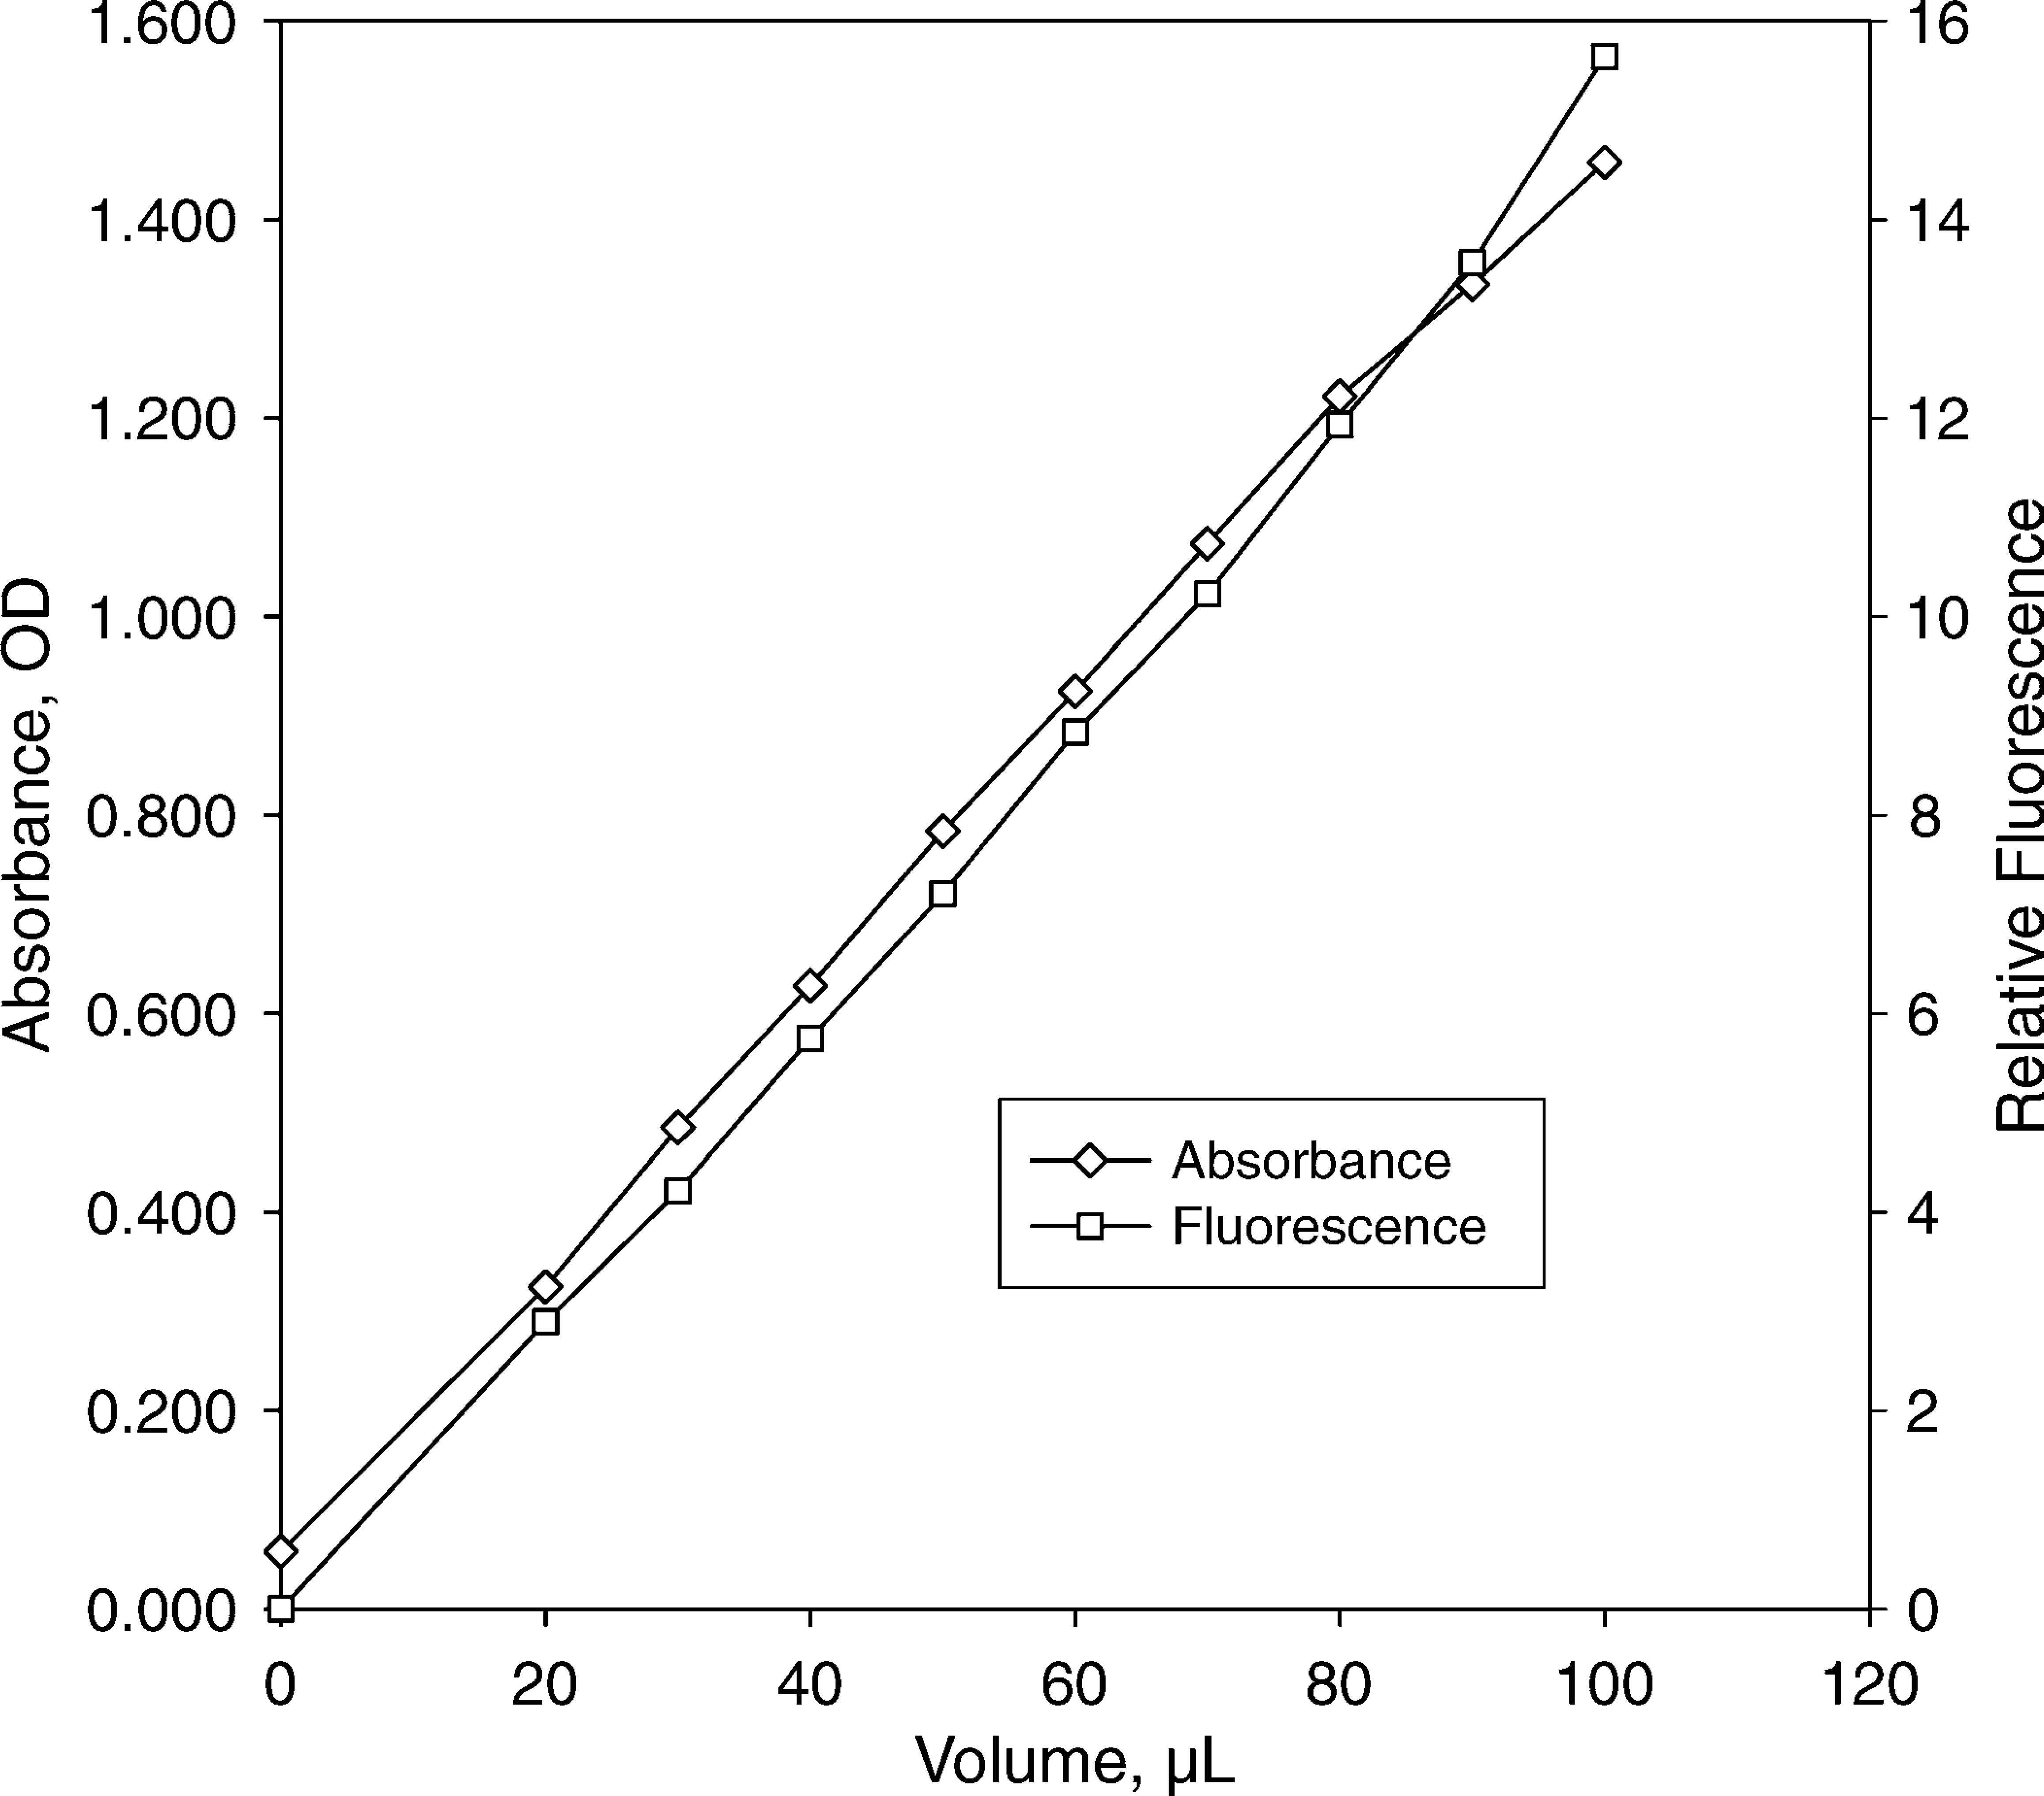
Linear response of absorbance and fluorescence to volume in well. The indicated volume of either 40 mg/L tartrazine or 100 nM fluorescein was manually dispensed in 384-well plates, and the signal was read on the plate reader. Absorbance is reported as optical density: OD = -log10(Sample Intensity/Blank Intensity). The readouts in both absorbance and fluorescence increase linearly with dispensed volume up to 80 uL.
Plate-to-Plate Variability and a Dual-Dye Method
One potentially confounding factor in comparing absorbance and fluorescence methods is the random variability of dispensing that occurs from one plate to the next. Figure 3 shows an example of plate-to-plate variability, in which one of five nominally identical fluorescence plates has a significantly higher CV. We routinely encounter this type of plate-to-plate variability when testing both handheld and automated dispensers. If such a variation had occurred in a comparison of the absorbance and fluorescence methods, it could have been mistakenly attributed to a performance difference between the methods.
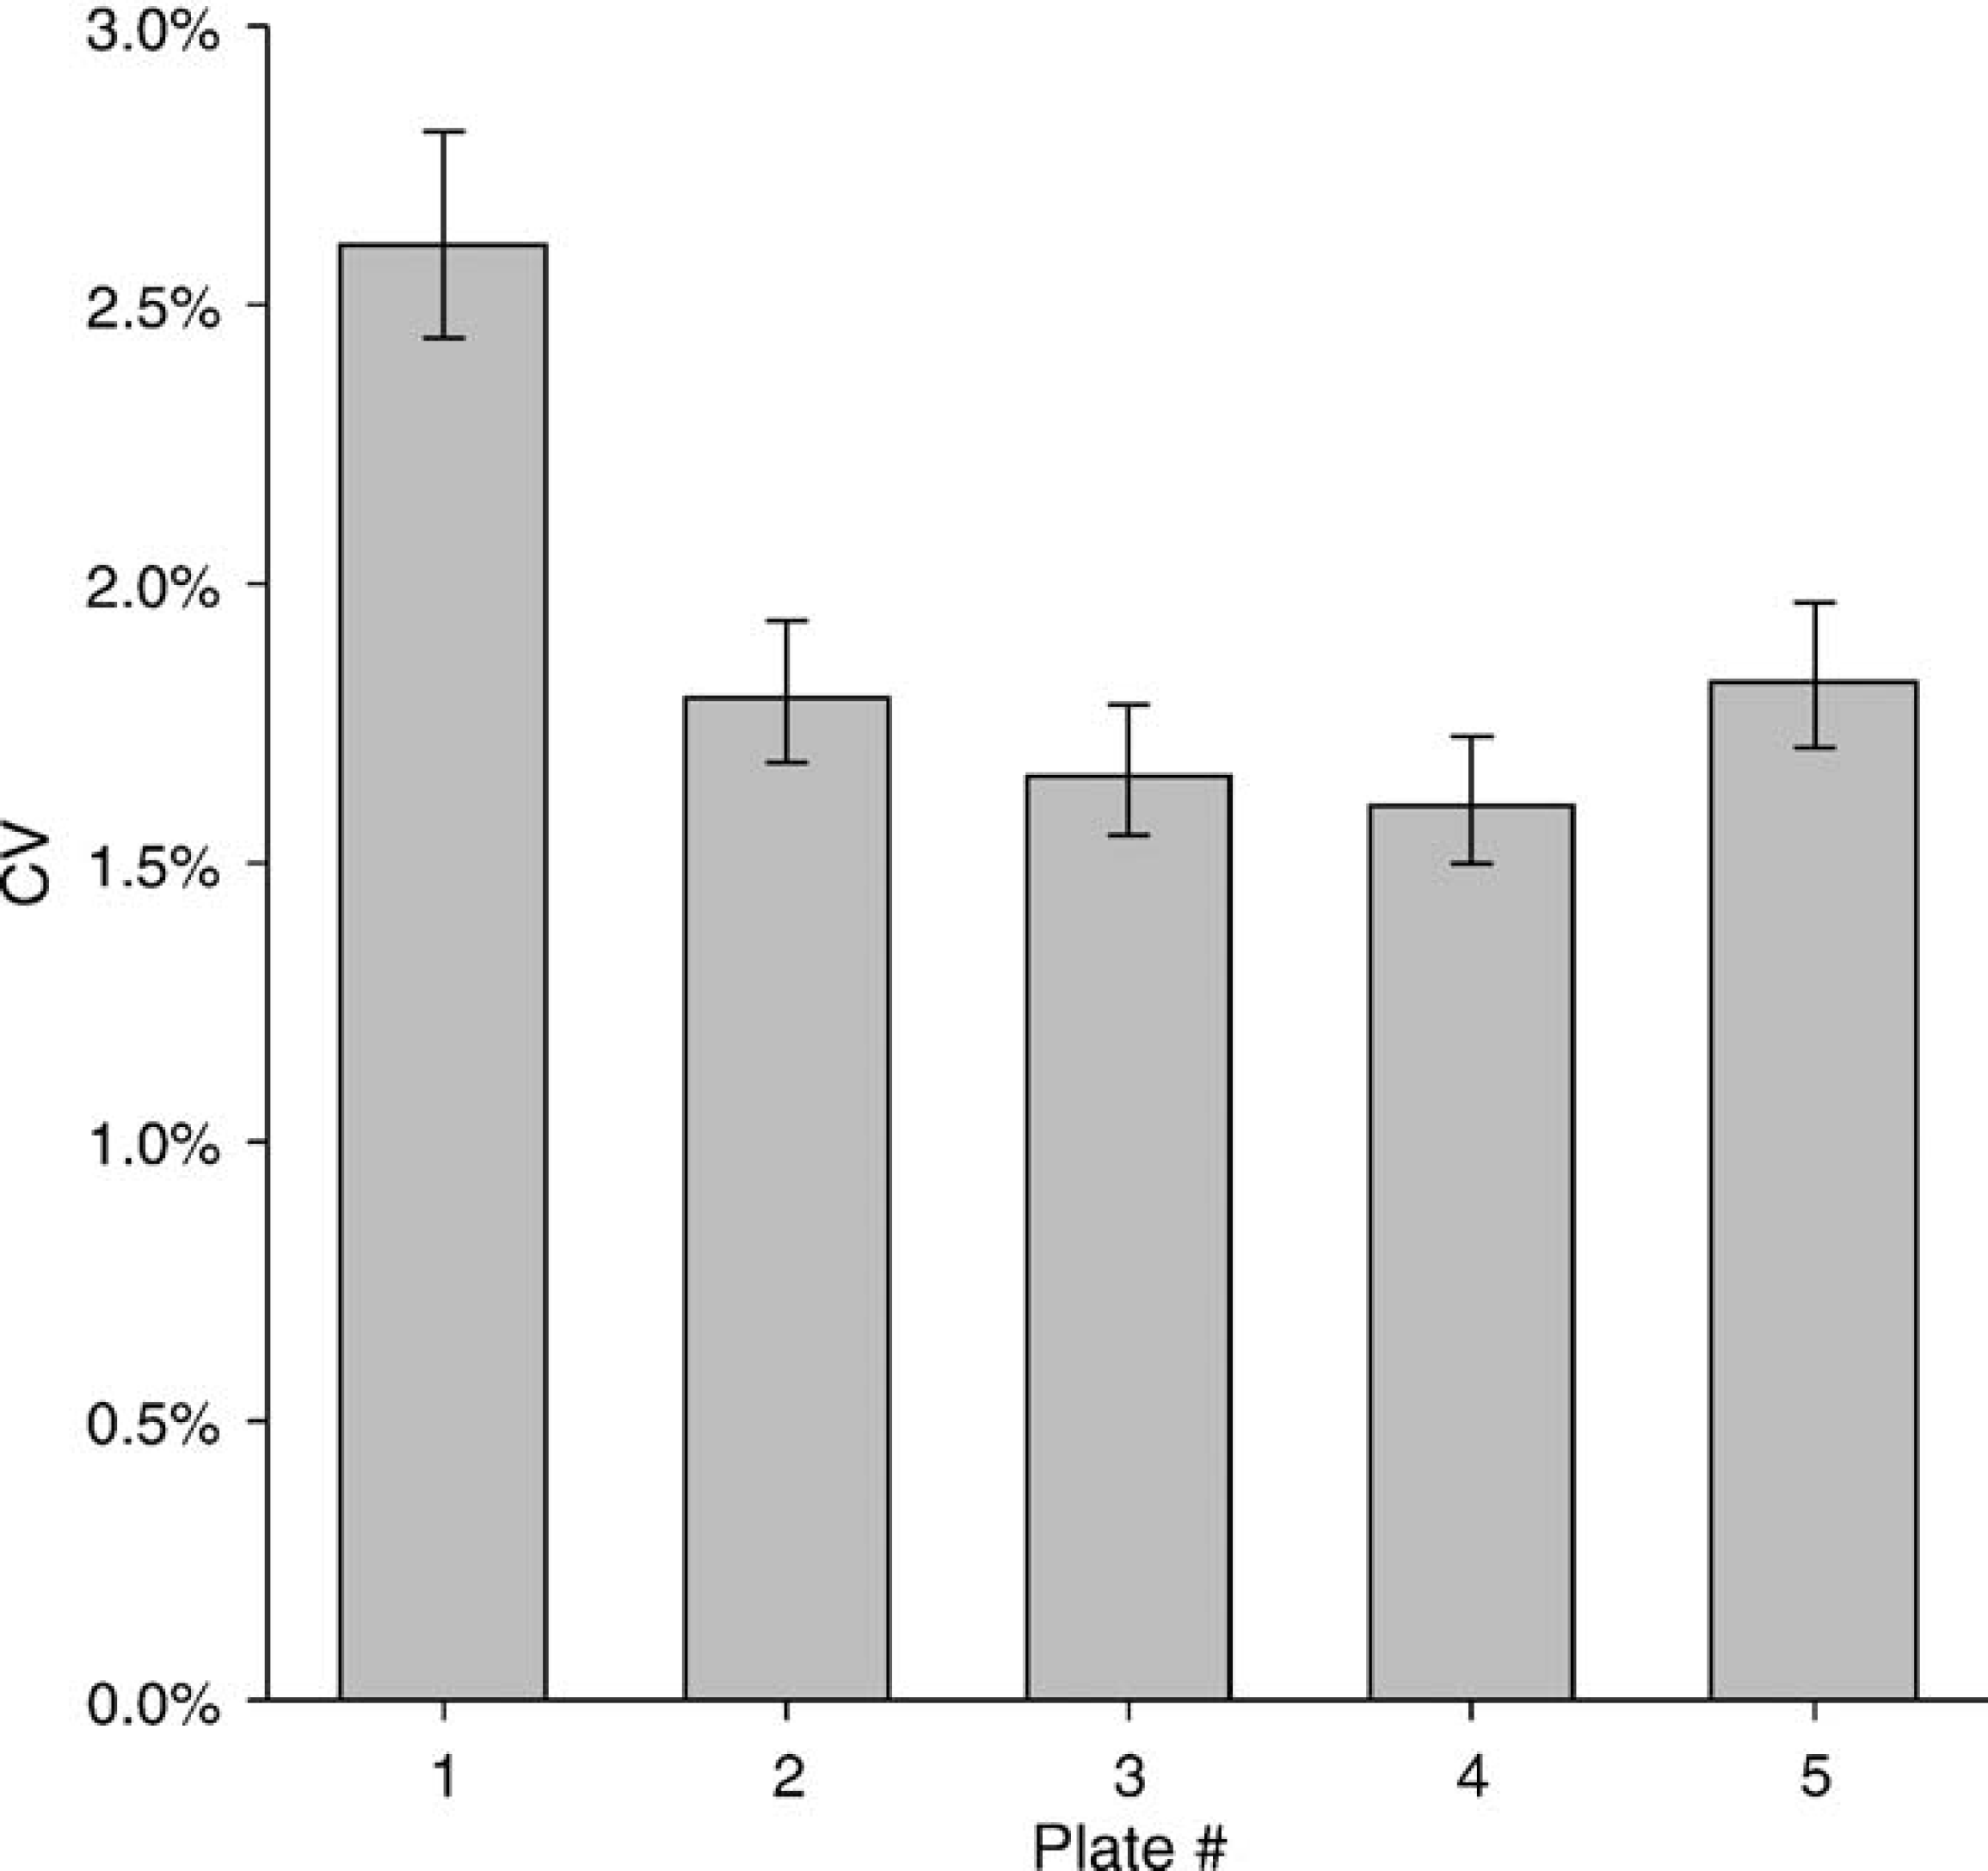
An example of plate-to-plate dispensing variability. Fluorescein (100 nM, 25 μL/well) was dispensed into all wells of five replicate 384-well plates, and the fluorescence was read to determine the dispensing CV. The first plate had a significantly higher CV than the other four plates. A detailed examination of the readings for the first plate revealed that the higher CV resulted from two wells that had readings approximately 20% lower than average.
One way to compensate for plate-to-plate variation is to run large numbers of replicate plates so that plate-to-plate variations can be averaged out. We chose instead to use a dual-dye method, in which the absorbance and fluorescence dyes were mixed in and dispensed as a single test solution. The dual-dye method, in principle, should make it easier to distinguish performance differences between absorbance and fluorescence.
As an aside, the presence of fluorescein does not appear to change tartrazine absorbance, but in the presence of tartrazine, the fluorescein signal is reduced by about 20% (data not shown). The fluorescence signal reduction may result from color quenching of the excitation light or from other mechanisms.
Comparison of Absorbance and Fluorescence in 96- and 384-Well Plates
When tartrazine and fluorescein were dispensed into separate plates, absorbance and fluorescence methods sometimes reported different CVs. However, when tartrazine and fluorescein were dispensed together into the same plate using the dual-dye method to control for plate-to-plate variability, the difference in CVs was no longer significant. Figures 4 and Figures 5 show results for 96- or 384-well plates, respectively.
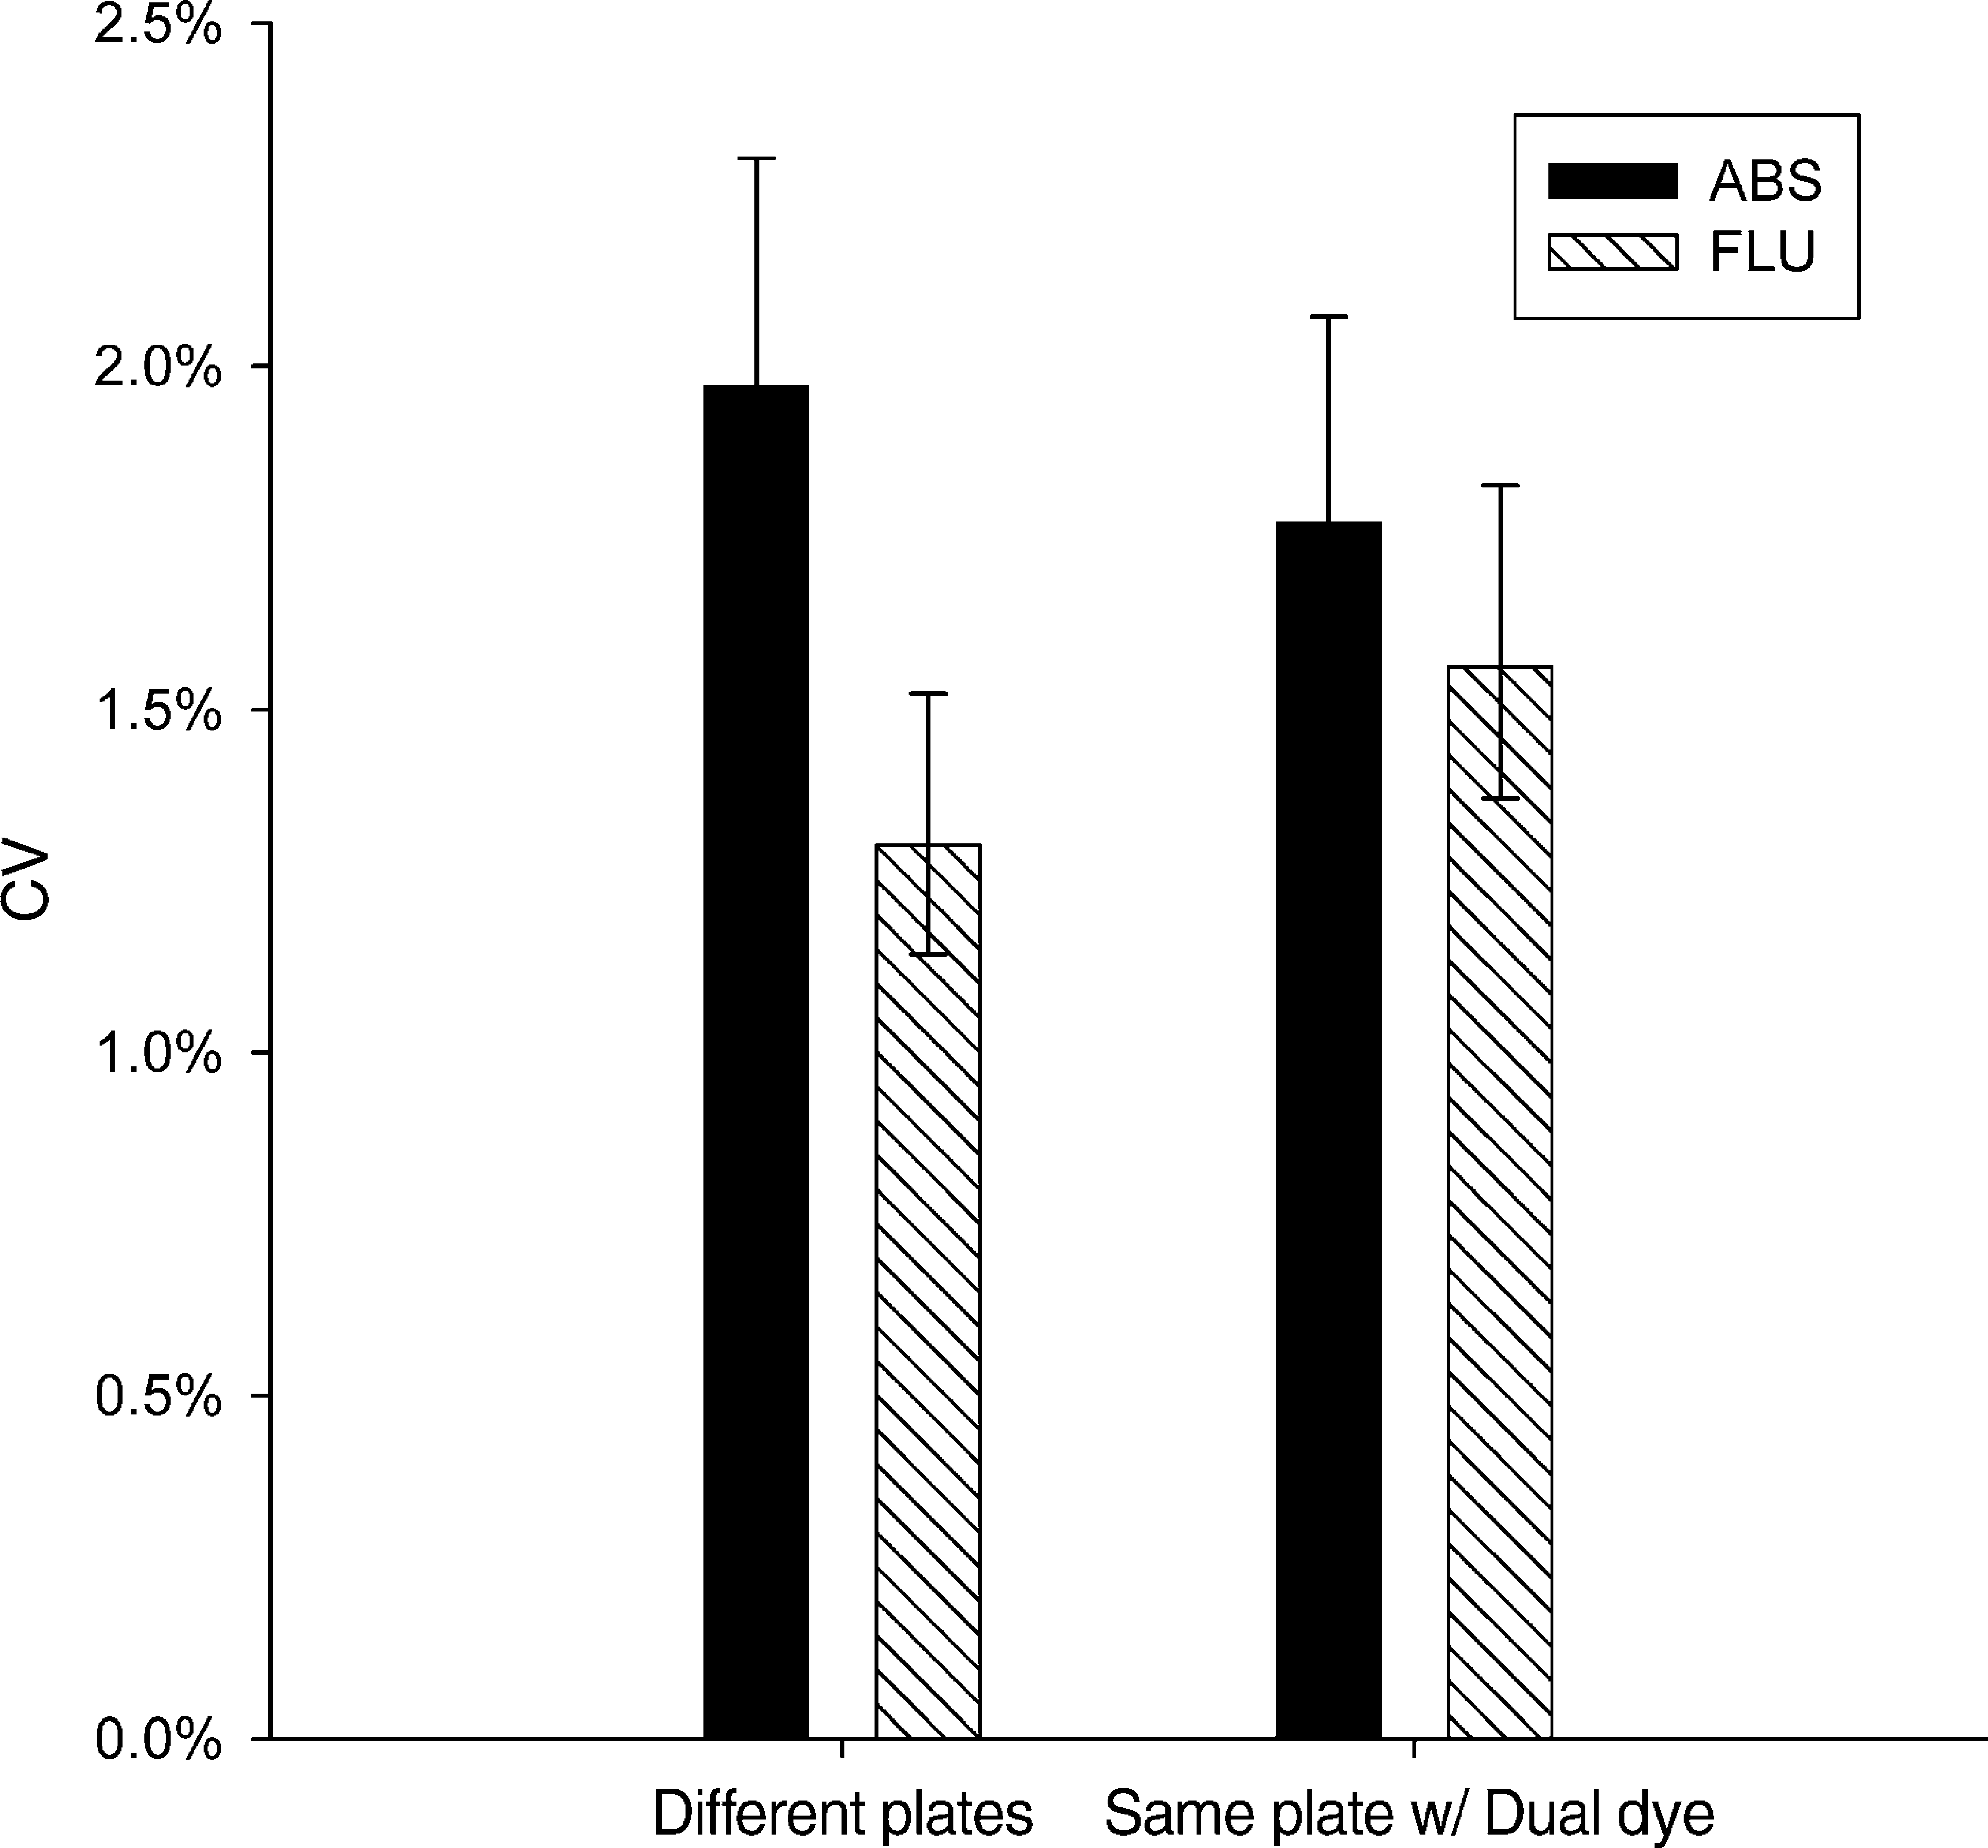
Absorbance and fluorescence detection of dispenser performance in 96-well plates. The left pair of bars shows an apparent difference between absorbance and fluorescence when tested in single-dye plates. The right pair of bars shows a similar test, but instead on a dual-dye plate. When the dual-dye method was used, there was no significant difference between the detection methods, suggesting that the difference observed in single-dye plates resulted from random plate-to-plate variation rather than a real difference in the detection methods.
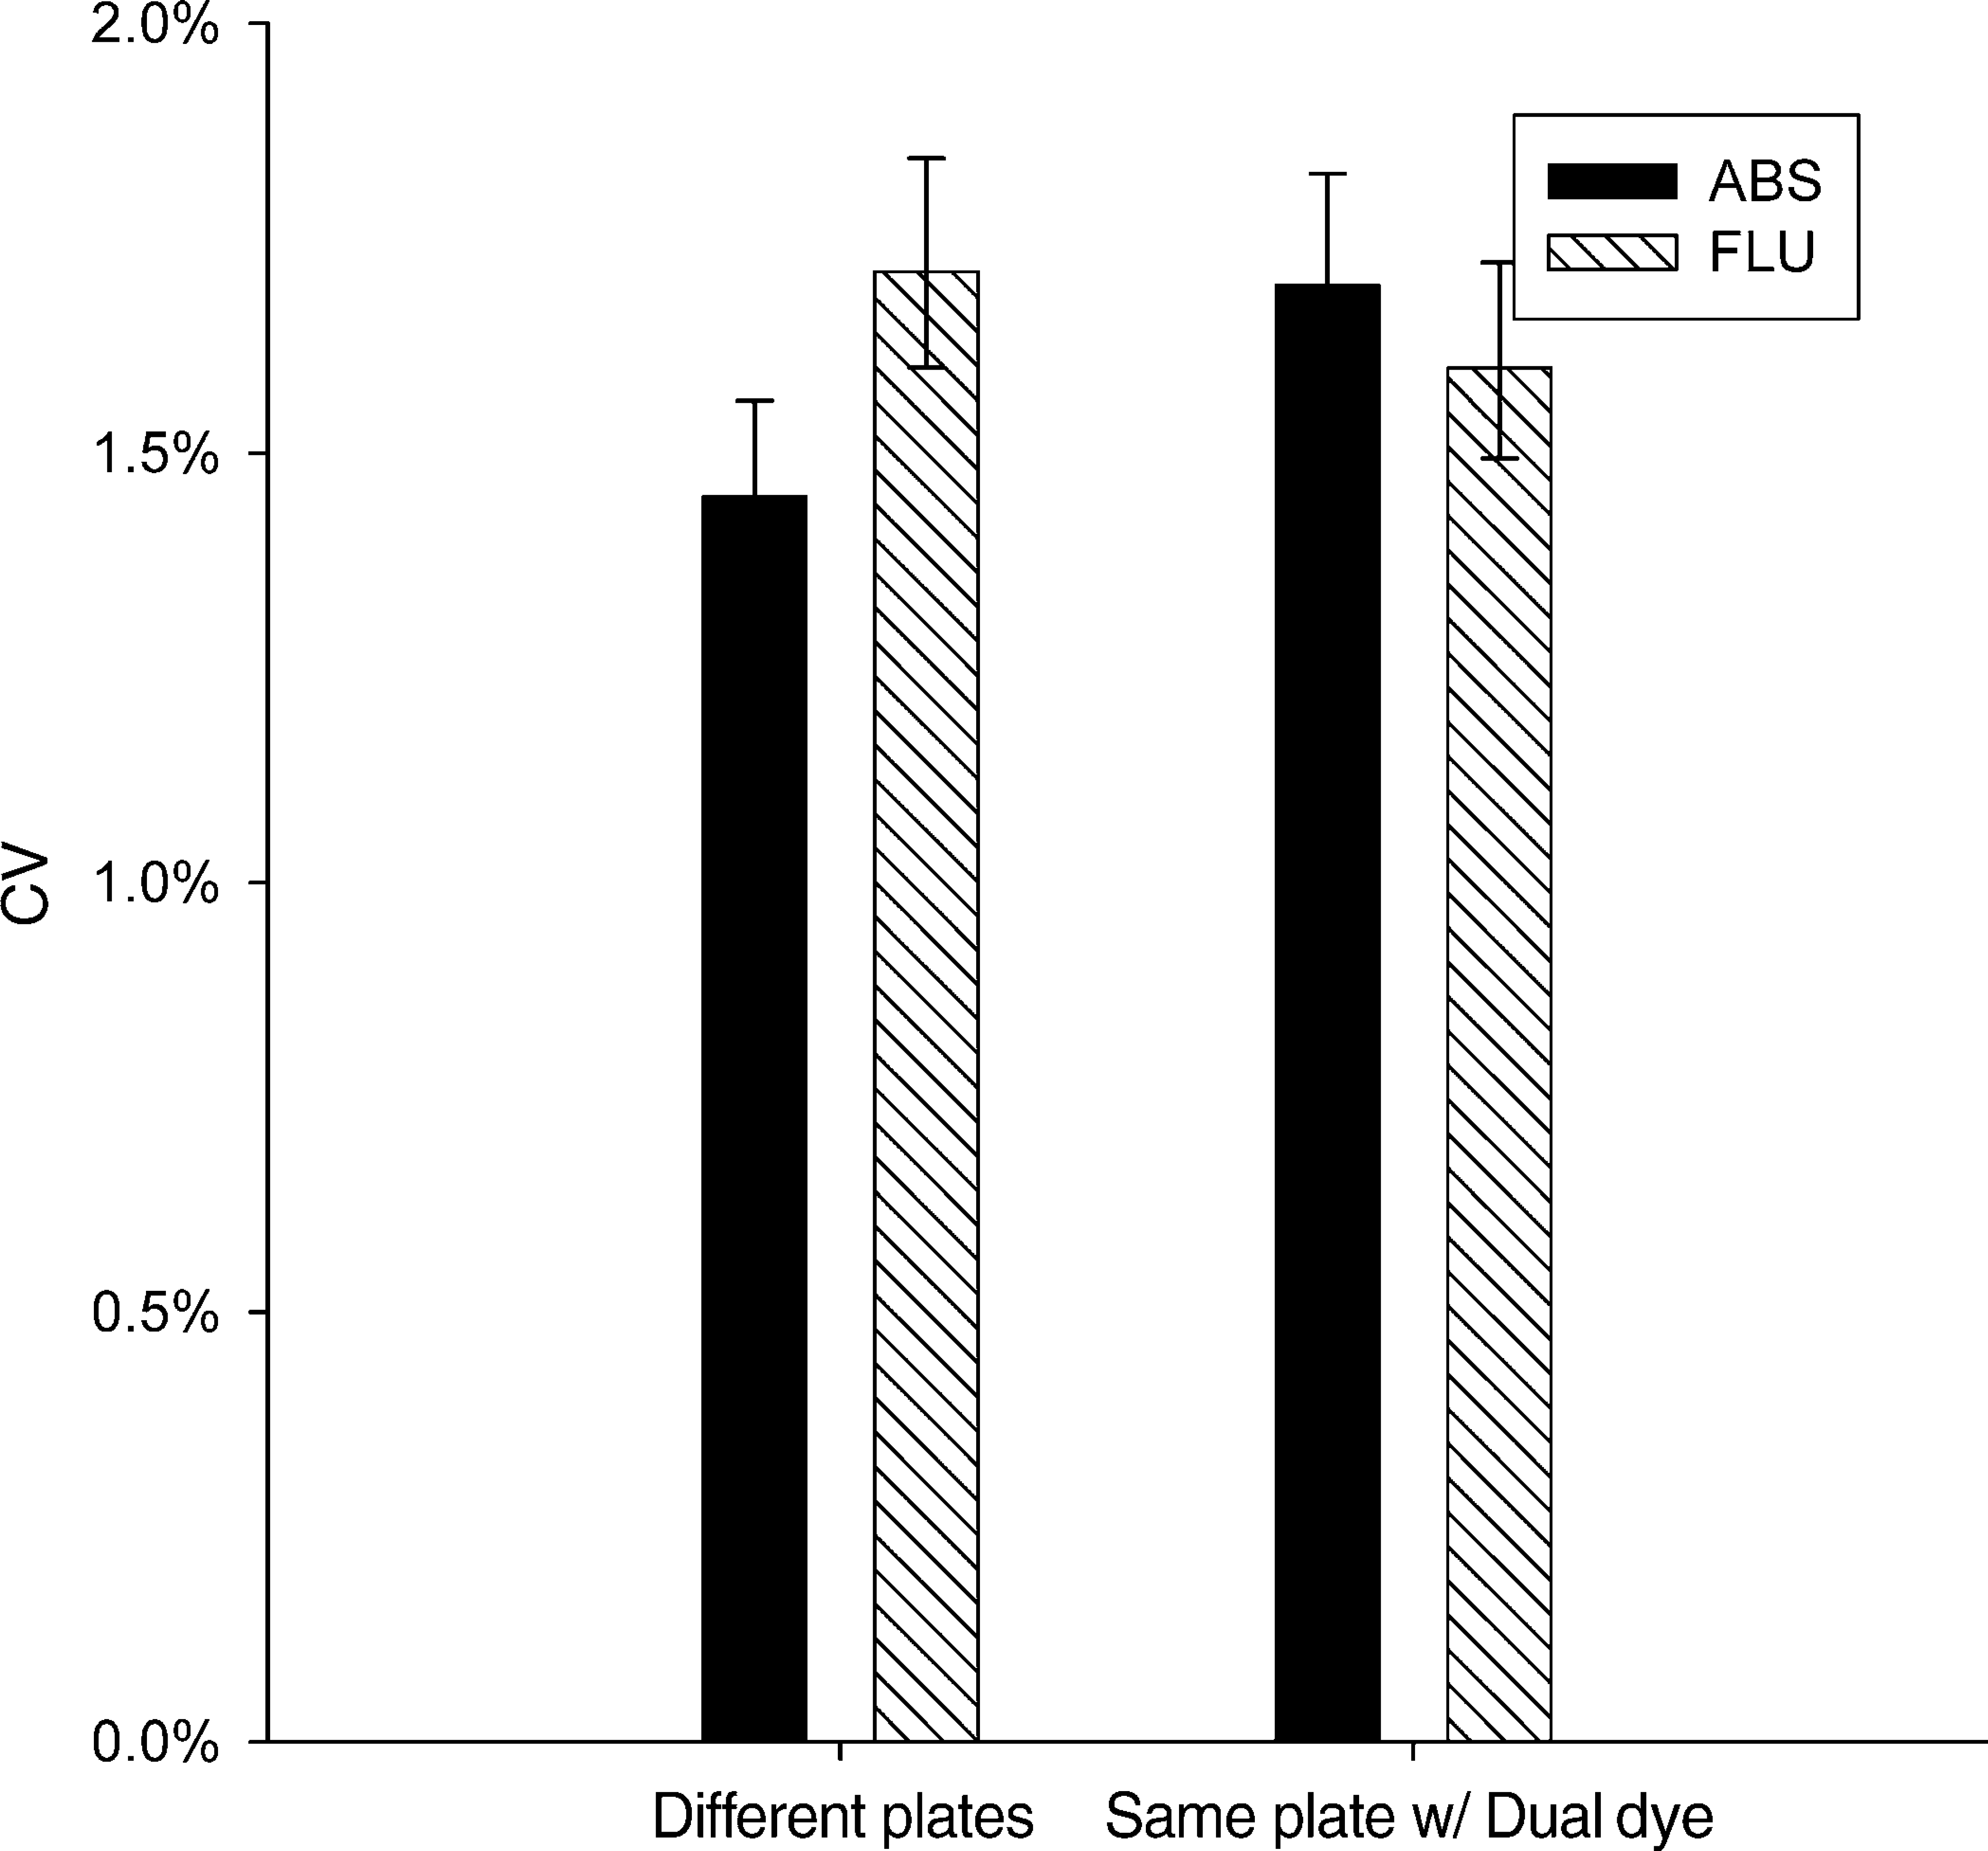
Comparison of absorbance and fluorescence detection of dispenser performance in 384-well plates at 25 μL/well, otherwise the same as Figure 4. When single-dye plates were tested, there was an apparent difference in performance of fluorescence. When dual-dye plates were tested, the difference was insignificant, suggesting that the difference observed in single-dye plates resulted from random plate-to-plate variation rather than a real difference in the detection methods.
These observations suggest that absorbance and fluorescence perform similarly in 96- or 384-well plates when care is taken to control plate-to-plate dispensing variability. These results also demonstrate the effectiveness of the dual-dye method in compensating for plate-to-plate variability; when dispensed into separate plates, the difference between fluorescence and absorbance was greater than when the dyes were dispensed together into a single plate.
Comparison of Absorbance and Fluorescence in 1536-Well Plates
The shape and small size of wells in 1536-well plates can complicate dispensing in a number of ways. For instance, air bubbles can be trapped in the well, or the liquid might form an asymmetric meniscus shape. These two types of artifacts may interfere with the optical readout and give an inaccurate indication of dispensing precision.
To investigate this, the dual-dye solution was dispensed into plates using an AquaMax DW4 dispenser. The plates were read in both absorbance and fluorescence modes to obtain raw dispense precision. Then the plates were centrifuged (10000 rpm, 10 min) and read again to determine final dispense precision.
Results are in Figure 6. Using the dual-dye method, the initial raw fluorescence measurement resulted in a higher CV than did absorbance for the same dispense. After centrifugation, the plate was read again. The CV from the absorbance readout was essentially unchanged by centrifugation, while the CV from the fluorescent readout was significantly lowered and brought into agreement with the absorbance readout.
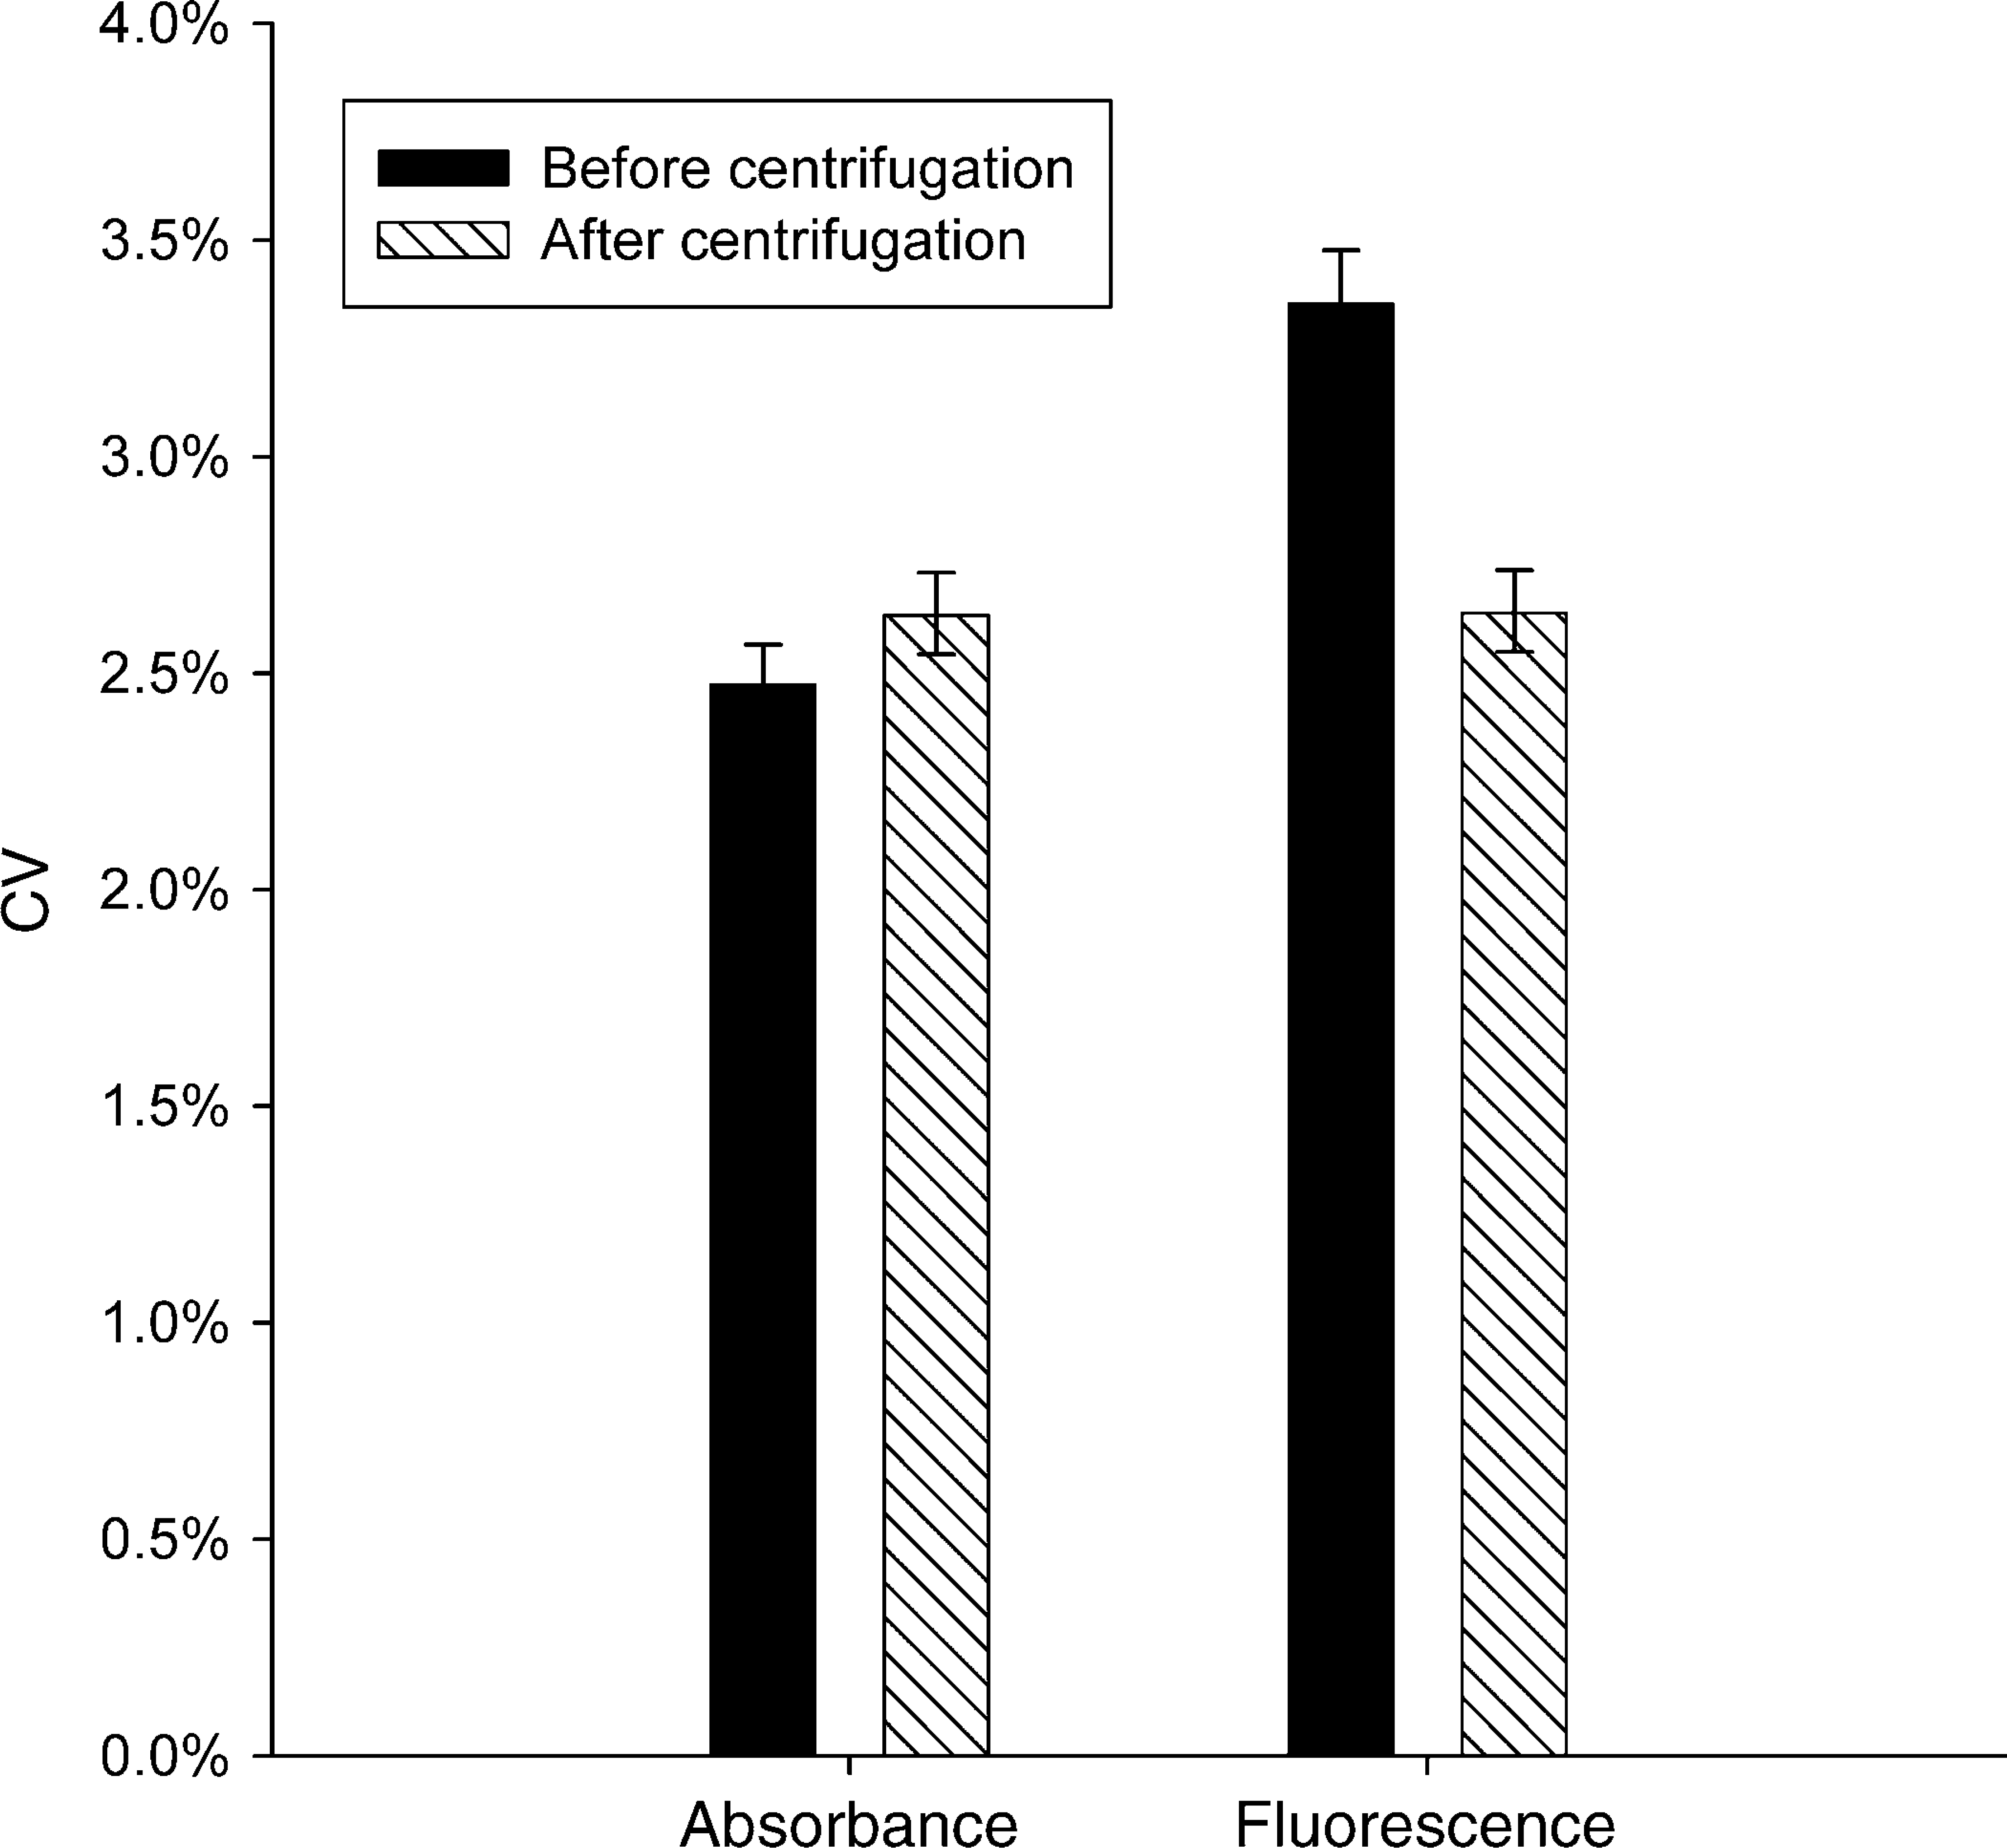
CVs in a dual-dye test of a 1536 plate in absorbance and fluorescence, before and after centrifugation. Before centrifugation, fluorescence readout gave a higher CV than did absorbance. Centrifugation did not change the absorbance CV and reduced the fluorescence CV to be essentially the same as that of absorbance.
Meniscus Effects on Optical Readout
It is interesting that the fluorescence readout changed upon centrifugation while the absorbance readout did not. Though this phenomenon was not investigated, we speculate that centrifugation may make meniscus shapes more uniform across the plate, leading to improved fluorescence uniformity. If that is true, then fluorescence readings in 1536-well plates must be more sensitive to optical artifacts caused by irregular meniscus shapes that are reduced or removed by centrifugation. Though we have not investigated the mechanisms, one possible cause may be the differences in optical design for absorbance versus fluorescence in the Analyst microplate reader. These differences are illustrated in Figure 7.
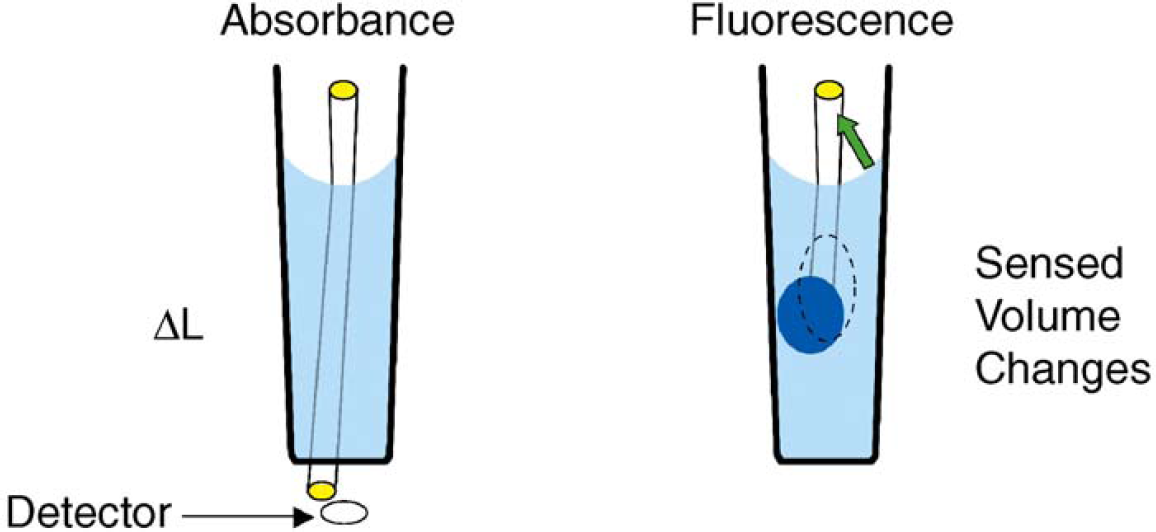
Illustration of differences between absorbance and fluorescence. Absorbance readers are commonly designed such that the light beam goes through the center of the well, and the readout is proportional to the product of liquid height and concentration. The meniscus can change the height of the liquid in the well, which changes path length. An asymmetric meniscus can also act like a lens, steering the light beam off-axis, and thus, increasing the optical path length; in severe cases, meniscus steering could cause the light beam to miss the detector. In fluorescence, the Analyst GT fluorescence optics are designed to produce a sensed volume. The meniscus shape can affect the size and shape of the sensed volume (depicted by the ovals). It can also reflect stray excitation light back to the detector (green arrow).
Under ideal conditions, absorbance measurements by the Analyst microplate reader are made along a straight, vertical path through the center of the well, and the instrument reports readings that are proportional to the product of concentration and path length. The meniscus can cause deviations from these ideal conditions, acting like a lens to steer the light path off center. One effect of beam steering is to increase the path length. The change in path length can be estimated by a simple geometric analysis as:
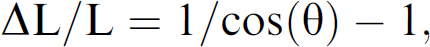
where L is the path length and theta is the steering angle in radians, so even a relatively large steering of 0.175 radians (10 degrees) would increase the path length by only 1.5%. In more severe cases, meniscus effects could steer the beam off the detector. Perhaps a more significant effect is that if the meniscus is very concave (or convex), the height of the liquid column, and hence the path length, could be decreased (or increased) by perhaps as much as 10% (a 0.5 mm change in a 5 mm path length) relative to a flat meniscus.
In contrast, fluorescence measurements by the Analyst microplate reader detect a sensed volume 6 that is, by design, some distance from the walls of the well to reduce background signal from the microplate autofluorescence. The readout is roughly proportional to the product of the sensed volume and the average concentration within that volume. The meniscus, acting like a lens, can alter the size, shape, and location of the sensed volume in the well. If the meniscus steers the sensed volume so much that it overlaps the walls of the well, the average concentration changes significantly, potentially changing the signal by tens of percent. By this reasoning, fluorescence may be more sensitive to irregular meniscus shapes. The meniscus can also act like a mirror, reflecting excitation light back to the detector in a variable way and changing the size of the background component of the signal, though this effect should be relatively small if the instrument's optical filtering is effective in removing the excitation light.
Discussion and Conclusions
One difficulty in getting reliable comparisons between absorbance and fluorescence detection of dispensing precision is plate-to-plate variation in dispensing. We used a dual-dye method to control for this variability. We found that the dual-dye method was an effective way to control plate-to-plate variability, especially when compared with running larger numbers of replicate plates to average out the variability.
Using the dual-dye method, absorbance and fluorescence modes reported similar CVs in 96- and 384-well plates. Absorbance and fluorescence also performed similarly in 1536-well plates when care was taken to centrifuge the plates; without centrifugation, fluorescence gave higher CVs. Centrifuging the plate had no effect on absorbance CVs.
The mechanism by which centrifugation improves fluorescence CVs is not known. It is possible that fluorescence is more sensitive to optical artifacts caused by entrapped air bubbles or ill-formed meniscus shapes and that centrifugation removes these artifacts.
Since the performance between the two methods is similar, method selection can be determined by ease of use and cost considerations. Absorbance often has a more limited dynamic range than fluorescence, so a larger collection of standard solutions is needed to cover a wide range of dispense volumes. On the other hand, the dyes for absorbance tend to have longer shelf lives because they are less susceptible to photobleaching.
On the Analyst plate reader, 1536-well absorbance is susceptible to cross talk unless black-wall, clear-bottom plates are used, whereas fluorescence is not susceptible to cross talk in 1536-well plates when all-black plates are used. Since the all-black plates are somewhat less expensive when compared to black-wall, clear-bottom plates, cost considerations favor fluorescence for 1536-well plates.