
Abstract
We have automated in vitro dose-inhibition assays to evaluate newly synthesized chemical entities and to rapidly produce and disseminate the results with minimal personnel. A variety of assay methods were automated using the Tecan Genesis Workstation to produce ten-point titration curves and generate reproducible KI values. Our integrated software package provides the unique ability to simultaneously inventory and schedule compounds into various in vitro assays. A worklist generator, in combination with a Gemini script automatically makes variable pre-dilutions of compounds, retrieves incubation plates from the Carousel using the RoMa Arm, performs serial dilutions of compounds within the final 96 well incubation plate using disposable tips, and adds essential assay reagents. Our “Expert System for Data Analysis” automatically retrieves data from a reader (e.g. TopCount, FLIPR or VIPR), analyzes the data based on a set of rules, and provides value added reports. An overview of the basic workflow and the integrated software for support of the drug discovery process is described. The ability of the Tecan Robot to produce dose-inhibition profiles is illustrated and validated by using a radioligand binding assay and a DMSO solubilized fluorescein dye method.
Keywords
Introduction
Performing in vitro dose-inhibition assays is crucial to the drug discovery process. The speed and timeliness by which novel chemical entities reach the market place are, in part, determined by the ability of the scientist to rapidly identify and optimize lead drug candidates. In the past, these manually run assays have been labor intensive, repetitive, time consuming and prone to error. High throughput screening facilities rapidly evaluate hundreds of thousands of compounds at a single dose providing leads for novel drug targets. These new leads are given to project teams consisting of chemists and biologists, who work together to optimize compounds producing drug candidates. In order to efficiently generate dose-inhibition profiles on demand in a number of in vitro assays, we developed a workflow that lent itself to automation using a Tecan Genesis Workstation. Our integrated software package uses Visual Basic to couple a Microsoft Access Database, Microsoft Excel and the Tecan Gemini Software. The primary purposes of these assays are to produce ten point dose-inhibition profiles for each compound and to obtain KI values. The rapid dissemination of this data allows the chemist to build structure activity relationships (SAR), and alter the structure to obtain desired biological effects.
A workflow, including an information management system to facilitate the analysis of newly synthesized drug candidates, is outlined. The ability of the Tecan robot to produce reproducible dose-inhibition profiles is illustrated by using a radioligand binding assay. We also present a fluorescein dye method to judge the Tecan's ability to accurately and precisely perform serial dilutions. This dye method can be used as a tool to evaluate any liquid handling system and ensure that the pipetting is being performed within the required tolerances.
DRUG DISCOVERY WORKFLOW: PRODUCING IN VITRO SAR FOR NEW CHEMICAL ENTITIES
New chemical entities received from medicinal chemists need to be rapidly profiled in an agreed upon battery of in vitro assays. This process is greatly facilitated by the adoption of a workflow that is supported by a user friendly information management system and robotic automation (Figure 1).
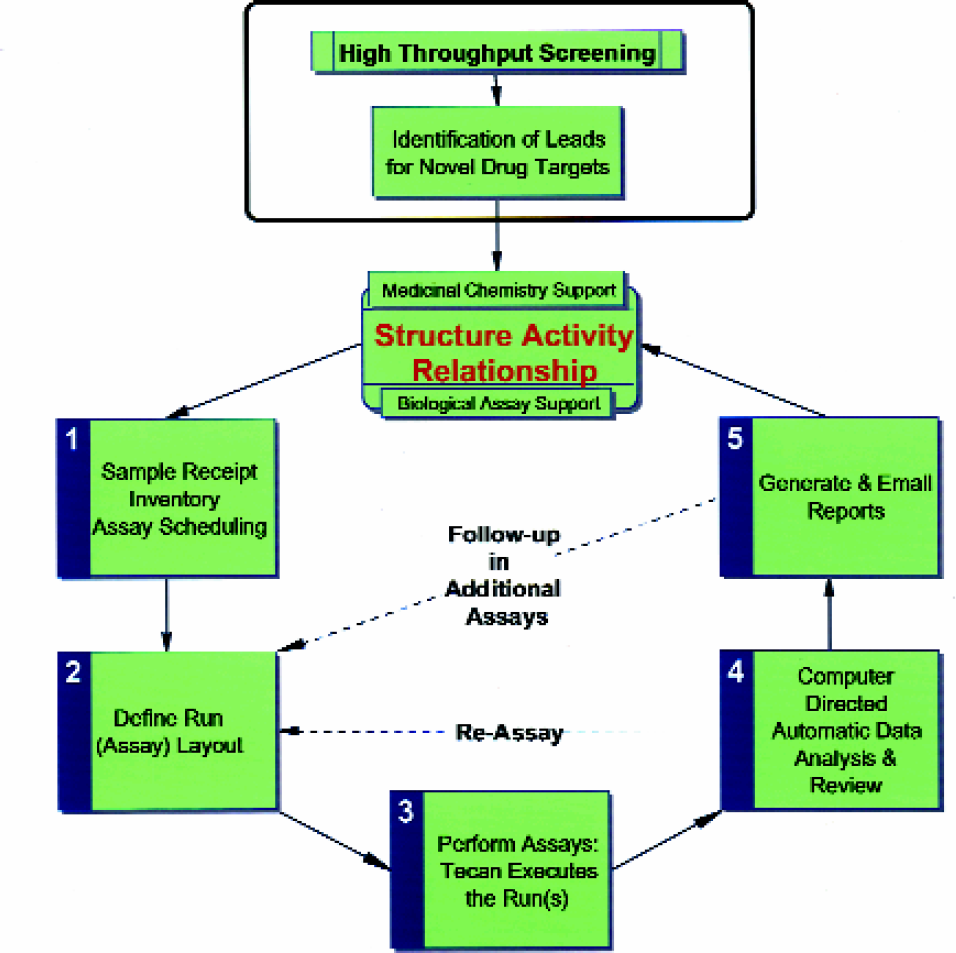
Drug Discovery Workflow: Producing In Vitro Sar for New Chemical Entities
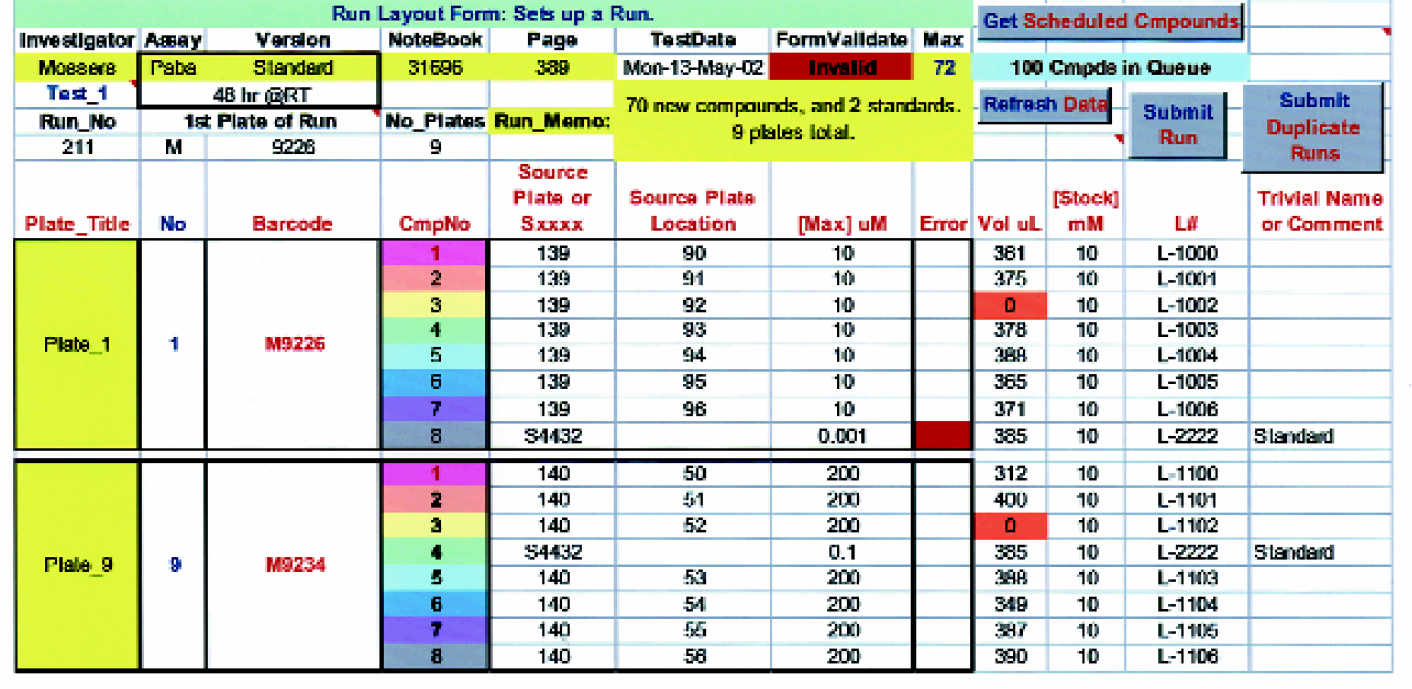
The Tecan robot is used to simultaneously inventory and schedule compounds into various in vitro biological assays (Figure 2). Each run of an assay (Figure 3) consists of up to 9 “barcoded” incubation plates containing 8 compounds per plate, whose initial starting concentration is adjusted as needed (Figure 4).
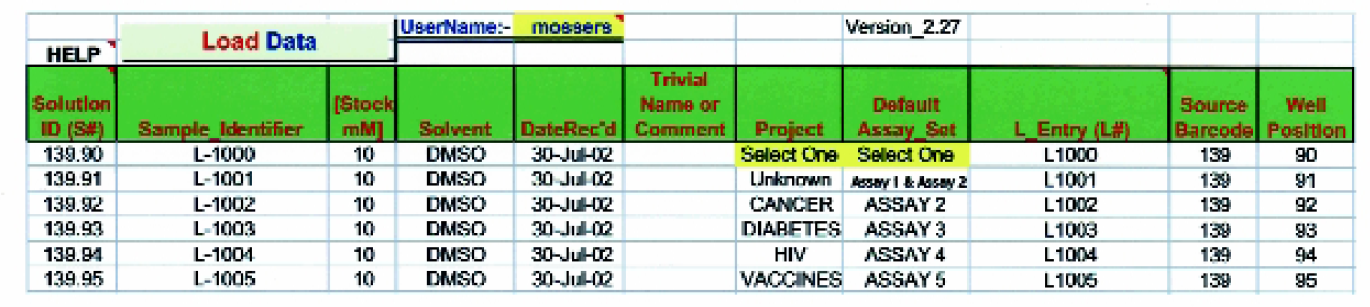
Sample Receipt, Inventory and Assay Scheduling Process. Solutions of new chemical entities are received in barcoded vials. The Tecan robot transfers the solutions into barcoded source plates, measures the transferred volume, generates a unique “Solution_ID” and opens the illustrated Excel workbook (See “Material and Methods” for details). The operator only needs to pick the information highlighted in yellow from drop down boxes. The
This
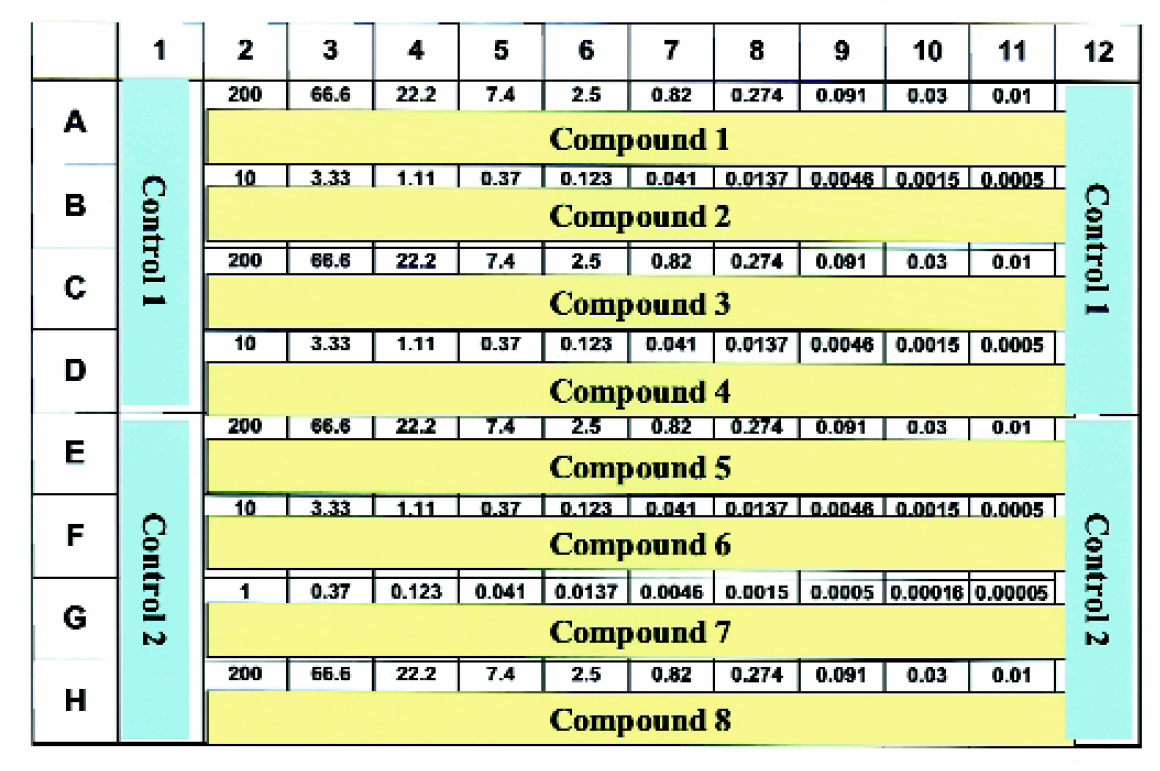
Layout for serial dilutions in 96 well plates. This standard layout contains eight compounds per incubation plate; one in each row. The highest starting concentration for each compound begins in column 2 (eg. 200 μM) and three-fold serial dilutions are performed across the plate and finished in column 11. Sixteen wells in columns 1 and 12 are designated for controls (eg. Total Binding or Non-Specific Binding).
Prior to starting a set of runs, the Tecan Deck must be manually populated with compounds (source plates or vials), and any other essential assay reagents (Figure 5). The Tecan Robot initially dilutes compounds up to 10 4 -fold, if necessary, into pre-dilution plates. Next, the Tecan RoMa Arm fetches barcoded incubation plates from the Carousel and populates the Deck for the first run. Samples are serially diluted directly in the final assay plate and positive/negative controls are added (Figure 4). Upon completion of the serial dilutions, these incubation plates can be transported back to the Carousel to await later completion or additional assay reagents can be added immediately to finish this run. It is also possible for additional runs to be implemented while the first run is waiting in the Carousel. Finally, the incubation plates are manually processed as required for any particular assay and measured by a reader (eg. TopCount, VIPR, FLIPR).
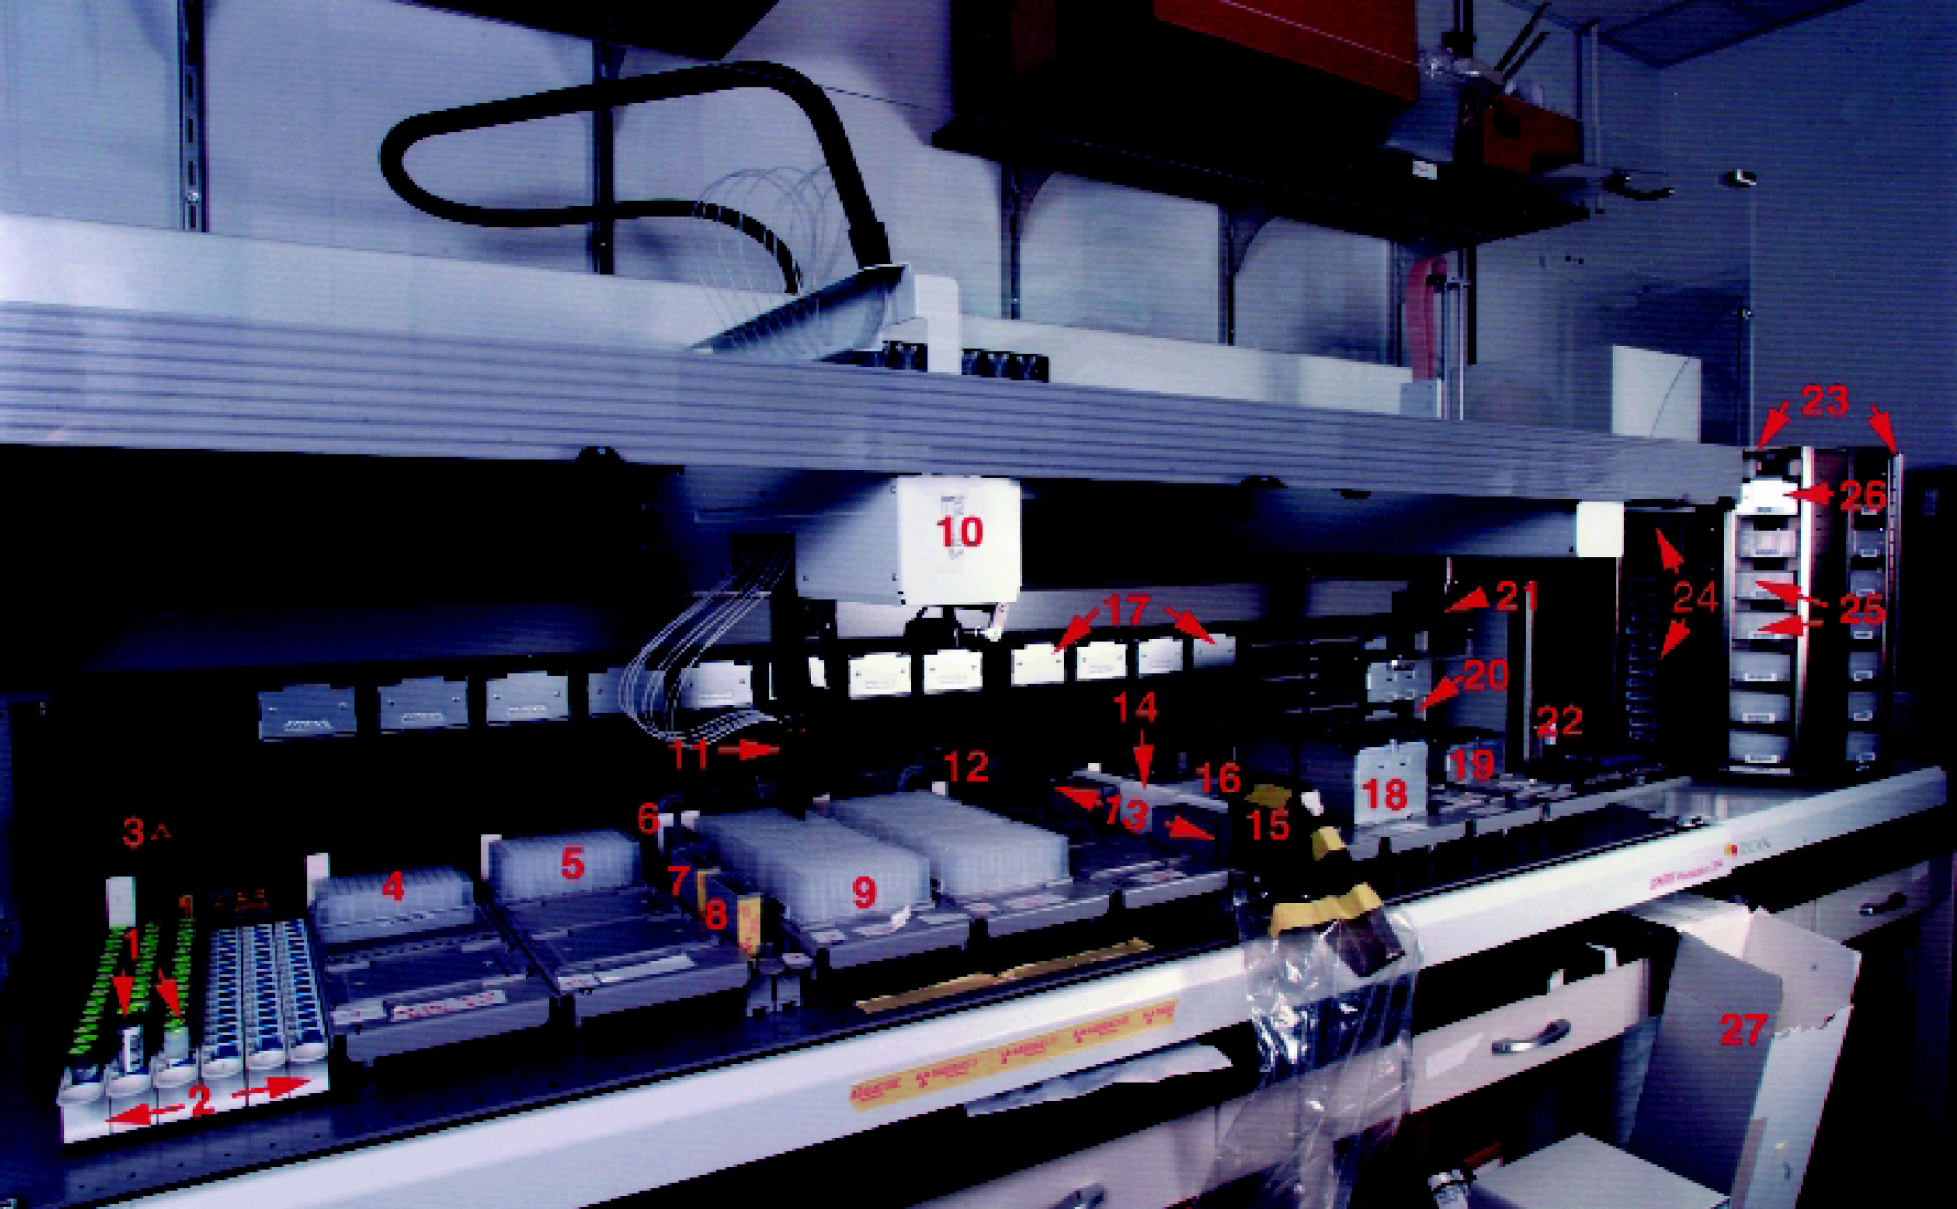
The Tecan Genesis System and its Components. (
An “Expert System for Data Analysis” was developed to allow the computer, using a set of rules, to automatically retrieve and analyze data. The results for all compounds in the run(s) are compared to replicates and historical results to easily identify any variable or questionable results. The data for any flagged compounds can be easily reviewed and/or the compound(s) scheduled for re-assay. Once the results are approved, the data is uploaded to a corporate database and detailed reports profiling the results in a battery of relevant assays are E-mailed to the members of a specific project team. Based upon the results, an agreed upon screening paradigm can be implemented to allow compounds to be scheduled in other key in vitro assays.
Materials and Methods
INSTRUMENTATION
The Tecan Genesis RSP200 (Tecan Inc., Research Triangle Park, N.C.) is equipped with a Positive Identification System Bar Code Scanner and Carousel (Figure 5). Packard unifilter-96 (Meriden, CT 06450) or the dual 96 well Brandel Cell Harvester (Gaithersburg, MD 20877) are used in harvesting membranes. Packard TopCount reader (Meriden, CT 06450) is used to determine CPM values on GF/B filter plates. The Spectra Max Plus (Molecular Devices Sunnyvale, CA 94089) is used to measure Absorbance and the Spectra Max Gemini XS (Molecular Devices Sunnyvale, CA 94089) is used to measure Fluorescence.
FUNCTION OF KEY SYSTEM COMPONENTS
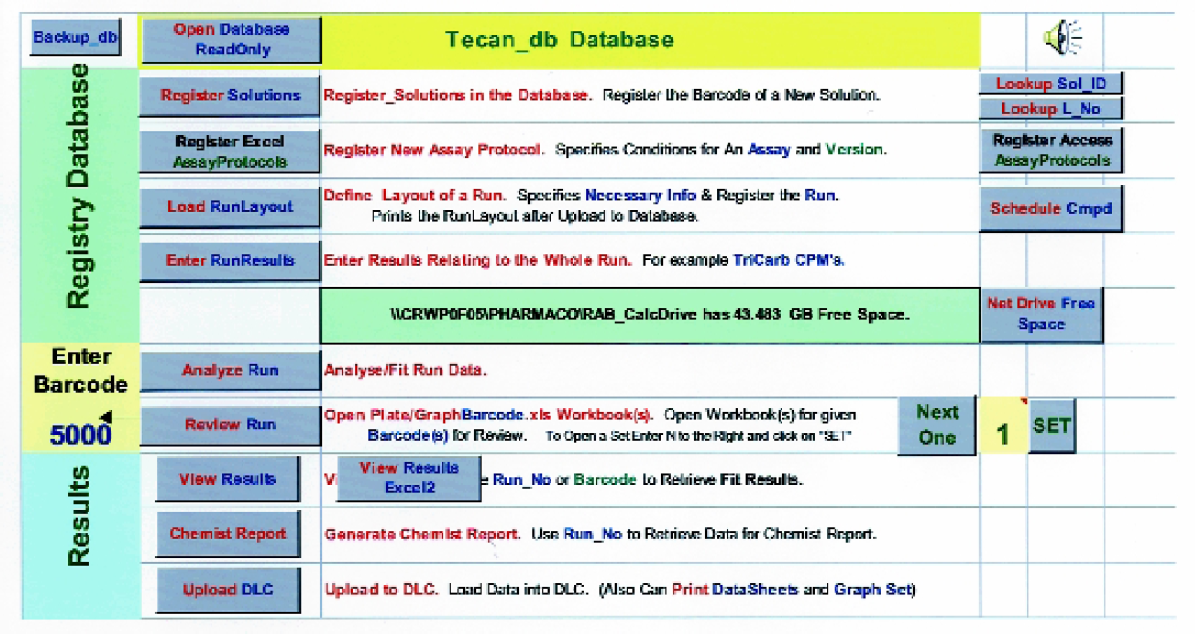
Integrated Software Home Page. This window allows “one button” and/or menu access to most features of the system
SAMPLE RECEIPT, INVENTORY AND ASSAY SCHEDULING PROCESS
Our laboratory receives boxes containing solutions of compounds (typically 10 mM in DMSO) in vials barcoded with the Merck Sample Identifier (L#) (Figure 5, Item 1). The Tecan scans the vials and the source plate(s). A VB worklist generator queries the access database to determine the next available empty location in the first source plate provided. A worklist is generated to perform all pipetting operations. Solutions are transferred into the “Barcoded Source Plates” (0.5 mL 96 well conical plate, Costar #3957) (Figure 5, Item 4)) and the volume after transfer is determined using the Tecan liquid level sensing ability. A unique solution identifier (“Solution_ID”) is assigned to each solution based on the barcode of the source plate and the position in that plate. For example, if the last sample was loaded into source plate 265 in position 8, the first newly submitted compound will be added in position 9 and it will be assigned a Solution_ID of 265.09 (Row A, column 1 is position 1, Row A column 2 is position 9, etc.).
The Excel sheet shown in Figure 2 is automatically loaded and populated after the pipetting is completed. This screen allows the user to easily provide additional information about the samples. Since vials are received into different boxes depending on the “Medicinal Chemistry Project” and the “Battery of Assays” to be tested, this information is readily available to be entered at this time (see Figure 2). Separate source plates can be kept for different projects, if desired. The project specified is used to direct the final report to the appropriate customer. A Visual Basic script, run from the “Load Data” button on this sheet, loads the information and the measured volumes into the Access database and also schedules the compounds in the desired set of assays.
DEFINING THE LAYOUT OF A RUN
When the user defines a run (see Figure 3 for details), information is automatically provided (e.g. see Figure 7 and below) that allows a Visual Basic program to prepare all the worklists needed by the Gemini script to perform all the assays. In controlling the Tecan, a master program and subroutines were written using Gemini software script.
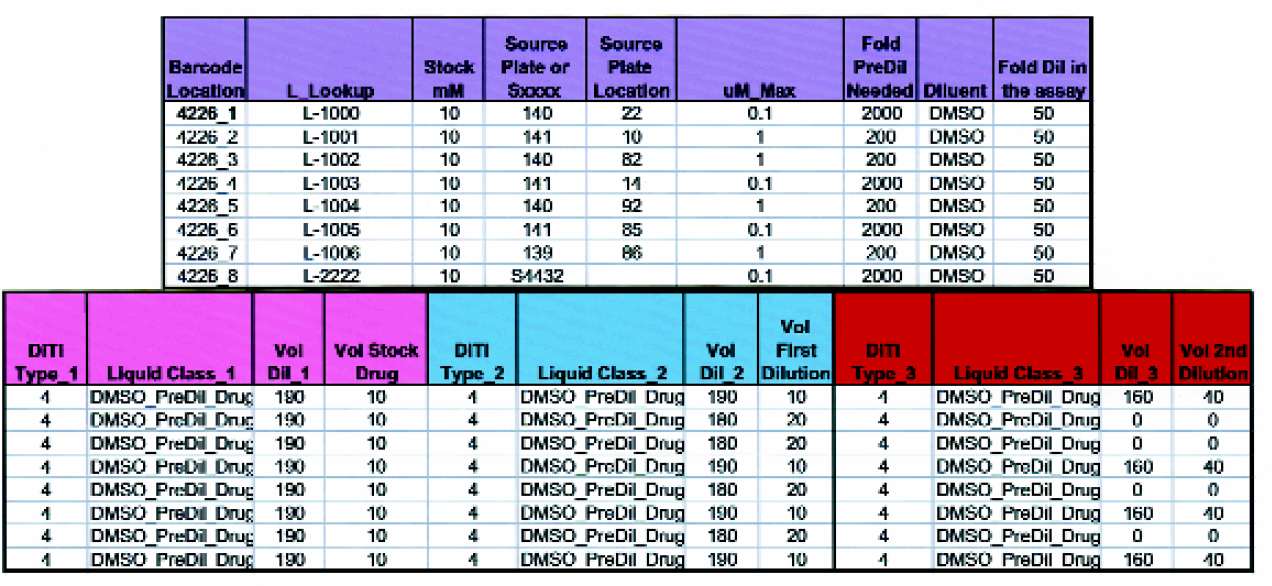
Variable pre-dilution of the stock drug solution is often necessary prior to performing serial dilutions. This Excel worksheet is automatically populated when a Run Layout Form is completed by the investigator (see Figure 3). This information is used by a VB worklist generator to create the instructions that will direct the Tecan operation in performing up to 3 pre-dilutions of the drug.
INITIATING A SERIES OF UNATTENDED RUNS ON THE TECAN
The Tecan robot operation is initiated by pushing a single tool bar icon. This loads a VB program where the user inputs the run number(s) of the assay(s) to be processed. Next, the VB Worklist generator prepares all of the necessary worklists for pre- and serial dilutions. Finally, the Master Gemini Script is loaded and initiated.
VARIABLE PRE-DILUTION OF STOCK DRUG SOLUTIONS
A stock solution often needs to be pre-diluted so that the serial dilutions are tested in the correct concentration range. In the Run Layout Form (Figure 3), the user can specify the desired assay concentration for the start of the serial dilutions, although a default concentration is automatically provided for each version of an assay. The Access database knows the initial stock concentration and any additional dilution of the compound that will occur later in the particular assay. The Excel spreadsheet (see Figure 7) automatically calculates how to perform the necessary pre-dilution using up to 3 separate dilutions with any of the available sizes of DiTi's. Next, the Visual Basic worklist generator prepares the worklist that is used by a subroutine of the master Gemini script in performing any necessary variable pre-dilutions for all the runs to be performed on the Tecan. These pre-dilutions are performed first for all the assays that will be carried out in the unattended Tecan operation.
SERIAL DILUTIONS IN 96 WELL CONICAL OR V-BOTTOM PLATES
Figure 4 shows the standard layout for serial dilutions performed directly in a deep well incubation plate. The Gemini program, via worklist, will send the RoMa Arm to pick up the desired barcoded incubation plates and place them in up to 9 Deck locations (Figure 5, item 9). To prepare for the serial dilutions, 200 μL disposable tips multi dispense 20 μL of DMSO in columns 3#x2013;11, leaving column 2 empty. DMSO (Figure 5, item 6) and the “100% inhibition control” (Figure 5, items 13, exact location defined by the Access database) are then added to desired locations in columns 1 and 12. Next, 50 μL disposable tips aspirate 30 μL of the desired compounds from source plates or predilution plates and dispense 20 μL into column 2. Subsequently, 10 μL of compound is placed into column 3 and mixed twice followed by a blowout, tip touch and re-establishment of an air gap. The three-fold serial dilution is continued by aspirating 10 μL from column 3 and repeating the process in column 4. This process is repeated through column 11 and the final 10 μL is placed into waste leaving columns 2#x2013;11 with 20 μL of sample.
FOUR-PARAMETER FIT FOR DOSE-INHIBITION PROFILES
Dose-inhibition profiles for each compound are characterized by fitting the data to a four-parameter equation using an Excel based fitting program (RAB_CALC) we developed. The apparent inhibition constant (
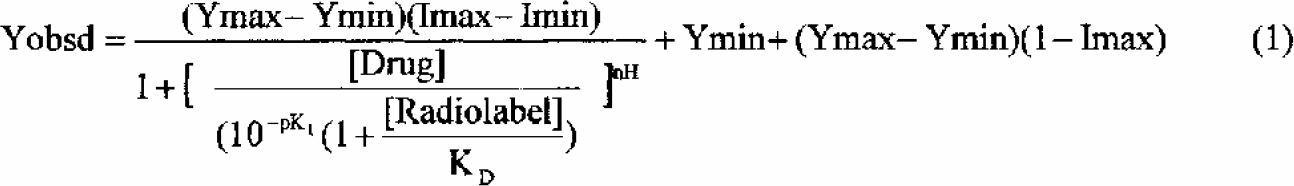
The average signal of the “0% inhibition controls” (Ymax) and the average signal of the “100% inhibition controls” (Ymin) are constants in equation 1 that are determined from the controls located in columns 1 and 12 of the assay plate. For radioligand binding experiments, the concentration of radioligand in equation 1 ([Radiolabel]) is calculated for each run based on the ligand specific radioactivity and the measured CPM of an aliquot of the assay solution. The apparent dissociation constant of the radioligand for its receptor (KD) in equation 1 is determined by a hot saturation experiment (2, 3, 4). Typical weights are 1/Y (for radioligand assays), or 1/Y 2 (for constant % uncertainty) and 1 (unweighted for constant absolute uncertainty). The raw experimental observation is always fit and not the normalized data. The pKI value and the other fitted parameters (Imax, Imin and nH) are varied using Excel's Solver Add-In to minimize the weighted sum of the square of the deviation of each observed data point from the calculated curve.
For non-radioligand binding experiments, equation 1 is simplified by setting the [Radiolabel] equal to 0. This removes the Cheng-Prusoff shift for a competitive inhibitor and an apparent IC50 value is reported rather than a KI value. This IC50 value, which is essentially the inflection point of the 4-parameter fit, is equal to the concentration of drug that gives 50% of the maximal inhibition that this compound can produce. It is not the same as the x value that gives you 50% of the “100% inhibition control” unless the high and low plateaus with this compound happen to match that of the controls on the plate.
COMPUTER-DIRECTED AUTOMATIC DATA ANALYSIS
We have developed an “Expert System for Data Analysis” that allows the computer to automatically perform the analysis of the data, much like an expert scientist. Our system provides the computer with a set of rules that teaches it how to analyze the data. The rules are coded directly in an Excel template used by the RAB_Calc application (see above) to fit the data. One typical rule is to mask any control point that is more than “x” standard deviations from the mean. The Excel template simply calculates the standard deviation for all control points and also calculates an average using only those points that are within the desired range. These average control values are then used in calculating the % inhibition at each dose.
Other rules are implemented to recognize certain patterns. For example, a “bell-shaped” pattern is commonly seen in radioligand binding experiments. This solubility artifact results in an apparent loss of inhibition as the dose is increased to the highest concentrations. The Excel template automatically “masks” the high dose data point(s) whenever the % inhibition of a higher dose point minus the next lower dose point is less than −10%. If the point is in the 15% to 85% inhibition range it is also masked whenever this difference is less than 5%. The values used for detecting this patterns (e.g. −10%, 15%, 85%, and 5% numbers above) are stored in a database and are settable, if desired, on an assay by assay basis. Additionally, whenever a “bell-shaped” pattern is detected, a comment (e.g. “BELL”) is also automatically added to the graph and is listed in the comments associated with the fit results for that particular compound.
In fitting each dose-inhibition curve, the computer automatically fixes Imax = 1, or Imin = 0, or nH = 1 when warranted. Imax is fixed at 1 when no bottom plateau is detected by the computer. The Excel template recommends fixing the bottom plateau whenever the average % inhibitions of the highest three included doses is less than 80%. The top plateau (Imin = 0) is fixed whenever the average % inhibition of the lowest three doses is less than 20%. The Hill slope (nH = 1) is fixed unless the average % inhibition of the highest three included doses is greater than 50% and the average % inhibition of the lowest three doses is less than 50%. These recommendations for fixing the values of Imax, Imin, or nH, as well as recommendations for masking points (see above), are enforced using VBA code the first time that data is analyzed by the system. During review of the data, the scientist is free to override the computers suggestions. In this way, “If Then” logic (used in the Excel template or programed with VBA) encodes the rules that allow the computer to put up FLAGS or take corrective action whenever any potential problems or patterns are detected.
ILLUSTRATIVE RADIOLIGAND BINDING ASSAY
Stock rat brain membranes (Stripped Rat brain, #56005#x2013;2, Pel-Freez Biologicals, Rogers, AR 72757) are stored at ∼10 grams wet weight per 100 ml. Preparation of membranes, buffers, and ligand ([ 3 H]-Prazosin) is as described in O'Malley 1998. 1 The Tecan liquid handling system will place into an incubation plate: 20 μL of DMSO into columns 3#x2013;11, 20 μL of DMSO into the top four wella of columns 1 and 12 (total binding), and 20 μL of 500 μM Phentolamine (non-specific binding, final concentration of NSB is 10 μM) into the bottom four wells of column 1 and 12 (Figure 4). The Tecan performs three-fold dilutions across the plate using 10 μM cold Prazosin. Once the dilutions are complete, membranes (alpha 1a receptors) and hot ligand are added.
For a 1 mL incubation 920 μL of the membranes are needed (final of 0.17 grams wet weight per 100 ml). The membranes are placed into a beaker and the [ 3 H]-Prazosin is placed into a trough and the Gemini program adds the membranes first followed by multi-dispensing of 60 μL of [ 3 H]-Prazosin. The assay mixtures are then incubated for 3 hr at room temperature, on a shaker. Next, the membranes are harvested using the Packard unifilter-96 or the dual 96 well Brandel Cell Harvester. GF/B filter plates, pre-soaked in 0.05% Polyethylenimine (PEI, Sigma #P3143) at pH 7, are used to collect labeled membrane receptors from the incubations. Each incubation plate is washed 10 times with 1 mL of cold wash buffer per well (20 mM Na HEPES pH 7.4). Following the wash, the plates are dried for 2 to 3 hr under vacuum at 37 °C. Fifty μL of Microscint 20 is added per well and the plates are sealed and counted on the TopCount. The KI values were determined as described above using a KD = 0.18 nM of the radiolabel [ 3 H]-Prazosin and a nominal [Radiolabel] = 0.4 nM.
DETERMINING PRECISION AND ACCURACY OF SERIAL DILUTIONS IN DMSO
An absorbance and fluorescence method was developed to assess the precision and accuracy of serial dilutions in DMSO. A 20 mM DMSO solution of the fluorescein sodium salt (F6377, Sigma St. Louis, MO 63178) is used to evaluate all 10-points of the 3-fold serial dilutions (ε490 ∼35,600 M−1 cm−1 @ pH 7.4). The Tecan performs serial dilutions of this stock dye directly in either v-bottom or conical bottom microtiter plates. Four plates are prepared by the Tecan and “gold standard” plates are prepared manually. The manual plates (20 μL per well final) are prepared using larger three-fold dilutions of the exact same stock dye solution (e.g. 200 μL to 600 μL final). Separately, the stock dye solution is diluted 35-fold and 39-fold in DMSO to prepare quality control dye solutions. Twenty microliters (20 μL) of these quality control dye solutions are placed into columns 1 and 12 of each plate. The quality control solutions are routinely used to independently verify the “apparent accuracy” of the 5th and 9th dilution of the “gold standard” plate.
Buffer (250 μL of 20 mM Na HEPES, 150 mM NaCl pH 7.4) is added to every well of the plates. Replica plates are then prepared by transferring 200 μL of sample into a flat bottom Fluorescent/UV plate (Costar #3615, Corning Inc., NY 14831). The absorbance spectra of all plates are recorded every 1 nm in the range from 480#x2013;520 nm. The fluorescence was recorded at the emission wavelength 520 nm with three different excitation wavelengths 485, 460 and 440 nm. The relative concentration for each well on the Tecan plates were obtained by dividing each absorbance or fluorescence reading by the corresponding average value obtained from the “gold standard” plates. A special Excel workbook was designed to process the absorbance and fluorescence data to ensure that the values used in determining the relative dye concentration fall in a linear range of signal response to concentration. Absorbance data was typically in the linear range for columns 2#x2013;6 and the fluorescent data was found to be linear for columns 7#x2013;11 when starting with 20 mM fluorescein dye. In this way, relative concentrations were obtained for every well on the plate.
The standard deviation of the relative concentration values from the test plates provide a measure of the precision at each one of the serial dilutions performed by the Tecan. Any value of a relative concentration other than 1.0 indicates an “inaccuracy” relative to the average value of the “gold standard”. The Excel workbook is used to provide all statistics and graphical displays of the data.
The accuracy of the “gold standard” plate is critically dependent on the accurate pipetting of 20 μL of DMSO solutions and to a lesser extent 250 μL of buffer. To verify this, 0.8 nM of dye solution was diluted in buffer at a 100-fold larger scale (i.e., 2.00 mL and 25.00 mL where accuracy is not a serious concern), as well as on the typical scale (i.e. 20 μL and 250 μL). A flat bottom plate was filled with 200 μL of these solutions and the absorbance at 490 nn was measured. The ratio of the average absorbance of these two types of solutions yields a measure of the fold inaccuracy to be expected in the “gold standard” plate, resulting from its reliance on the 20 μL and 250 μL pipetting steps. The accuracy of the “gold standard” plate is also dependent on the accuracy of the serial dilutions that were manually performed using 200 μL and 400 μL pipetting operations. The ratio of the average values obtained from the quality control dye solutions (35- and 39fold dilutions) that are placed on every plate with the average value obtained for column 7 or column 11 on the “gold standard” plates provide a measure on the fold inaccuracy of the serial dilutions in col 7 and 11. The degree of certainty in the accuracy of the quality control plate can be judged by a critical evaluation of these ratios.
Results
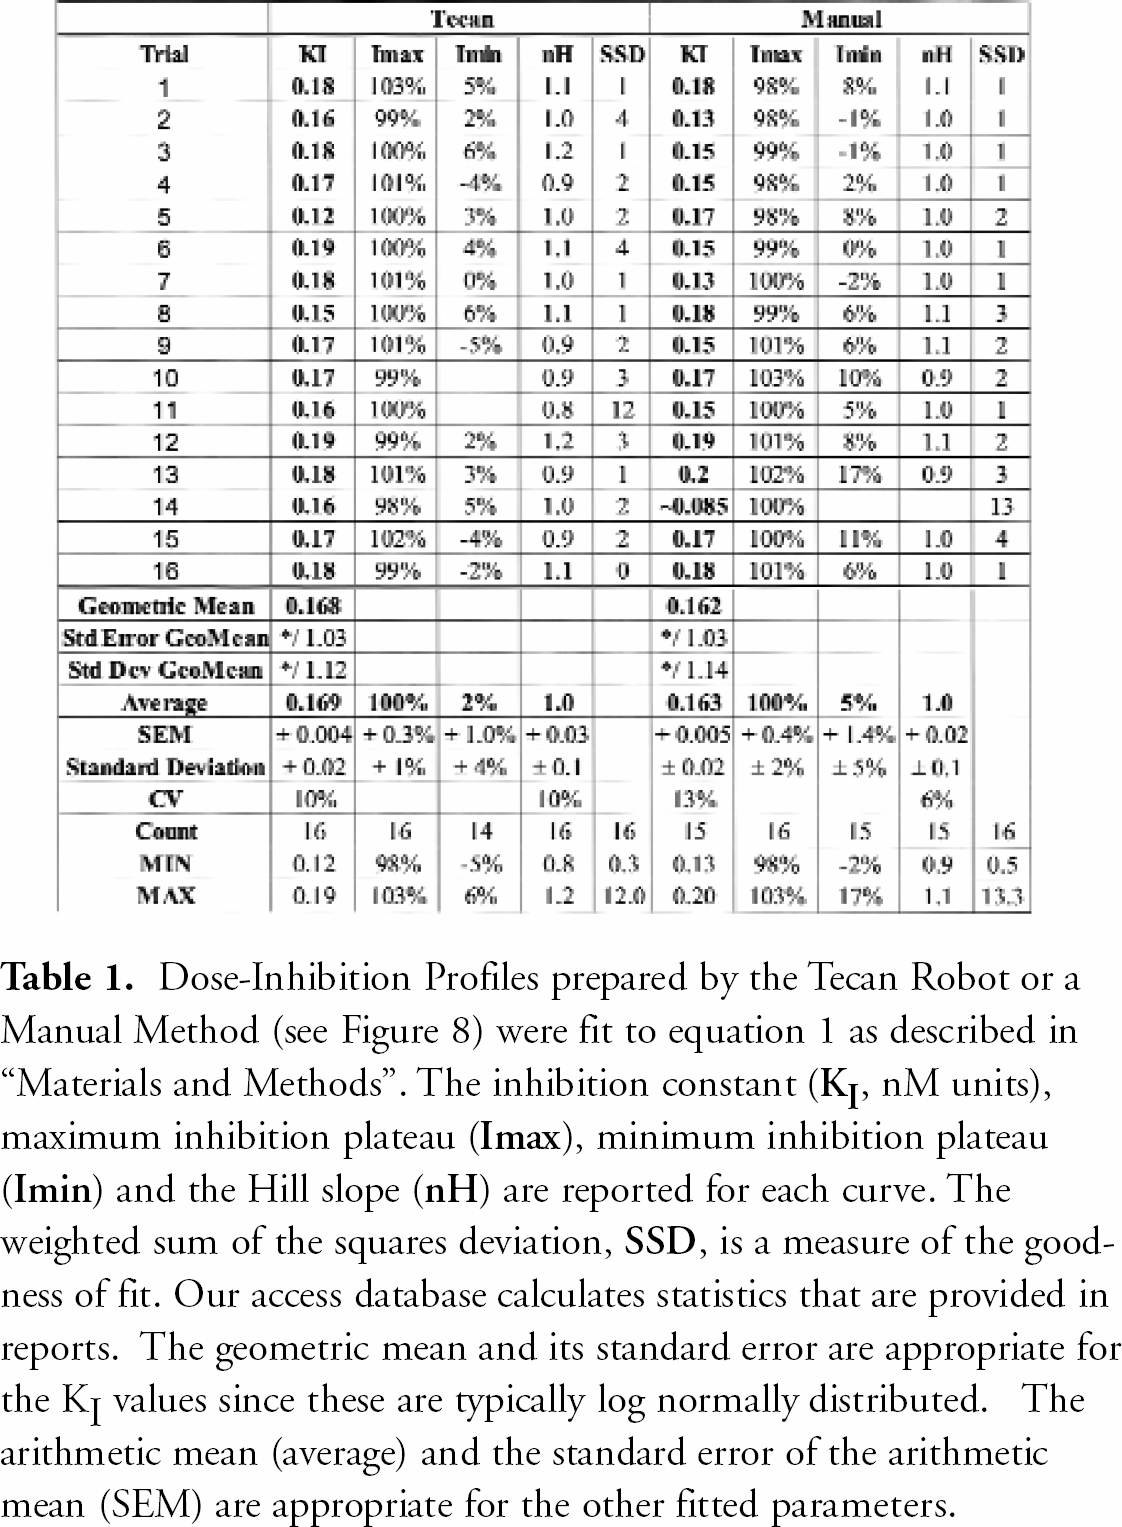
A radioligand binding assay was performed to test the ability of the integrated software system and robotics to perform ten-point dose-inhibition profiles. Two dilution methods were used, one was done by the Tecan and the other was performed manually. Once the compounds were serially diluted across an incubation plate (Figure 4), membranes and radioligand were added. Figure 8 shows ten-point titration curves obtained using both methods and the four-parameter fit of the data using equation 1. The figure also displays the observed CPM values for the negative controls (total binding) and the positive controls (non-specific binding). The titration curves in Figure 8 and results from another 30 measurements (Table 1) indicate that the Tecan robotic system produces results that are, within experimental error, identical to the data obtained using the “standard” (manual) procedures.
Dose-Inhibition Profiles prepared by the Tecan Robot or a Manual Method (see Figure 8) were fit to equation 1 as described in “Materials and Methods”. The inhibition constant (
To critically evaluate the ability of the Tecan system to perform serial dilutions in small volumes, a DMSO soluble dye method was developed that allowed monitoring of the precision and accuracy of each point in the serial dilution (see “Materials and Methods”). The absorbance and fluorescence readings from plates made by the Tecan were divided by the appropriate readings from manually prepared “gold standard” plates to yield the relative concentrations shown in Figure 9. A relative concentration value of 1.0 indicates that the Tecan has pipetted the same concentrations as the “gold standard” method and suggests ∼100% accuracy in that well. A value 1.2 indicates that a 20% higher concentration was pipetted by the Tecan. Likewise, the value 0.8 reveals that the Tecan pipetted 20% less than the “gold standard” method.
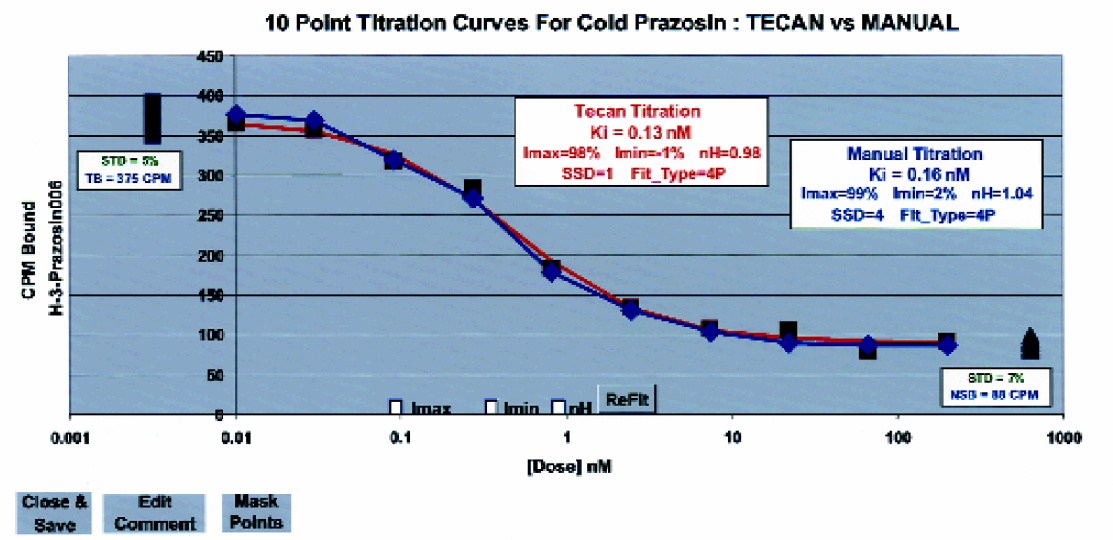
A dose-inhibition profile prepared by the Tecan robot is compared to a manually prepared curve. The binding of [3H]-prazosin, as a function of added cold prazosin, to rat cerebral cortex membranes was determined and fit as described in “Materials and Methods”. This figure also illustrates some of the features of our graphical user-interface that is used to review dose-inhibition profiles. Data are plotted in raw instrument units against the dose. Total binding (
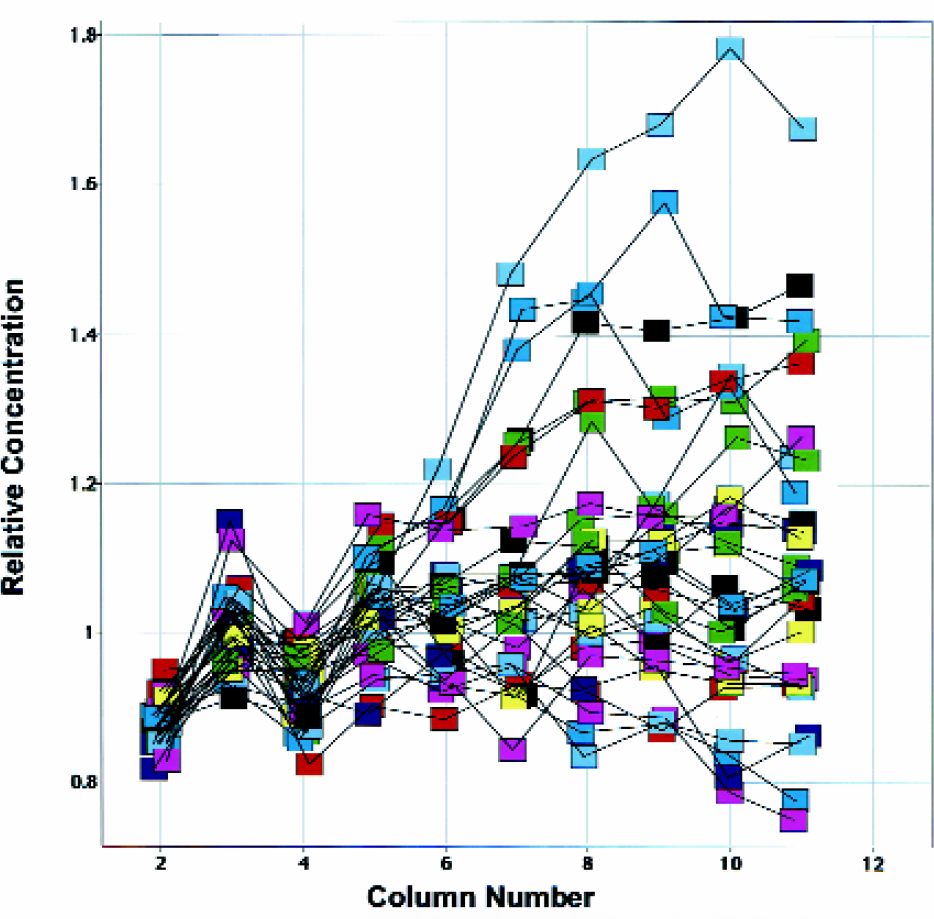
Relative concentrations, compared to a “gold standard”, for each titration point were determined using a combination of absorbance and fluorescence measurements as described in “Materials and Methods”. Each unique color represents one of the eight Tecan tips. Each set of 10 connected points represent the three-fold dilutions (done here on a 20 μL scale) that were started in column 2 and ended in column 11. Four separate titration curves were performed with each tip. A relative concentration value of 1.0 indicates that the Tecan was 100% accurate in that well; a value 1.2 indicates 20% too much drug was delivered by the Tecan.
The variability (“imprecision”) introduced by the actual spectroscopic measurements was assessed and found not be significant (>1% CV). Further, the uncertainty in the accuracy of the average values obtained from the “gold standard” plates was also evaluated as described in “Materials and Methods” and judged to be less than 4%. Therefore, neither of these uncertainties significantly limits the utility of “relative concentrations” in evaluating the precision or the accuracy of the serial dilutions performed in DMSO.
The relative concentrations shown in Figure 9 make it easy to identify specific trends in the Tecan's ability to do serial dilutions across a plate. Each tip of the Tecan is given a unique color. Typically, the concentration delivered is within 20% of the desired concentration. As one examines the dilutions across the plate, a trend for the Tecan to pipette a concentration that is higher than the expected is sometimes seen. The data in Figure 9 makes it clear that any propagation of an error across a plate, can easily be detected by the rise in the relative concentration to a value much greater than the expected value of 1.
Graphical review of relative concentrations (e.g. Figure 9) makes it relatively easy to obtain a clear picture of the accuracy and precisions of the serial dilutions performed (by the Tecan or any other liquid handling system) in DMSO. This information facilitates the optimization of the Tecan Liquid Classes and helps to verify that the serial dilution program is working within an expected error range. It also allows one to assess how well each tip pipettes and if a tip may be performing poorly. Our desired goal is to have the Tecan pipetting within 20% of the “gold standard”.
Discussion
Our results demonstrate that the integrated software robotic system can generate dose-inhibition curves that are of a very similar quality to those performed manually (Figure 8). Sixty six percent of the time, a single KI value determined by the Tecan robotic system would be expected to be within a factor of 1.12 of the “true value“, based on the standard deviation of the geometric mean shown in Table 1. At the 90% confidence limit, a single determination should be within a factor of 1.25 of the “geometric mean value” that would be obtained following a large number of measurements. In supporting drug discovery, we typically obtain two independent determinations in duplicate runs that are performed using different Tecan tips and separate preparations of other assay reagents. The degree of agreement of these values provides a continuous check on the operations of the entire system and also provides Chemists with information on the degree of confidence to assign to any particular result. When necessary, greater confidence that the geometric mean is closer to the “true value” can be obtained by performing a larger number of independent measurements. For example, the standard error of the geometric mean in Table 1 is reduced to 1.03 (i.e. ∼3%) by the increased number of determinations.
Our system was designed to meet the challenges of rapidly producing and disseminating high quality interpretations of dose-inhibition profiles while minimizing manual handling and data processing. One of the keys to accomplishing the rapid production of dose-inhibition profiles is the sample receipt, inventory, and assay scheduling process. This process gives the scientist the ability to schedule compounds for testing and or re-testing in supporting Medicinal Chemistry SAR. Historically the biologist was responsible for taking the solid compound from the chemist and making a solution. The chemists would give a sheet with the structure and pertinent information about the compound, such as the sample identifier and formula weight. Next, the biologist would spend a significant amount of time making up solutions and entering necessary information into an Excel file so the assay could be run and data analyzed at a later time. During this process, one had to keep track of many different vials, tubes, and reagents, making the whole process highly prone to error. Here we have streamlined this by having chemists submit barcoded solutions of compound. With the use of the PosID barcode scanner on the Tecan, we are able to load source plates with compounds, and automatically inventory and schedule the compounds into assays as seen in Figure 2. Having knowledge of where each compound is found in the source plate gives the biologist the ability to selectively access any compound at any time. With this feature, our system could have 6 source plates on the deck at one time (Figure 5), thus allowing the scientist to cherry pick from up to 576 different compounds.
In the process of loading solutions into the source plate, the Tecan has the ability to liquid-level detect. Once the solution has been added to the source plate, the volume of the liquid is detected and registered into the database. Figure 3 shows the importance of knowing the volumes of the solutions in the source plates. When one places a certain compound into an assay run, the volume for that compound will automatically appear. If the volume is below a specified volume range, an orange warning indicator will be seen (Figure 3). This alerts the scientist that there may not be enough volume to run the desired assay, a feature that helps reduce needless errors.
The system has been designed to be expandable. Many different types of in vitro assays can be run. We have the ability to add new assay protocols or add to and modify existing protocols at any time. Once the assay protocol is in the database, all relevant information that is needed to run the assay is accessed on demand. An assay is easily prepared using the run layout sheet (Figure 3). The run number and barcodes for the incubation plates are automatically assigned when the run is submitted. Now, the Tecan can access this information and run the assay or a series of assays in an unattended session.
Another feature of our system is the ability of the software to critically analyze dose-inhibition profiles. The analysis software is fully integrated with the database and automatically retrieves instrument data. A run number provides all the necessary information for the software to process all the data associated with a particular run. By just pressing the “Analyze Run” button (Figure 6), all the data is automatically retrieved and calculated. Based on pattern recognition and rules, the software fixes the value of parameters that cannot be determined from the available data and it can automatically mask points. Figure 10 shows examples of how the software can fix these parameters in order to properly fit the data. When the data is not sufficient for precise determination of a KI value, the system automatically adds qualifiers based on the highest and lowest valid dose tested and the standard deviation of the controls. For example, the system will add the > qualifier to indicate that the dose inhibition profile suggests that the KI is greater than or approximately equal to the reported value. The < qualifier is interpreted to mean less than or approximately equal to the reported value. A ∼ qualifier, meaning approximately equal to, is used to clearly indicate a higher degree of uncertainty in a particular KI value. The software automatically adds comments such as “BELL” (i.e. “bell-shaped”) for dose-inhibition profiles that show progressively less inhibition at the highest drug concentrations, or “Retest [Higher]” for retesting at a higher starting dose. Following a fit of the dose-inhibition profile data to equation 1, all parameters are reported when the quality of the data allows their estimation (e.g. see Table 1).
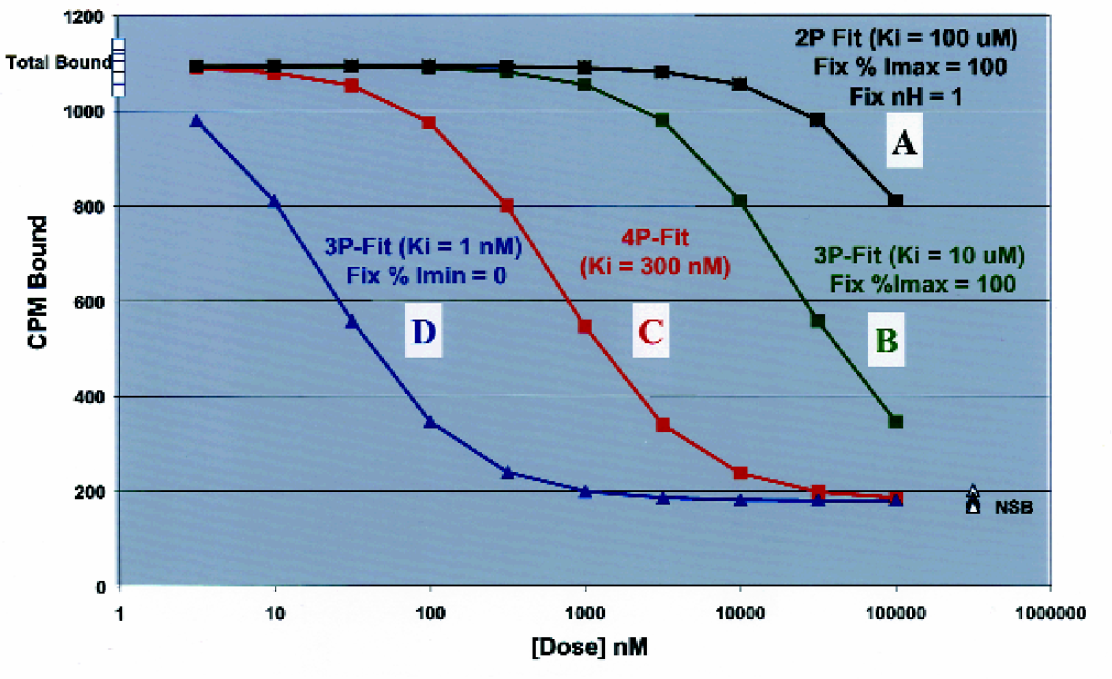
Our “Expert System for Data Analysis” allows the computer to automate many of the data analysis processes that would normally be performed by an experienced senior scientist. For example, based on some of the simple patterns seen in these illustrated dose-inhibition profiles the computer fixes parameters in the non-linear least square fit of the data to equation 1. (
Following the analysis process, the “Review Run” button provides graphs (overlaid and individual) of the data. Real values of data points and controls are visible on every plot and fitted parameters are also shown (Figure 8). It is easy for an operator to (un)mask points and (un)fix any parameter prior to a quick recalculation (see the macro buttons or check boxes in Figure 8). All of these unique features (pattern recognition, macro buttons, and check boxes) aid the scientist to rapidly produce and report reliable data along with as much value added information as possible.
To aid in report generation, the compounds are designated to specific projects. We have experience with supporting up to six projects simultaneously. In order to be able to distinguish samples for each unique project, we have designed a method that assigns a project name to each individual compound; this occurs during the scanning and uploading of compounds to the source plate as stated above. Figure 2 illustrates the load data sheet that appears during the scanning and uploading function. The project name will then follow this compound as it is tested, analyzed and finally data will be reported to all members of the project team. Each report will only include data for the compounds that the specific project submitted. This has greatly enhanced the speed, timeliness and order to which data is disseminated.
We also designed the system to allow for the maximum workflow with the desire to run the system unattended (reagents supplied as needed). We often test up to 288 compounds a day, which is equivalent to four runs that include 9 incubation plates per run. When a run is completed the RoMa arm is called to remove the finished incubation plates from the deck and store them in the Carousel. Once the first run's incubation plates have been removed, the next set of 9 new incubation plates can be brought down from the Carousel and placed on the deck. This process is repeated until all runs have been completed.
This system has also been incorporated into a workflow that prepares dilution plates for functional assays that are being run within our department. Because our lab runs primary and secondary assays for many different projects, we have a large supply of source plates. These source plates can now be randomly accessed and used to make dilution plates for those who desire their compounds to be tested in various functional assays. The dilution plate will end up containing 20 μL per well of the serially diluted compound. In order to produce these dilution plates, the scientist must submit a request for compounds they desire to test, the desired starting concentration and the Solution_ID which describes the location of the compound in the source plate. The compounds are then serially diluted in a standard 96 well plate, sealed and given to the requester.
Conclusion
In summary, we have presented aspects of our system that have enhanced our capacity to successfully support drug discovery programs. The developed software package combined with the Tecan robotics has improved the laboratory's ability to rapidly identify and optimize drug candidates. This system was specifically designed to place our labs on the cutting edge of innovation and to achieve operational excellence. Our objective was to run various in vitro assays that would need very little human intervention and at the same time minimize the risks of errors that are accompanied with traditional manual methods. The basic workflow of our system was illustrated in this paper to reveal the added benefits of having an integrated software-robotic system.
The strength of this system is the ability to concurrently inventory and schedule compounds into various assays. Once one has the compounds registered and loaded into source plates, the running of assays can easily be done by a touch of the finger. We have configured macros into the front page (Figure 6) of our software package that allows Visual Basic to connect our Database (Tecan_db Database), Excel worksheets (Figures 2, 3 and 7) and the Tecan Genesis Software.
Once the assays are run, the analysis of data is performed automatically. We have incorporated some intelligence into the software that analyzes the data so that it can adjust the type of fit, add comments and automatically mask points. The software can be fine tuned and trained as the scientist becomes more familiar with the nuances of the data generated by specific assays being run. The review of the analyzed data has been streamlined so that one can view the individual graphs for each compound tested. Most changes can easily be made directly from the graph (Figure 8). Additionally, reports are generated and sent to the project teams and data is uploaded into the corporate database.
The total system that has been developed has proven to be the work horse for our drug discovery efforts. The system continues to be improved upon, always with the desire to enhance the rapid production and dissemination of high quality data. Our department is now able to support over five drug discovery programs with routine dose-titration assays with minimal personnel. We would not be able to support this many programs if it was not for the totally integrated system. The joining of the software, databases and the robotics has proven to be a key to rapidly identifying novel chemical entities for the market place.
Acknowledgments
The authors thank Richard Carpenter (Tecan-US) for freely sharing his expertise on the Tecan Genesis Workstation and Suvas Pandya for his assistance in developing a programming interface between Excel and Access. We also thank Drs. Stefanie Kane and Michael Schaber for their critical review of this manuscript.