Abstract
Serial dilution of compounds solubilized in dimethylsulfoxide (DMSO) for dose–response curves is a common method for efficacy analysis of potential drug candidates. In general, serial dilution methods are particularly prone to error propagation because each dilution is dependent on the previous concentration. Moreover, assumptions about quality control parameters (i.e., dye linearity) can lead to an erroneous process. Here, an inline performance measurement is sought to improve the precision and accuracy of dilution plates. Sulforhodamine 101 (S101) dye is introduced as the quantitative fluorometric method of choice for DMSO-based systems. Although S101 in DMSO behaves in a nonlinear fashion over its detectable range, we account for this with a direct calibration method that includes every point of the dilution template. This report contains dye selection rationale for the S101 dye and its use in quantifying the performance of 96- and 384-well dilution protocols as tested on five identical instruments.
Keywords
Introduction
Dose–response curves are commonly used in pharmacology research to measure the potency of drug-like compounds and proteins. Following primary high-throughput screens, IC50 and EC50 values are determined from screening compounds of interest in 96- or 384-well dose–response plates. Dose–response plates are traditionally made as serial dilutions where each column's concentration is diluted from the previous, higher concentration by a dilution factor. A serial dilution template describes the dilution factor, number of dilution points, and final volume. A wide variety of serial dilution templates exist.
It is a widely adopted best practice to routinely perform quality control (QC) methods on liquid-handling instruments used in research. 1 –3 The results are useful in predicting expected performance and prescribing maintenance. In the case of serial dilution devices, data quality is related to the quality of the liquid handling. Although a liquid handler passes single dispense QC criteria, it may still affect serial dilution quality through dispense, mixing, and carryover errors. To examine serial dilution quality, performance criteria and a precise measurement method are necessary. Serial dilution quality requirements have been previously established. 4 Our high-throughput screening (HTS) group wanted to improve IC50 data quality by increasing the number of dilution points. The compound management group wanted to reduce compound consumption with the use of low-volume dilution templates. The result of these trends was to develop a 2 to 1, 22-point, dilution template for primary screening. Because of the extended dilution range (1:2000000), the template has been a challenge to implement. Now, a step-in QC method is desired to measure the accuracy and precision of dilution plates run inline with the process under optimization.
An important consideration for the calibration of liquid-handling devices is the selection of an appropriate dye and solvent system. Small molecule compounds associated with HTS libraries are typically solubilized in the organic solvent dimethylsulfoxide (DMSO). 5 Fluorescein has been shown to quench in DMSO concentrations greater than 1%, making it incompatible with DMSO-based diluent systems. 6,7 Although nonfluorescent dyes have been effective at quantifying dilution performance, absorbance methods in general are limited to a 1:2000 dilution range. 8
Sulforhodamine 101 (S101) is an appropriate indicator for DMSO-based diluent systems. The use of S101 in DMSO has been reported. 9 S101 as a solid is photo stable, highly soluble in DMSO, and has a high molecular extinction coefficient. 10 In solution, the dye does not exhibit abnormal behaviors associated with aggregate formation. 11 –13 S101 has been used regularly within our compound management and HTS areas to evaluate disposable and fixed-tip liquid handlers. Additionally, S101 has been effectively used to quantify nanoliter scale volume transfers from pin tools; noncontact dispensers; and tip washing, carryover, and mixing evaluations. 14
Unlike previously established serial dilution criteria, column accuracy is determined directly from reader counts as compared with a calibration plate. The calibration plate contains every point as the dilution plate and is made up in large volume format. This method has a wide dynamic range, is instrument independent, and applicable to a variety of liquid handlers performing dilutions in DMSO.
Materials and Methods
The method is evaluated on five identical eight-channel, fixed-tip, liquid handlers, using DMSO as the system fluid. These are proprietary instruments based on the XLP 6008 syringe pump (Tecan US, Research Triangle, NC). The syringe pumps are setup with 500-μL syringes and provide a 0.01-μL volume resolution when microstepped. For all serial dilution experiments, 0.1 mM S101 (Sigma Aldrich S7635, St. Louis, MO) in 100% DMSO is generated and substituted directly into the serial dilution process. The test plates require the same start volume and plate type as specified by the protocol under test.
Once the test plate containing S101 dye is serialized, the relative fluorescent units (RFUs) of each well is determined using a Tecan Safire II (Tecan US, Research Triangle, NC) fluorescence reader. As required by the dilution range under test, the plate may be read at two different gain settings (see Appendix for specific reader settings).
For each column of the test plate, precision is determined directly from fluorescent signal. The precision as indicated by the coefficient of variance (CV), is determined by reading all of the wells in a column and calculating the average RFU value, along with the standard deviation. The CV for the column is simply the standard deviation divided by the average value, and converted to percent. Accuracy is also determined for each column of the test plate directly from fluorescence signal.
Accuracy as indicated by percent error is calculated by subtracting the expected value from the average column value, dividing it by the expected value, and converting to percent. When compared with the calibration, a negative percent error value indicates the average concentration is lower than expected, whereas positive values indicate the average concentration is higher than expected.
The calibration plate includes every dilution point as the serial dilution template under test. The calibration is first generated as a large volume serial dilution in 1.5-mL micro-centrifuge tubes. A mix-and-split method is used between each serial transfer after mixing thoroughly on a Genie 2 vortex mixer (Scientific Industries, Inc., Bohemia, NY). The calibration plate is generated by placing the test volume from each microcentrifuge tube into the corresponding well of the calibration plate. Each microcentrifuge tube is used to make a single well, populating a single row of the calibration plate. The mix-and-split serial dilution and calibration plate are made by hand with appropriate single-channel pipettes.
To make the 2 to 1, 22-point calibration plate; 21 × 1.5-mL microcentrifuge tubes were numbered 2 through 22 and filled with 500 μL of DMSO with a single-channel pipette. And, 500 μL of 0.1 mM S101 dye stock was added to tube 2 followed by a 20-s vortex. A mixture of 500 μL was then transferred to the next tube and so on until all 21 tubes were serially generated. The method ended with 1000 μL in tube 22. Note that the first well of the calibration plate was made directly from 0.1 mM S101 dye stock. The 3 to 1, 10-point calibration plate was generated with the same method except each tube is prefilled with 600 μL of DMSO, and a 300 μL transfer volume is used between tubes.
Results and Discussion
The readable range of S101 in 100% DMSO is approximately from 0.05 mM to 0.5 nM. To test the readable range, a 2 to 1, 22-point calibration plate was generated with methods described above. The first half of the calibration plate was read at a gain of 61, whereas the second half was read at a gain of 161. The fluorescence intensity of S101 in 100% DMSO is not linear with concentration over the range as evidenced from the concentration vs intensity log plot shown in Figure 1. At concentrations greater than 0.05 mM (point 2), saturation is occurring in the form of slope inconsistency. Concentrations below 0.5 nM (point 19) are detectable but lie below the quantitation limit of the method.
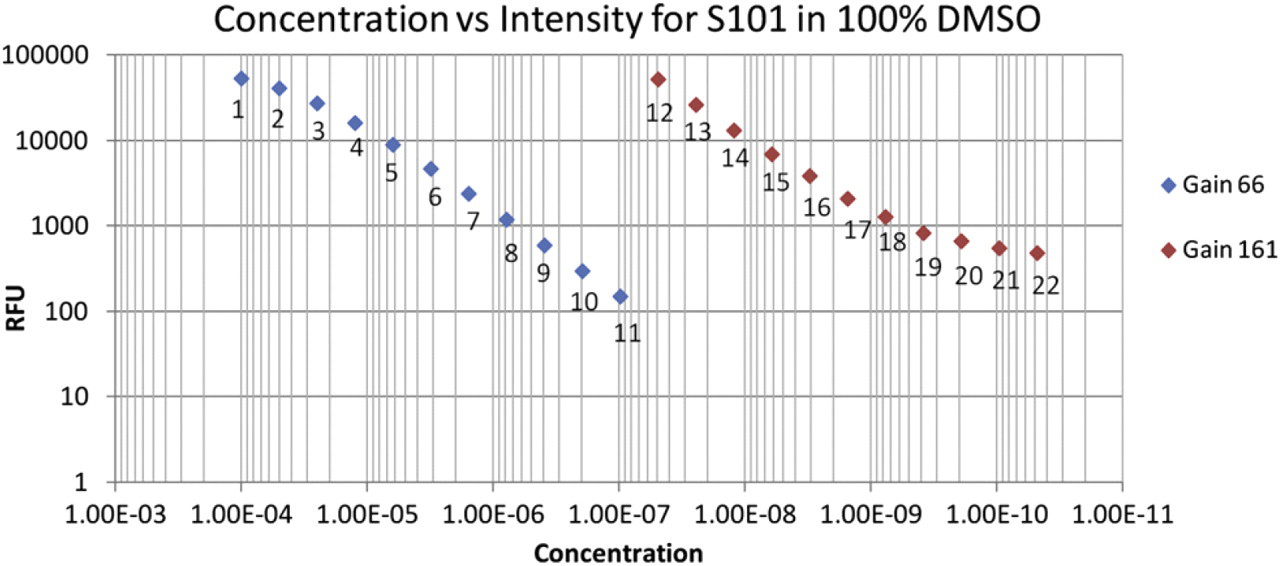
Sulforhodamine 101 (S101) concentration in 100% dimethylsulfoxide (DMSO) vs reader counts. A reader gain setting of 66 is used for points 1–11, and a gain setting of 161 is used for points 12–22.
To accommodate the nonlinear nature of S101 dye in DMSO, an “absolute calibration” method is used where every point of the dilution template is made. The method is sensitive to pipetting and mixing errors, so the dilution is made up as large volumes in 1.5-mL centrifuge tubes and mixed thoroughly by vortexing. Here, percent error is directly determined from measured values instead of being derived from a standard curve.
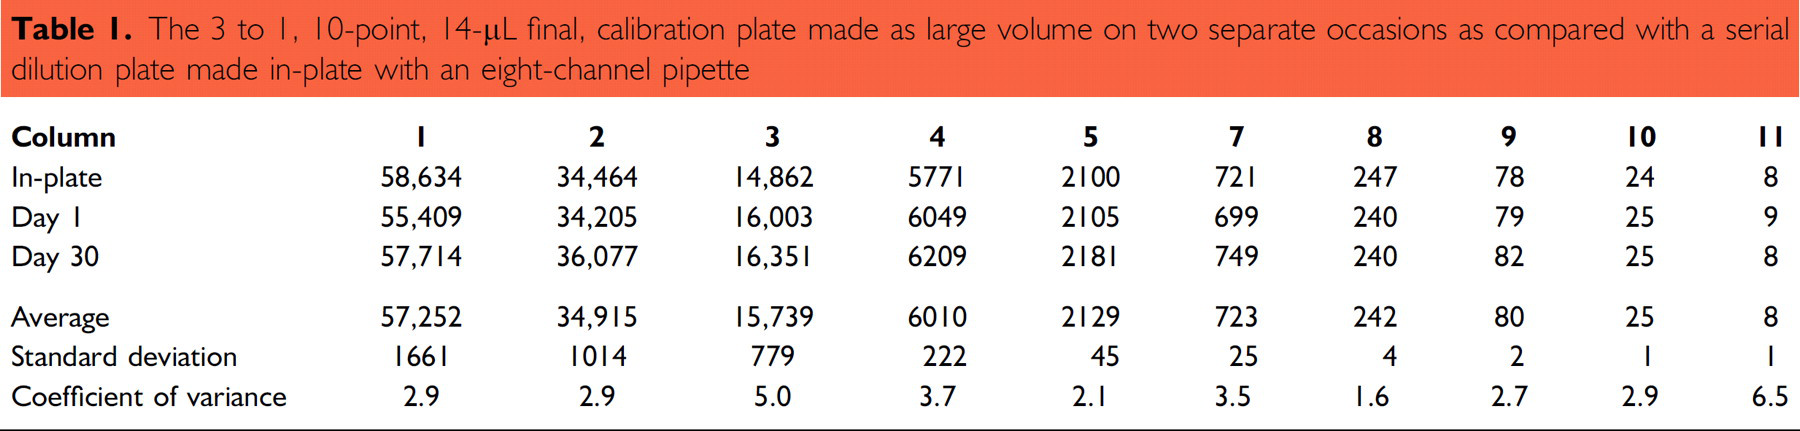
Table 1 compares a serial dilution made with an eight-channel pipette “in-plate” to calibration plates made from large-volume serial dilutions. In Table 1, “Day 1” and “Day 30” represent two 3 to 1 (10-point, 14-μL final) calibration plates generated on separate occasions from the same dye stock. The measured values are within close agreement, as indicated by column CV. Our experience has been that the QC method is reproducible and stable for periods of at least 30 days from a single calibration. Over time, S101 dye stocks photo-degrade and diminish in signal strength. Preventive measures include storing dye stocks wrapped in foil in a dark cabinet.
The 3 to 1, 10-point, 14-μL final, calibration plate made as large volume on two separate occasions as compared with a serial dilution plate made in-plate with an eight-channel pipette
A repeatability test was performed for calibration plates made from large-volume serial dilutions at various time intervals from the same dye stock. Because of the extended dilution range, columns 1–12 and columns 13–22 of the 384-well plate are read at different gain settings. Because both the test plates and the calibration plate are read at the same gain settings, a direct comparison for accuracy is possible. Table 2 tabulates four separate instances, where 2 to 1 (22-point, 20-μL final) calibration plates were generated over a 10-day period. As indicated by column CV, the calibrations are in close agreement with each other. Generation of the 22- point calibration is enabled through the use of centrifuge tubes, vortex mixing, and large-volume transfers.
The 2 to 1, 22-point, 20-μL final, calibration plate is made on four separate occasions over a 10-day period
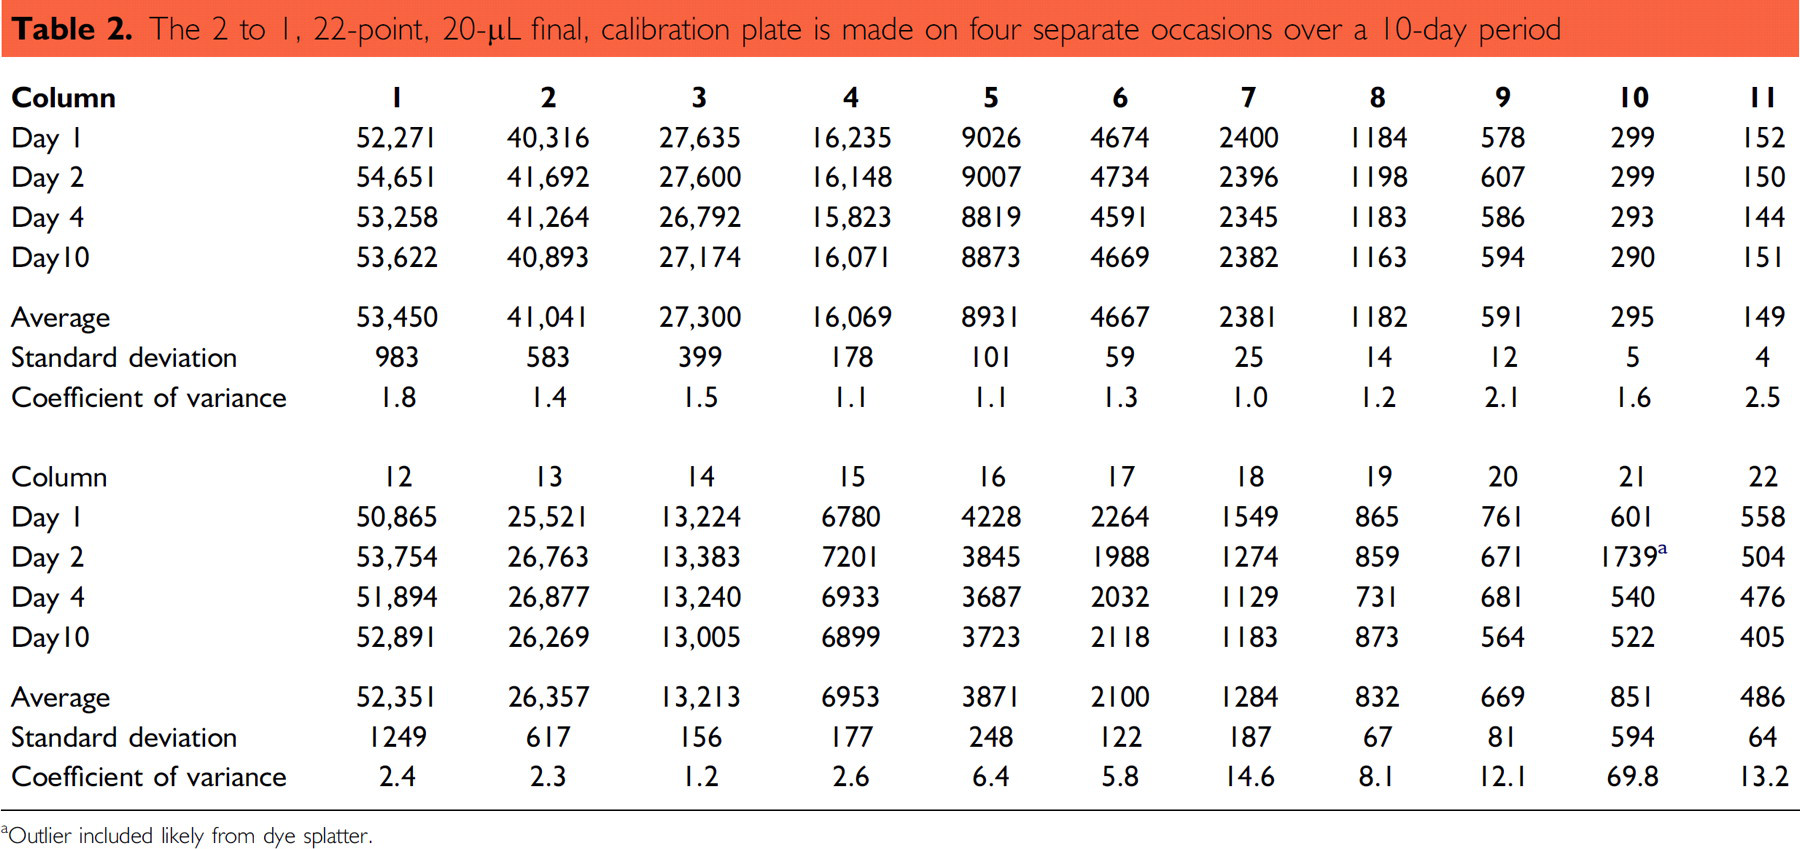
Outlier included likely from dye splatter.
Using the methods introduced above, we have evaluated two serial dilution templates on five separate instruments. The following dilution templates were tested:
96-well, 3 to 1, 10-point, 14-μL final volume, serial dilution protocol.
384-well, 2 to 1, 22-point, 20-μL final volume, serial dilution protocol.
For each protocol under test, five plates were run. The plates were read on the fluorescence reader and analyzed by column for percent error and percent CV. In these experiments, the first two instruments; systems 1 and 2 were evaluated with one batch of S101 dye, and the last three instruments systems 3, 4, and 5 were tested at a later date with a different batch of S101 dye.
Figure 2 shows the percent error by column for five instruments as tested for the 3 to 1 (10-point, 14-μL final volume) dilution protocol. Each point represents the column-wise average of five 96-well test plates (i.e., n = 40). Figure 3 shows the percent CV by column average for each instrument. Each of the devices perform the 3 to 1 (10-point, 14-μL final volume) dilution protocol with minimal variability.
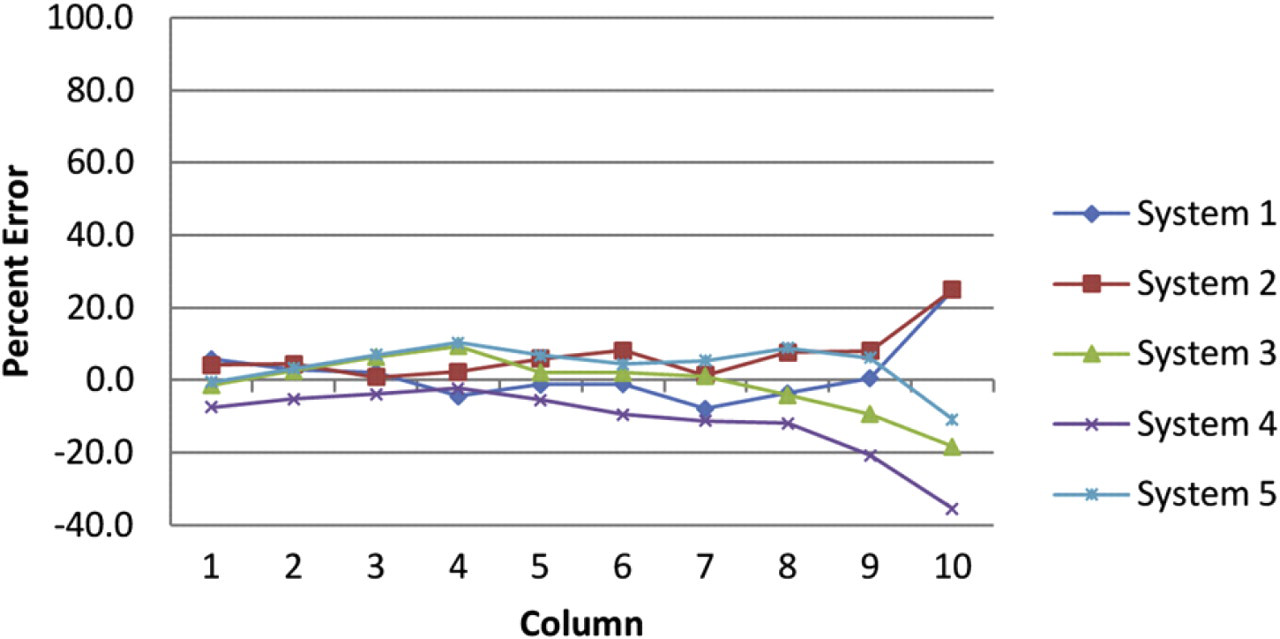
Percent error by column for 3 to 1, 10-point, 14-μL final volume, dilution template as tested on five separate instruments. Each point represents the column-wise average for five 96-well test plates.
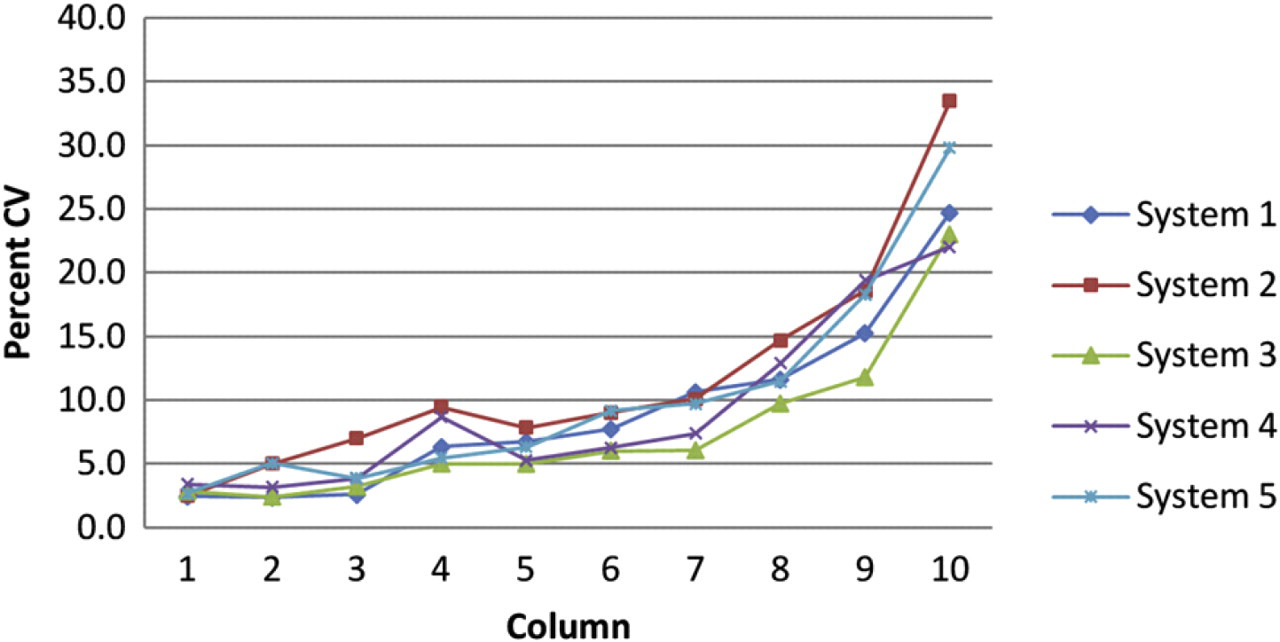
Percent coefficient of variance (CV) by column for 3 to 1, 10-point, 14-μL final volume, dilution template as tested on five separate instruments. Each point represents the column-wise average for five 96-well test plates.
For the 384-well 22-point series, Figure 4 tabulates the percent error by column for five instruments having run the 2 to 1 (22-point, 20-μL final volume) dilution protocol. Each point represents the column-wise average for five 384-well test plates (i.e., n = 80). Referring to Figure 4, it is difficult to distinguish the degree to which the protocol, calibration, or individual devices contribute to the overall error. One inherent advantage of using large dilution factor templates such as the 22-point example is the last points have little effect on the determination of the IC50 value.
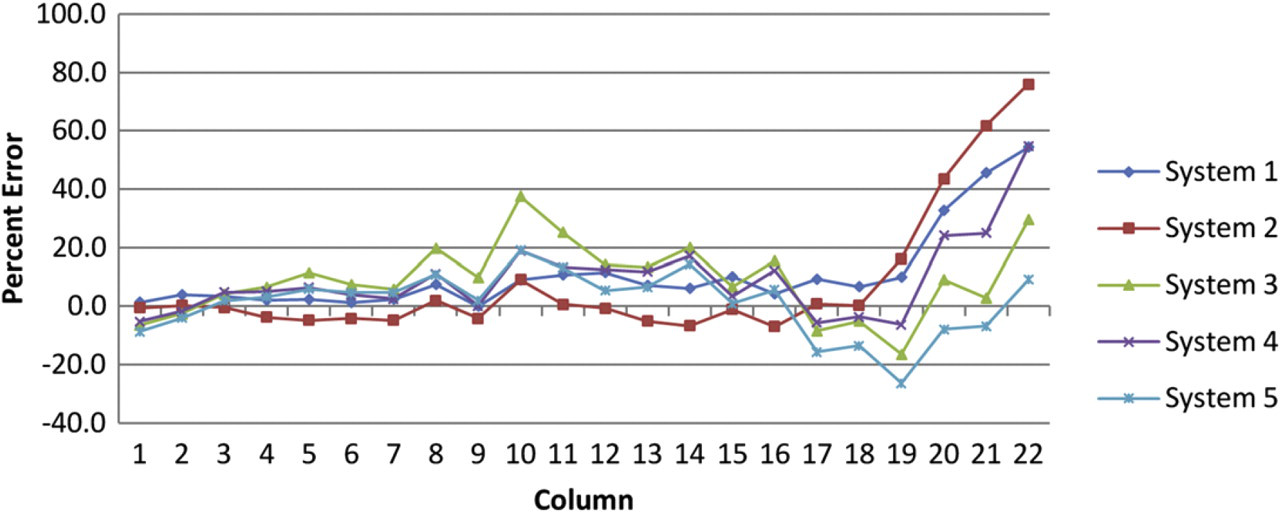
Percent error by column for 2 to 1, 22-point, 20-μL final volume, dilution template as tested on five instruments. Each point represents the column-wise average for five 384-well test plates.
It is possible to see the individual characteristics of the two calibrations used in Figure 4. The first two device series, systems 1 and 2, exhibit smoother-shaped curves that have large error in the most dilute samples. Systems 3, 4, and 5 exhibit a noisier curve that is replicated between devices. The two curve features represent different calibrations and batches of S101 dye from different dates. These visibly distinct curve types show a repeatable trend that appears to be device independent. Clearly, the accuracy of the calibration directly impacts the accuracy of the results. To improve accuracy, we recommend preparing calibrations in large-volume formats. Figure 5 tabulates the percent CV by column average (of five test plates) for each of the five instruments.
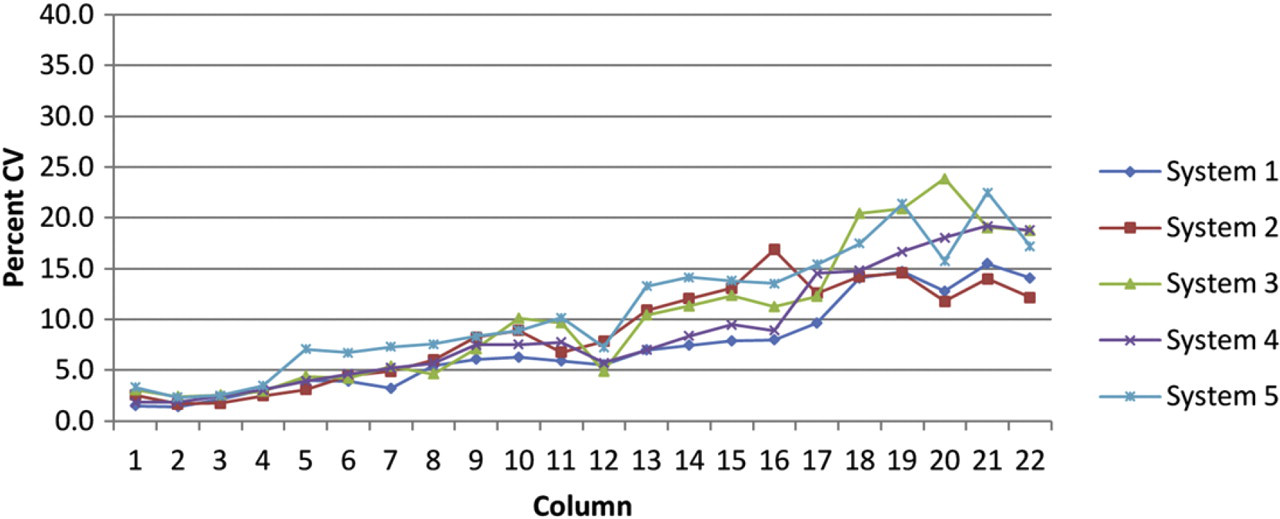
Percent coefficient of variance (CV) by column for 2 to 1, 22-point, 20-μL final volume, dilution template as tested on five instruments. Each point represents the column-wise average for five 384-well test plates.
Conclusion
Presented is a DMSO-based quantitative measurement system for use with dilution ranges up to 107. Dilutions of this magnitude are prone to cumulative error and sensitive to the accuracy of the calibration plate. We have found it beneficial to build calibration plates from large-volume serial dilutions created and mixed in 1.5-mL microcentrifuge tubes. The QC method is reproducible and stable for periods of at least 30 days from a single calibration when stored correctly. Additionally, the tabulation of % error and % CV are comparable across multiple calibrations.
S101 is a robust fluorescent dye and fully compatible with DMSO-based systems. Although S101 fluorescence intensity is not linear over this range, our method of direct calibration that includes every point accounts for this. When determining accuracy, percent error is calculated by comparing the measured values to expected values directly in reader RFU. The S101 calibration method has enabled the development of low-volume serial dilution templates with increased number of dilution points. The serial dilution templates have enabled HTS to obtain higher-quality dose–response data while reducing compound consumption. These techniques may be well suited for testing many aspects of DMSO-based liquid handling.
Acknowledgments
Competing Interests Statement: The authors certify that they have no relevant financial interests in this article, and that all financial and material support for this research and work are clearly identified in the article.
Footnotes
Appendix
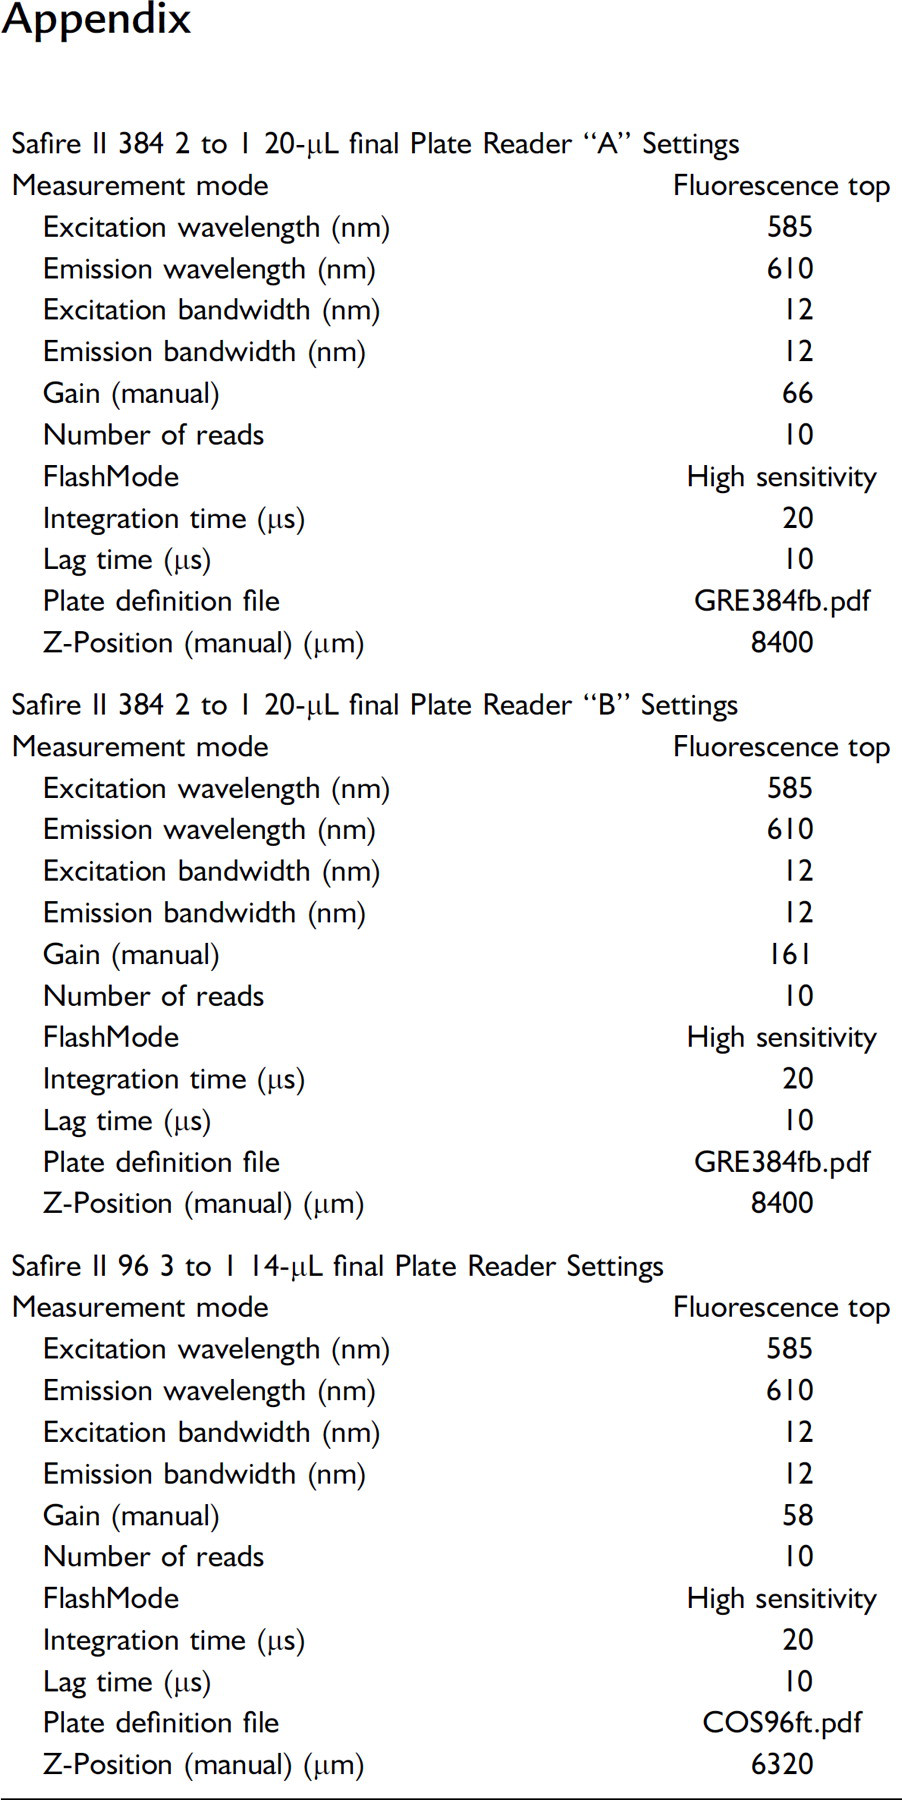
| Safire II 384 2 to 1 20-μL final Plate Reader “A” Settings | |
| Measurement mode | Fluorescence top |
| Excitation wavelength (nm) | 585 |
| Emission wavelength (nm) | 610 |
| Excitation bandwidth (nm) | 12 |
| Emission bandwidth (nm) | 12 |
| Gain (manual) | 66 |
| Number of reads | 10 |
| FlashMode | High sensitivity |
| Integration time (μs) | 20 |
| Lag time (μs) | 10 |
| Plate definition file | GRE384fb.pdf |
| Z-Position (manual) (μm) | 8400 |
| Safire II 384 2 to 1 20-μL final Plate Reader “B” Settings | |
| Measurement mode | Fluorescence top |
| Excitation wavelength (nm) | 585 |
| Emission wavelength (nm) | 610 |
| Excitation bandwidth (nm) | 12 |
| Emission bandwidth (nm) | 12 |
| Gain (manual) | 161 |
| Number of reads | 10 |
| FlashMode | High sensitivity |
| Integration time (μs) | 20 |
| Lag time (μs) | 10 |
| Plate definition file | GRE384fb.pdf |
| Z-Position (manual) (μm) | 8400 |
| Safire II 96 3 to 1 14-μL final Plate Reader Settings | |
| Measurement mode | Fluorescence top |
| Excitation wavelength (nm) | 585 |
| Emission wavelength (nm) | 610 |
| Excitation bandwidth (nm) | 12 |
| Emission bandwidth (nm) | 12 |
| Gain (manual) | 58 |
| Number of reads | 10 |
| FlashMode | High sensitivity |
| Integration time (μs) | 20 |
| Lag time (μs) | 10 |
| Plate definition file | COS96ft.pdf |
| Z-Position (manual) (μm) | 6320 |