
Abstract
Dilution-based volume transfer steps are commonly performed for many types of microtiter plate-based assays. Because the exact concentrations of target samples in solution are typically not directly measured but calculated from the dilution ratio, it is important to accurately measure each dilution step so that the ultimate concentrations of those samples can be known. This paper describes a new approach, which is based on dual-dye, dual-wavelength photometry, for accurately measuring each dilution step in a multistep dilution protocol. The theory behind this method is described, as well as an experimental demonstration of the prescribed approach.
Introduction
Many test procedures carried out in pharmaceutical laboratories require dilution-based volume transfer steps, such as dose response and detection limit testing. For many of these procedures, quantitative measurements are collected and decisions are made based on an assumed, rather than a measured, dilution ratio. Often these assumptions are based on a potentially misplaced trust in the performance of automated liquid delivery equipment, 1 –7 improper assumptions about the starting concentration of reagents, or inadequate understanding of the thoroughness of mixing 7 during the dilution procedure. Accurately knowing the sample concentration at each step of a dilution testing scheme is critical for properly interpreting the experimental results which, in many cases can only be obtained if the experimental dilution ratio is known and controlled at each step of the process. Thus, the ability to accurately measure each dilution step is required for proper assay analysis. Furthermore, understanding the accuracy of each dilution step may be useful in targeting areas within a dilution method that incorporate major sources of variation, which propagate throughout any remaining dilution steps.
Common methods used for testing dilution accuracy often involve absorbance or fluorescence spectroscopy. Gravimetric methods can also be used for accurate dilution testing, but are problematic for use with dilution assays conducted in microtiter plates. Fluorescence methods are typically well known and provide some unique advantages inherent to this spectroscopic format. Because fluorescence measurements are collected against a significantly lower background signal than exists in absorbance measurements, a sensitivity enhancement occurs. 8 , 9 This improved sensitivity often leads to a limit of detection of fluorescent dyes that is 2–3 orders of magnitude lower than for an equivalent absorbance measurement. However, the well-known variability inherent to fluorescent dyes caused by quenching and photobleaching can make an accurate dilution measurement difficult to achieve. By comparison, absorbance measurements typically do not have the degree of sensitivity inherent to fluorescence, but absorbance dyes are often more stable over longer periods of time. Also, absorbance methods can be traced with known certainty to internationally recognized standards, which allows for much easier standardization between methods conducted on different days, or in different labs, or with different lots of dye solutions.
We report on a new absorbance-based method for determining the accuracy of each step in a dilution process. This method entails performing the desired dilution procedure by dispensing one dye solution into a second dye solution, followed by absorbance measurements at two different wavelengths. The measurements provided by this method allow for testing both single- and multiple-point dilutions. Also, for the dye solutions used herein, a testable dilution range of greater than 1:2000 can be achieved. The theoretical basis for this method will be presented in detail as well as an experimental validation of the theory.
Theoretical Dilution Approach
The method for dilution testing described herein requires the use of a series of dye solutions, referred to as either sample or diluent solutions. Multiple sample solutions are used which consist of two dyes with baseline resolved absorbance peaks. 8 , 9 All of the sample solutions contain the same concentration of the first dye, but each contains a different concentration of the second dye. The diluent contains only the first dye, and at the same concentration as in the sample solutions. Thus, the concentration of the second dye is common between all solutions.
Many different absorbance dyes could be used to make the sample and diluent solutions described above. However, the theoretical approach presented herein is described for solutions containing red and blue dyes because a commercially available solution set 6 with the aforementioned characteristics is available, as described in the Materials section. Thus, for the solutions used to demonstrate this new method, sample solutions consist of variable, but known concentrations of a red dye which absorbs light at 520 nm, and a fixed, known concentration of a blue dye which absorbs light at 730 nm, the absorbance peak of each dye being baseline resolved. 8 , 9 The diluent solution contains only the blue dye, but at the same fixed concentration as in the sample solutions.
The dilution approach involves mixing sample and diluent solutions together and measuring the absorbance of both red and blue dyes in the mixed solution. Thus the core mathematical model on which this new approach is based is the Beer–Lambert law, written as

where Aλ is the absorbance of a dye at a specific wavelength λ, ελ is the molar absorptivity of the dye at wavelength λ, l is the pathlength of light through the dye solution, and C is the molar concentration of dye in the solution. To better describe the dilution approach, it becomes convenient to combine the molar absorptivity (ελ ) and concentration (C) terms

where the new term aλ represents the absorbance of the dye solution per unit pathlength at wavelength λ. Substitution of this new term into Eq. 1 gives

The dye solutions used for the dilution method (i.e., sample and diluent) contain known concentrations of both red and blue dyes. Thus, both the diluent and sample solutions can be characterized by the absorbance per pathlength values as expressed in Eq. (2). The absorbance per pathlength of the red dye for each sample solution (a r) and of the blue dye for the diluent solution (a b) are known and given by


Once again, it should be noted that the absorbance spectra of the red and blue dyes do not overlap, but are baseline resolved. 8 , 9 It is also important to recall that the concentration of the blue dye in the sample solutions is equal to the concentration of blue dye in the diluent. Thus, the absorbance per pathlength of the blue dye in all solutions, both sample and diluent, is fixed and can be expressed as a b. In practice, this means that mixtures of any ratio of sample solution to diluent will result in the same concentration of blue dye, but a varying concentration of red dye. This common concentration in both solutions essentially allows the blue dye to be used as an internal standard.
To better illustrate the underlying theory of the dilution approach described herein, a theoretical experiment is used. This “thought” experiment, depicted in Figure 1, involves three microtiter wells. As will be described below, the general procedure involves dispensing a neat sample solution into well 1, then diluting that neat solution into well 2, followed by a dilution into well 3, and beyond. This process results in defined dilution steps of the neat sample solution, located in well 1, across multiple wells. The object of this theoretical experiment is to demonstrate a new approach for calculating the accuracy of each dilution step as compared to a defined target dilution.
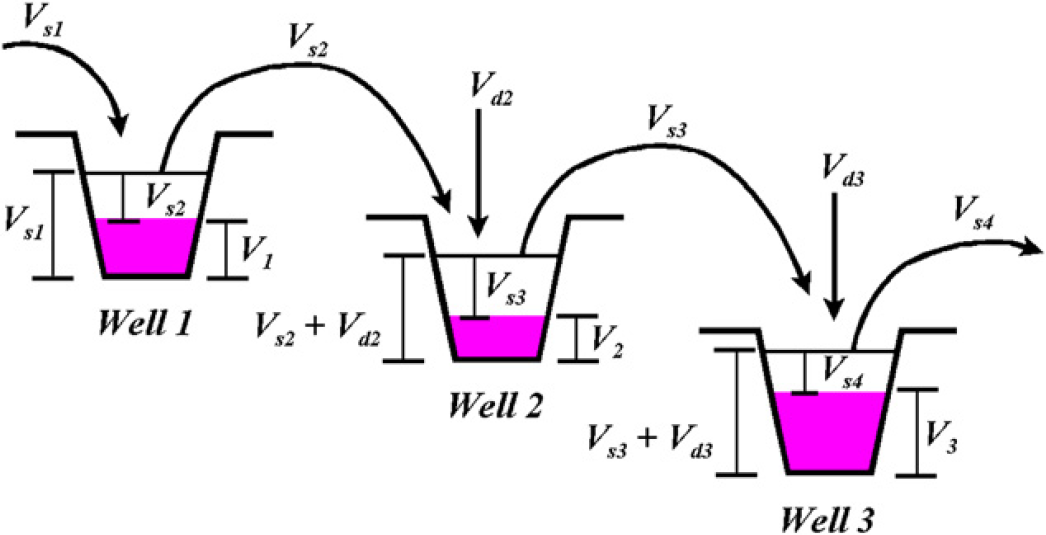
Schematic description of a dilution process carried out over three wells. All terms are defined and discussed in the text.
Well 1–The first step of the procedure entails dispensing sample volume V s1 into well 1, followed by removal of volume V s2 from well 1, and dispensing it into well 2. The net volume of solution left in well 1 (V 1) is given by

Because the solution in well 1 is neat, the concentrations of both dyes are known, and the depth of liquid (l 1) in well 1 can be determined by measuring the absorbance of the blue dye and applying Eq. (3). More directly expressed, the depth of liquid is given by

where A 730,1 denotes the measured absorbance at 730 nm in well 1, and a b is the absorbance per pathlength of the blue dye. The Beer's law expression for the absorbance of the red dye in well 1 is given by

where C r1 is used to indicate the concentration of red dye in well 1. Because no dilution has occurred for the solution in well 1, C r1 is equivalent to the neat, undiluted red dye concentration. This allows for substitution of Eqs. (4) and (7) into Eq. (8):

Well 2–A volume of diluent (V d2) is added to the sample volume (V s2) already present in well 2. The solutions are mixed until homogenous and a volume V s3 is then removed and dispensed into well 3. The net volume in well 2 (V 2) is given by

Because the concentration of blue dye is fixed for all solutions, it is known for well 2. Thus the solution depth can be determined by the measured absorbance of the blue dye at 730 nm, as given by

The concentration of red dye in well 2 has been diluted and is given by
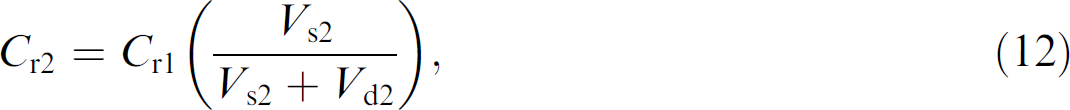
where (V s2 /V s2+ V d2) represents the dilution factor experienced by the red dye in going from well 1 to well 2. The Beer's law expression for the absorbance of red dye in well 2 is given by

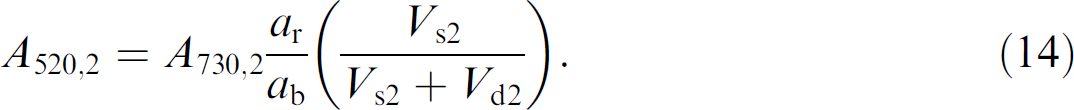
Substitution of Eqs. (11), (12), and (4) into Eq. (13) gives the reduced expression
Well 3–In moving to well 3, first a volume of diluent (V d3) is added to the sample volume (V s3) already present. The solutions are mixed until homogenous and a sample volume V S4 is removed and dispensed into well 4. As occurred for well 2, the expressions for the net volume and solution depth for well 3 are given as


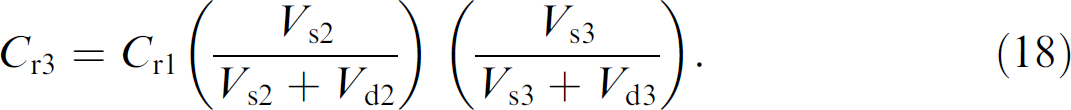
The concentration of red dye in well 3 has been diluted from its concentration in well 2 (C r2) by a ratio of (V s3 /V s3 + V d3) and is given by
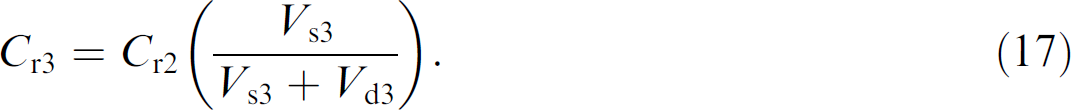
Substitution of the expression for the concentration of red dye in well 2 (C r2) from Eq. (12) into Eq. (17) gives
The Beer's law expression for the absorbance of red dye in well 3 is given as

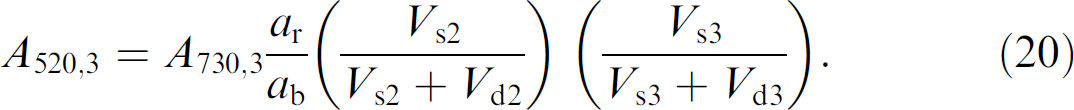
Substitution of Eqs. (16), (18), and (4) into Eq. (19) gives the reduced expression
Well 4 and Beyond–The same steps described above can be followed to develop expressions for dilution steps continued beyond well 3, but will not be discussed here.
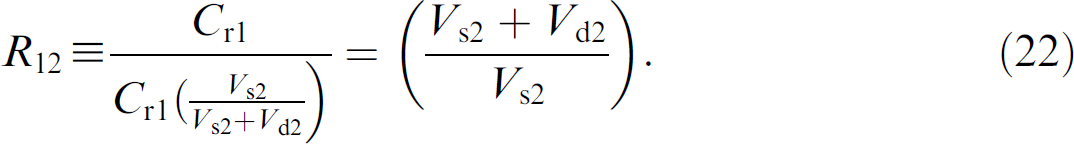
Dilution Ratios–The object of this theoretical analysis is to describe a method for calculating the accuracy of the dilution ratio of each step of a dilution method, such as the method depicted in Figure 1. To begin, the dilution of neat solution from well 1 to well 2 is defined as

Inserting the expression for the concentration of red dye in well 2 from Eq. (12) into Eq. (21) gives
The Beer's law expression for the absorbance ratio of red dye in well 1 compared to well 2 is given through dividing Eq. (9) by Eq. (14):
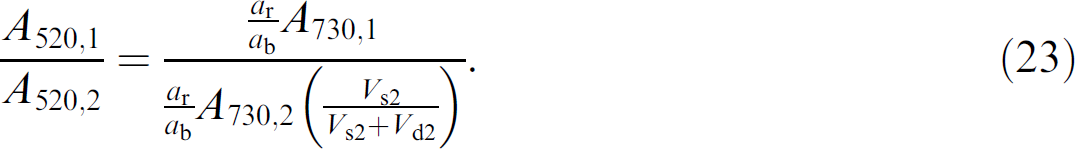
Substituting Eq. (22) into Eq. (23) and solving for the dilution ratio gives

Likewise in going from well 2 to well 3, the dilution ratio is

A more general expression for dilution steps is given as

where well m precedes well n in the dilution scheme.
This simple theoretical example demonstrates that the dilution ratios can be determined by measuring the absorbance ratios of the red and blue dyes for each solution-filled well. It is important to note that neither of the dye concentrations is needed for this analysis. As demonstrated by Eq. (26), the only quantities required to calculate a dilution ratio in going from well m to well n are the measured absorbance values for both red and blue dyes in both wells. Thus, one limitation for the stepwise dilution analysis described by Eq. (26) is that the absorbance values for both dyes must be in a measurable absorbance range for the spectrophotometer used to collect the absorbance measurements. In other words, for this dilution calculation to be valid, the absorbance of both the red and blue dyes must be in the linear, Beer's law absorbance range of the spectrophotometer 8 , 9 in both well m and well n. It should also be noted that a major assumption for this analysis is that thorough mixing is carried out for each dilution step, meaning that the red and blue dye concentrations are homogenous before any further dilution step is conducted, or before any absorbance measurements are made. Any deviation from homogeneity will adversely bias the measured absorbance and any calculations based on these measurements. Another note of interest is that this analysis should be independent of shape of the solution meniscus, so long as the meniscus curvature is not significantly different between well m and well n.
Eq. (26) can be used to calculate the dilution between any two steps in a series of dilutions, but only if the absorbance values for both dyes are in a measurable range in both wells. This requirement can pose a significant limitation for commonly used dilution schemes which cover greater than a 1000-fold dilution between the start and end wells. The approach described herein provides a method for overcoming such a limitation, so long as the starting concentrations for both dyes are known. For example, assume that we want to know the dilution ratio in going from well 1 to well 3. Such a dilution is expressed as
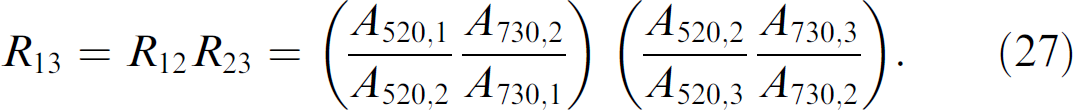
Simplifying Eq. (27) demonstrates that the dilution step between well 1 and well 3 can be calculated directly, without any measurements from well 2:

Because well 1 contains neat, undiluted solution, Eq. (9) can be incorporated into Eq. (28) to give
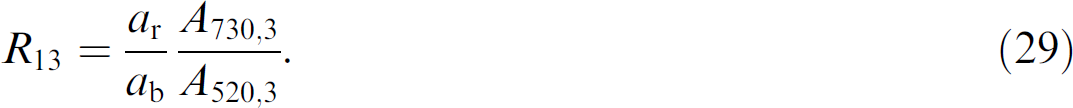
which can be more generally stated as
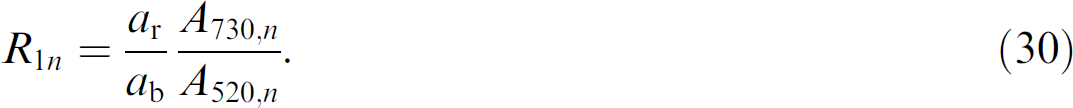
Eq. (30) is used to calculate the dilution ratio in going from well 1 to well n, where well 1 contains neat solution. For very large dilution steps, it may be required to start with a highly concentrated red dye solution to end with a measurable concentration of red dye in well n. However, this means that the concentration of red dye in the neat solution may be beyond the measurable linear absorbance range of the spectrophotometer. 8 , 9 Such a dilution step is still measurable so long as the concentration, or more appropriately the absorbance per pathlength (a r), of the red dye is known for the neat solution, and the blue dye concentration is equal to that in the diluent. Thus, Eq. (30) provides the means to calculate the accuracy of very large dilution steps.
By using the dual-dye, dual-wavelength method described above, dilution ratios of all steps of a dilution scheme can be calculated. However, to fully understand the accuracy of each step in a multistep dilution method, one must consider the measurable absorbance range of the dye solutions used. For example, consider a four-step serial dilution method where each step consists of a 1:4 dilution. Assuming a starting red dye concentration that yields an absorbance of 2.5, which is within the measurable absorbance range of most spectrophotometers, Eq. (1) shows that the absorbance will be reduced by a factor of 1/64 after the third dilution, which corresponds to an absorbance value of 0.039. Although such a small absorbance is measurable by many spectrophotometers, the noise component of such a small value can be significant. Thus, the dye solution used in this case provides measurable quantities only for the first two dilution steps of this method. Now assume that the process is repeated for a red dye whose concentration would yield an equivalent absorbance of 75, if such a measurement was achievable by a spectrophotometer. The absorbance of the red dye would still be beyond measurement after the first and second dilution steps. However, the absorbance of the third (1:64) and fourth (1:256) dilution steps would be 1.17 and 0.29, respectively. Thus, to fully understand the proposed four-step 1:4 serial dilution scheme, the process must be conducted two separate times, one using the red dye with a neat absorbance of 2.5, the second using the red dye with a neat absorbance of 75. By using these two different red dye solutions, and repeating the dilution procedure for each solution, all four steps of the 1:4 serial dilution method can be assessed using Eqs. (26) and (30), assuming that the red dye absorbance per pathlength values (a r) can be determined for each starting solution.
Experimental Demonstration
Materials
The theoretical method discussed above was described for solutions containing red and blue dyes. Although any number of dyes could be used to conduct such dilution testing so long as their spectra are baseline resolved, 8 , 9 the example was explained in terms of “red” and “blue” dyes because the solution system used to test this theory is the same used for the Artel Multichannel Verification System (MVS). 6 MVS sample solutions consist of a common, fixed blue dye concentration, but a variable red dye concentration. MVS diluent contains the same blue dye concentration as in the MVS sample solutions. The concentration of red and blue dyes in each of the solutions is known and well controlled through a rigorous QC process. The operation of the MVS system is not germane to the dilution method described herein, but can simply be described as a system used to measure the accuracy and precision of volume delivery from liquid handling equipment. Further details of the MVS system and how it is used can be found in the literature, 6 and will not be discussed here. However, it is important to note that the dual-dye solution concept of the MVS did provide the basis on which this new dilution testing approach was developed.
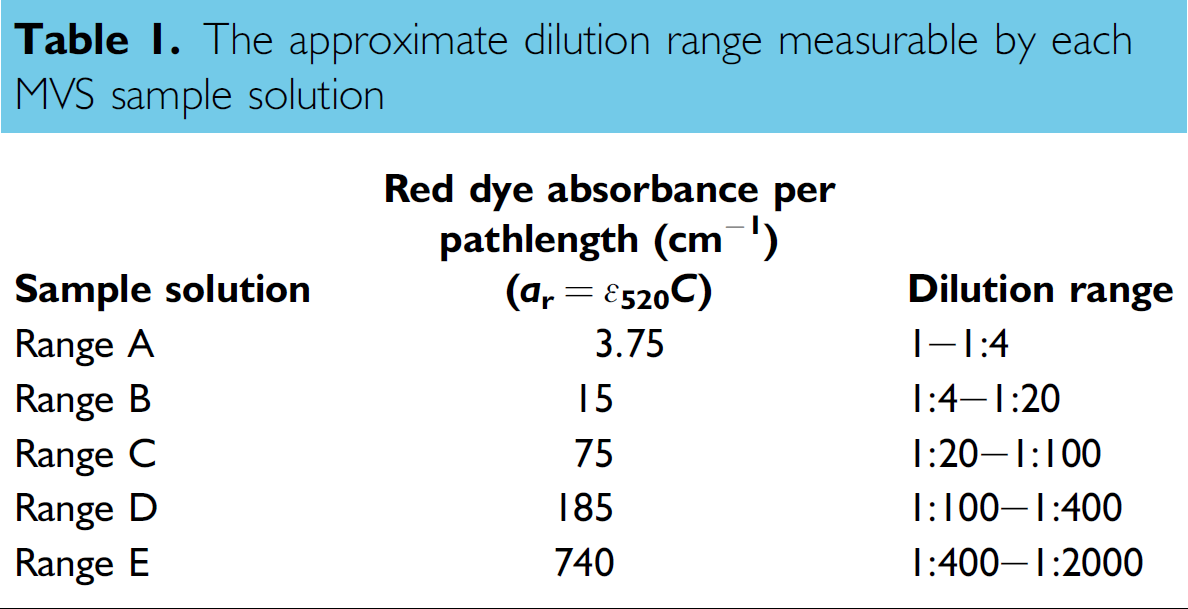
The MVS diluent and sample solutions are characterized by the absorbance per pathlength values for their red and blue dyes, as defined in Eqs. (4) and (5). Considering the known absorbance per pathlength of red dye (a r) in each MVS sample solution, table 1 reports the approximate dilution range that may be achieved for each solution. These dilution ranges are based on maintaining a measurable absorbance of the mixed solutions of between 0.3 and 2.4 OD. The a r in each MVS sample solution is determined by the Artel laboratory through a large volume gravimetric dilution process. A large volume dilution is gravimetrically made for each MVS sample solution using a five-place analytical balance (Mettler-Toledo, AX205), and the absorbance of this dilution is measured with a horizontal beam UV–vis spectrophotometer (Varian, Cary 5000) in a cuvette of known pathlength. By making an accurate gravimetric dilution whose absorbance is within the measurable range of the spectrophotometer, an equivalent a r value is determined for highly concentrated MVS sample solutions.
The approximate dilution range measurable by each MVS sample solution
Procedure
Undiluted (neat) MVS sample solution (200 μL) was dispensed from a multichannel pipette (Rainin, 20–200 μL LTS) into all wells in column 1 of an SBS standard 96-well microtiter plate (Costar, 3631). The sample (100 μL) was aspirated from column 1 using the multichannel pipette and dispensed into column 2, which contained 100 μL of MVS diluent solution. The contents of the wells in column 2 were mixed by aspirating and dispensing 100 μL three times. A 67 μL volume was aspirated from column 2 and dispensed into column 3, which contained 133 μL of MVS diluent, and the mixing step was repeated for the contents of column 3. This process continued for columns 3–7, with the exception that a different volume of solution was dispensed into the wells of each column, as defined in table 2. The absorbance of each solution-filled well was measured at 520 and 730 nm using a microtiter plate reader (Bio-Tek Instruments, ELx800nb).
Experimental design defining the solution volumes added to each column in a microtiter plate
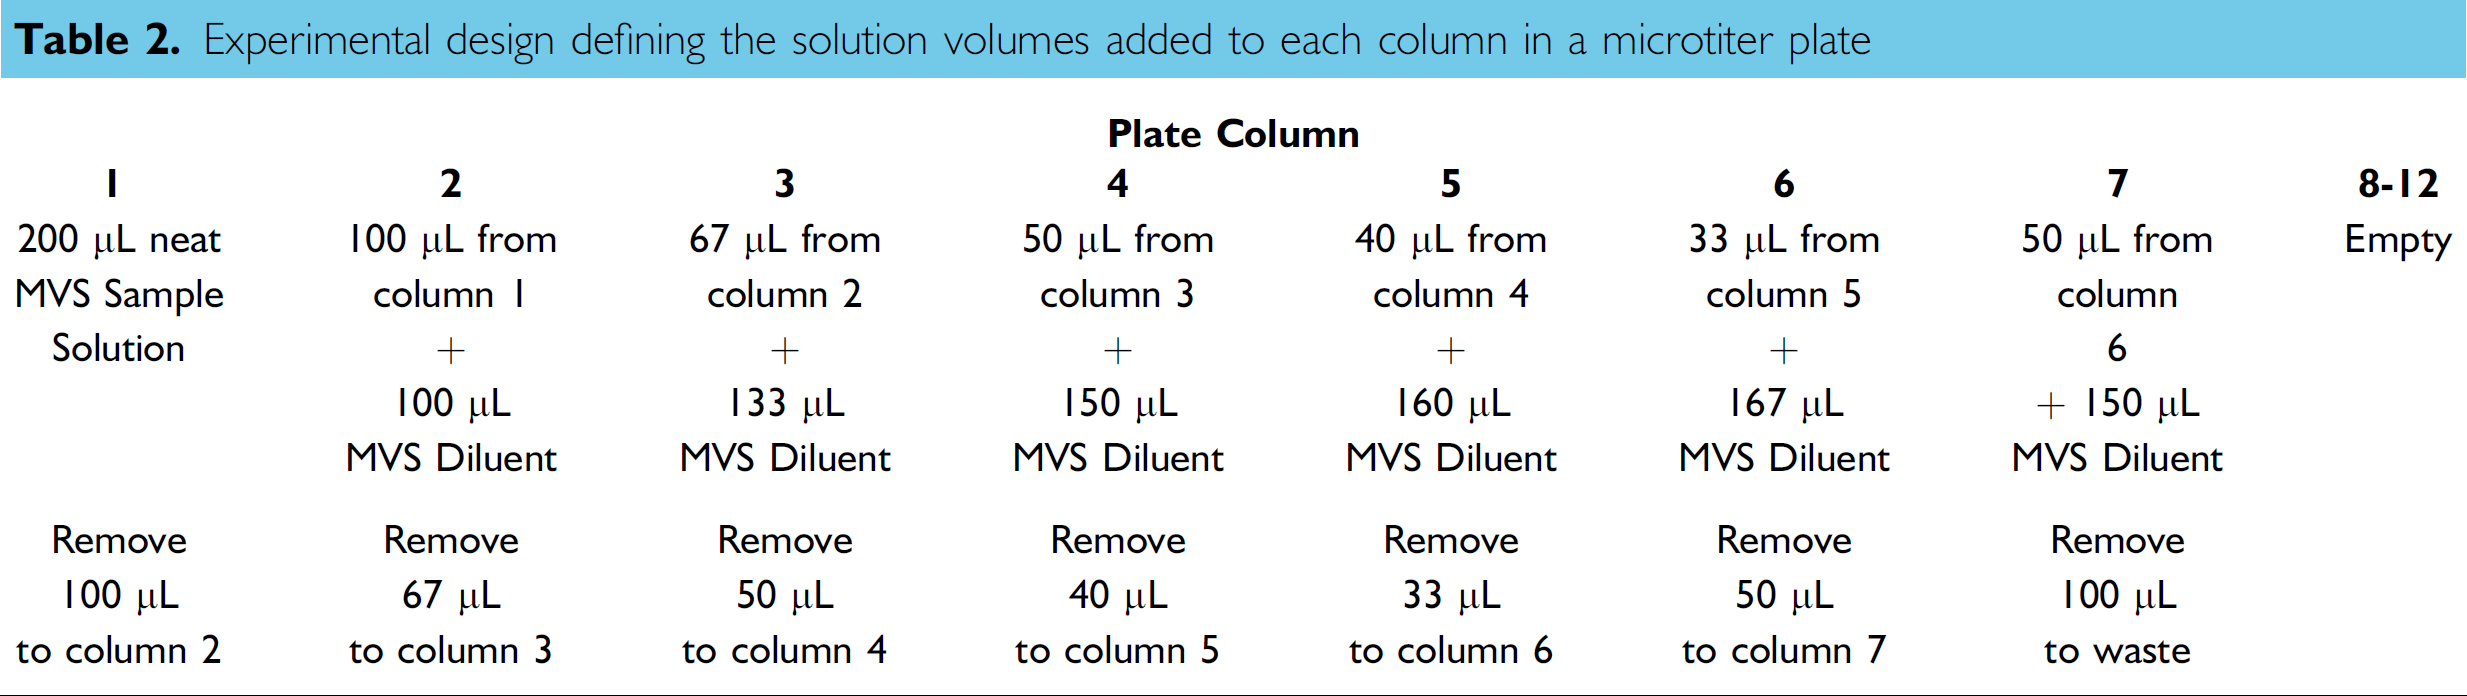
This protocol was followed for all five MVS sample solutions, meaning five separate plates were prepared, one for each MVS sample solution (Ranges A-E). All five MVS sample solutions were used to ensure a measurable absorbance for each step of the defined protocol, thus allowing for testing the individual steps of the multistep dilution protocol defined in table 2.
Results and Discussion
table 3 summarizes the performance of the multichannel pipette when conducting the defined dilution protocol, and consists of data compiled from all five plates used in this experimental protocol. The inaccuracies of the average dilution ratio are reported, which are based on the average dilution of the n = 8 wells in each column. The measured dilution inaccuracy was calculated versus the target dilution using Inaccuracy = (Measured – Target)/Target. Although only the average inaccuracies are reported herein, the inaccuracy on a tip-to-tip basis may also be determined, which would allow for the analysis of channel-to-channel repeatability for the multichannel pipette.
Experimental demonstration of a dual-dye absorbance method for determining dilution accuracy
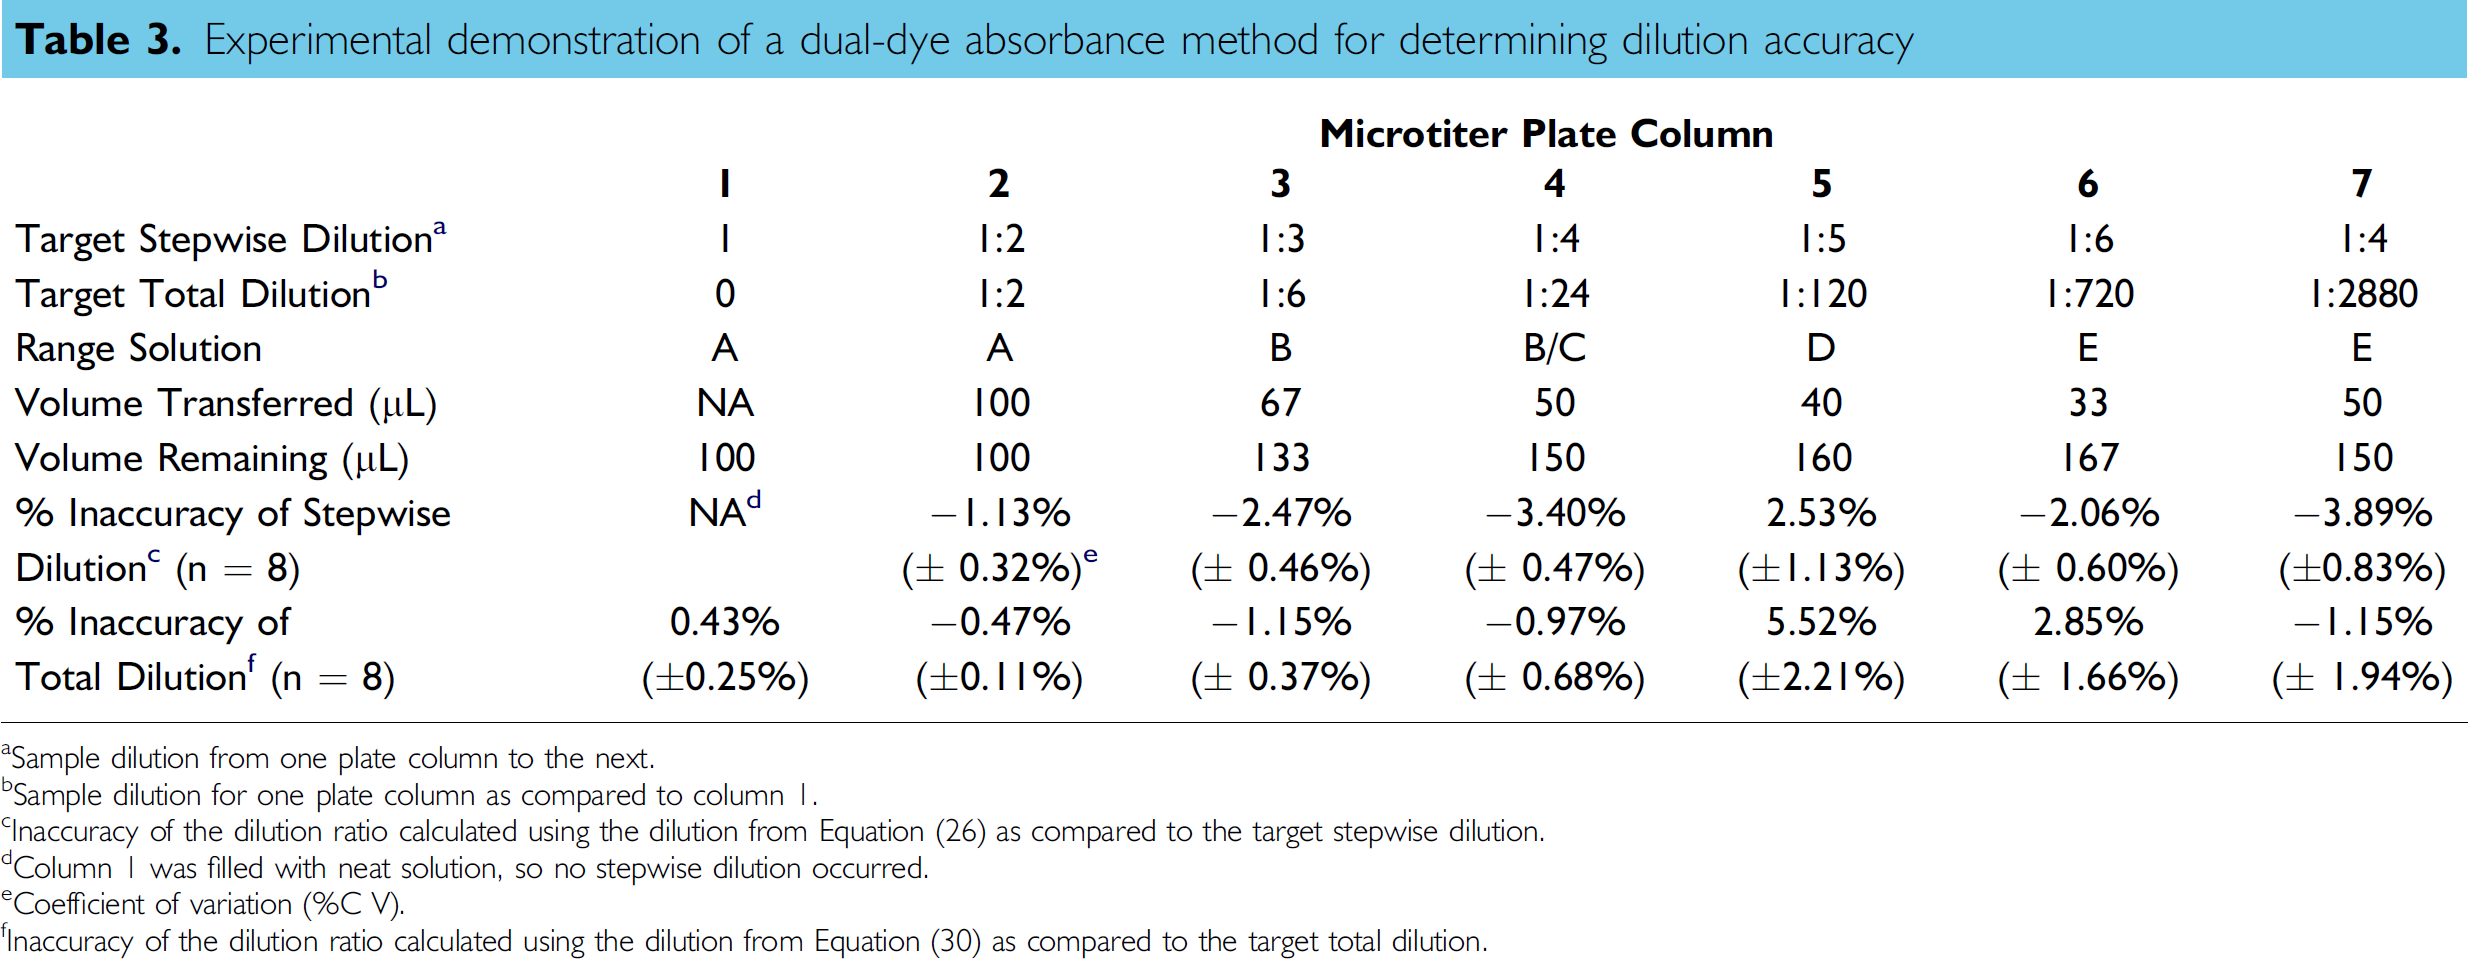
Sample dilution from one plate column to the next.
Sample dilution for one plate column as compared to column 1.
Inaccuracy of the dilution ratio calculated using the dilution from Equation (26) as compared to the target stepwise dilution.
Column 1 was filled with neat solution, so no stepwise dilution occurred.
Coefficient of variation (%C V).
Inaccuracy of the dilution ratio calculated using the dilution from Equation (30) as compared to the target total dilution.
The “Inaccuracy of Stepwise Dilution” data show the uncertainty of the transfer of sample from one column to the next. This inaccuracy calculation was based on the dilution ratio calculated using Eq. (26). The “Inaccuracy of Total Dilution” represents the error associated with the overall dilution ratio for a specific column with respect to column 1, and was calculated using the dilution ratio from Eq. (30).
This proof of concept study shows that by using a dual-dye photometric dilution method, it is possible to determine the accuracy of each step of a variable step dilution protocol. Additionally, when using the MVS sample solutions, the data collected for this proof of concept experiment can achieve the assumed 1:2000 endpoint dilution ratio. In fact, if the acceptable absorbance range for the Range E solution is lowered to 0.19 OD, the measurable dilution ratio extends to almost 1:3000. Although an OD of 0.19 is measurable for most spectrophotometers, the effect of noise in that measurement should not be ignored.
While a fluorescence-based method could allow for dilution testing beyond a 1:10,000 ratio, the range covered by the MVS sample solutions should allow for testing many commonly performed dilution assays. If a dye with a higher molar absorptivity is used, the testable dilution range could be expanded significantly. For example, many heme porphyrins 10 , 11 have a molar absorptivity (ε) of > 100,000 M–1 cm–1, which is five times greater than the ε for the red dye used in the MVS sample solution. Using such a dye would clearly increase the testable dilution range to nearly 1:10,000 for this absorbance-based approach.
It should be noted that although the data in table 3 provide information regarding the validity of the dilution approach, they do not provide a concrete validation of the method. The numbers reported represent the “performance” of the prescribed method and the performance of the multichannel pipette. To truly validate the method for determining the dilution accuracy described herein, the bias of the liquid delivery device needs to be removed or accounted for. Thus, one way to validate this method is to remove the bias of the liquid delivery device by performing a large volume gravimetric dilution procedure, similar to that described in the Materials section.
Although not discussed herein, it should be noted that the results of this approach are independent of several factors, including: (1) well size, (2) well shape, (3) plate material, and (4) the interaction effects between the solution and the plate material, such as meniscus and air pockets, unless the light beam is obstructed. It should also be noted that this process is highly dependent on the thoroughness of mixing, as are all dilution-based methods. The best performance of any assay based on dilution schema, or on photometric or fluorometric measurements requires complete mixing, which should be independently assessed. 7
Conclusions
A new dual-dye method for determining the accuracy of dilution has been demonstrated for a variable step dilution process. By using MVS solutions, a final dilution ratio of > 1:2000 can be tested. Data previously reported for this method validated its ability to determine the accuracy of a 1:2 serial dilution process across an entire plate. 12 The data presented herein provide evidence for this process when applied to variable dilution steps. By using dye solutions of increasing concentration (e.g., MVS sample solutions), a process for determining the accuracy of each step in a variable, multistep dilution scheme can be determined. Future work required to complete the validation of this dilution analysis method will include a comparison to gravimetrically measured large volume dilutions.