
Abstract
We present the simulation, development and experimental validation of a μ-concentrator based on dielectrophoresis, DEP. In a first step dielectrophoretic force fields of various electrodes are computed and compared. The simulation results for various electrode dimensions may serve as a general design rule for DEP devices. Favorable electrode designs were realized in gold on glass substrates. The performance of the DEP chips is validated by concentration of E.-Coli bacteria, a separation efficiency of 99.93% was achieved. Furthermore, we outline how the combination of forced convection and DEP allows for bacteria separation at increased flow rates.
Introduction
An efficient sample preparation, in particular filtration and concentration, is mandatory for high performance analysis of biological samples. Particle separation and concentration by means of dielectrophoresis, DEP, bears the advantage that the trapping force does not solely depend on the particle volume but also on its electrical properties, thus allowing for separation of specific species from mixed suspensions. By now various applications of dielectrophoretic particle manipulation as concentration of viruses, bacteria, and separation of mixtures have been reported in the literature, see e.g.,1–3 and references therein.
Here we examine in depth, by numerical computation of dielectrophoretic forces and the application of the appropriate scaling behavior, how electrode designs can be optimized for the use in concentration devices.
In cooperation with NorChip AS, 4 a dielectrophoretic μ-concentrator was developed at the Institute of Microtechnology Mainz GmbH (IMM). In a first step electric fields of various electrode geometries were computed and the magnitudes of the corresponding dielectrophoretic forces (∼▿E 2 ) were compared. Furthermore, the spatial distribution of the dielectrophoretic force, more precisely the decay above the electrodes, was analyzed as a function of electrode dimensions. The result helps to define design rules for the layout of DEP devices.
Two favorable electrode designs were realized in gold and in aluminum on glass substrates. Electrode dimensions and spacing down to 3μm were fabricated. The electrode geometries in combination with the small distances lead to large electric fields with strong inhomogeneities implying high dielectrophoretic forces.
The performance of the DEP chips was investigated with various particles (0.2μm, 3μm, 6μm Latex beads, Cyano- and E.-Coli bacteria) suspended in deionized water. Here, we present the experimental results of separation of E.-Coli bacteria and investigate the separation efficiency. Finally, we discuss how an improved DEP μ-concentrator can be set up by combining hydrodynamic and DEP forces.
Experimental
The μ-concentrator prototype as it was used for experimental validation is schematically shown in Fig. 1. The setup is similar to the DEP separation devices used in several other studies.5–7 However, optimized electrode designs are used. Moreover the height of the fluid chamber and the dimensions of the electrodes are considerably smaller than those used in previous studies. The dimensions and shape of the electrodes are discussed in detail in the next section.
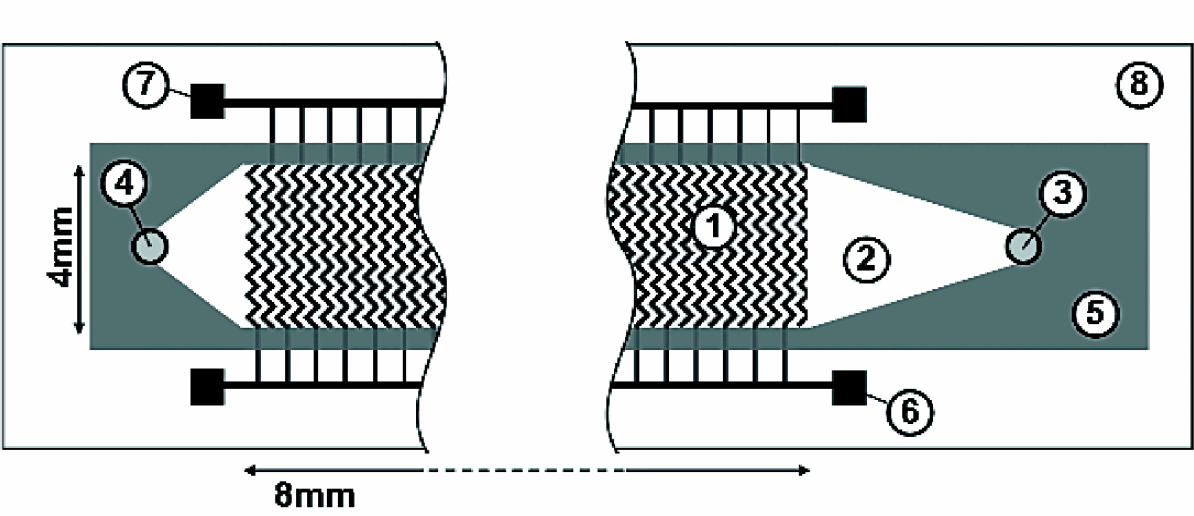
Sketch of the μ-concentrator set-up: 1: electrode array; 2: separation chamber; 3: inlet; 4: outlet; 5: spacer membrane; 6, 7: contact pads; 8: bottom glass (the cover glass is not shown).
In the case of gold electrodes the interdigitated electrode array was made by a lift-off technique with titanium as adhesion layer. Aluminum electrodes were created by means of etching. A silicon-oxide insulation layer was applied with plasma enhanced chemical vapor deposition. Sixteen different electrode arrays with a layer thickness of about 150nm were deposited onto a glass wafer of 500μm thickness. For details concerning the used microfabrication techniques see reference 8. The electrode arrays were separated using a wafer saw (DAD-2H/6T, DISCO HI-Tec Europe GmbH, Kirchheim, Germany). The separated parts with drilled holes for fluidic connection were mounted onto microscope slides. The separation chamber is defined by a 6μm Kapton® membrane and covered with a glass slide (cf. Fig. 1). Sealing was achieved by usage of hot glue (Crystalbond, T-E Klebetechnik, Hannover, Germany) at a temperature of 200°C for assembly of the different parts. Due to capillary forces the hot glue penetrates between membrane and glass leading to a fluid chamber height of about 15μm.
Two ml of E.-Coli (K 12 ‘wild type’ from the ‘Deutsche Sammlung von Mikroorganismen und Zellkulturen’ (DSMZ) Braunschweig, Germany) suspension were centrifuged at 1300 rpm for 15minutes and re-suspended in deionized water. The bacteria concentration was adjusted to an optical absorbance of about 0.2 at 550nm (UV/VIS-Spectrometer, Milton Roy, Spectronic 401) prior to dilution (1:100) with deionized water. A voltage of 17V (peak-to-peak) at a frequency of 6MHz (power supply: HM 8131–2 from Hameg, Frankfurt, Germany) was applied and 0.5ml of the bacteria suspension was pumped through the separation chamber with flow rates between 0.1ml/h and 0.5ml/h (Syringe pump, kdScientific, New Hope, PA). After switching off the voltage the electrode array was flushed with an air bubble which has the advantage that, first, the bacteria are efficiently detached by the sweeping phase boundary, and second, the concentrate is not diluted with elution fluid. Fractions of the start sample, concentrate and filtrate (fluid which passes the concentrator while voltage was switched on) were applied on Agar plates in three different dilutions and cultivated at 30°C for 24 hours. The numbers of colonies were translated into concentrations of the original samples and averaged.
Computation of dielectrophoretic forces
In case of a small particle diameter compared to the scale of non-uniformities of the electric field and under the assumption that higher order moments are negligible, the time averaged dielectrophoretic force a spherical particle experiences in an imposed electric field with angular frequency w is given by

where V denotes the particle volume, ε
m
is the
relative permittivity of the suspending medium, ε
m, p
 denotes the complex permittivity of the suspending medium and particle, respectively.
Re{(ε
m
*,ε
p
*)} is the real part
of the Clausius-Mosotti factor (ε
p
*
–ε
m
*)/(ε
p
*
+2ε
m
*).
3
,
9
,
10
denotes the complex permittivity of the suspending medium and particle, respectively.
Re{(ε
m
*,ε
p
*)} is the real part
of the Clausius-Mosotti factor (ε
p
*
–ε
m
*)/(ε
p
*
+2ε
m
*).
3
,
9
,
10
Here, we focus on the force dependence on  and analyze its
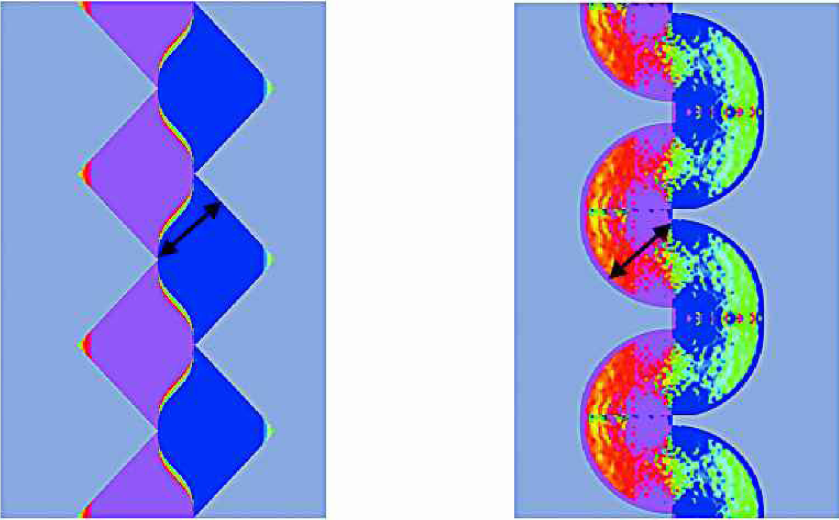
dependence on electrode shapes and dimensions. Fig. 2 shows two-dimensional (2D) simulations of
the force distributions in flow direction, i.e.
∂
x
and analyze its
dependence on electrode shapes and dimensions. Fig. 2 shows two-dimensional (2D) simulations of
the force distributions in flow direction, i.e.
∂
x
 , for electrode
geometries used by Pethig et al. and others
2
,
5
,
7
and by Morgan and Green.
6
Green areas correspond
to regions with a relatively low dielectrophoretic force, while pink and blue areas indicate
a high force value. The fact that different electrode designs have been used in similar
dielectrophoretic separation applications lead us to the numerical analysis of various
electrode designs.
, for electrode
geometries used by Pethig et al. and others
2
,
5
,
7
and by Morgan and Green.
6
Green areas correspond
to regions with a relatively low dielectrophoretic force, while pink and blue areas indicate
a high force value. The fact that different electrode designs have been used in similar
dielectrophoretic separation applications lead us to the numerical analysis of various
electrode designs.

Two-dimensional simulation results of the force distributions in flow direction, i.e.
∂
x
, for
electrode geometries used by Pethig et al. and others
2
,
5
,
7
(left hand side) and by Morgan and
Green
6
(right hand side) in arbitrary units. Pink and blue areas show large absolute forces,
while green denotes areas with a relatively low force. Each figure shows a part of
interdigitated counter electrodes in gray. The arrows indicate the minimum spacing
between the electrodes (3μm in the simulations).
Comparing the force distributions shown in Fig. 2 with those of alternative electrode geometries (Fig. 3) one finds the regions with low absolute forces (green) being considerably reduced. This suggests that even more efficient DEP devices might be realized with these electrode designs. Note that the same minimum electrode distance (indicated by ↔ in Fig. 2, 3) was used in all simulations. However, the results were derived on the basis of a purely 2D simulation. Motivated by these simulations a quantitative 3D analysis of the zigzag electrode design as sketched in Fig. 4 was performed.
Two-dimensional simulation of the dielectrophoretic force as in Fig. 2 for alternative electrode geometries having the same minimum spacing between counter electrodes (arrows).
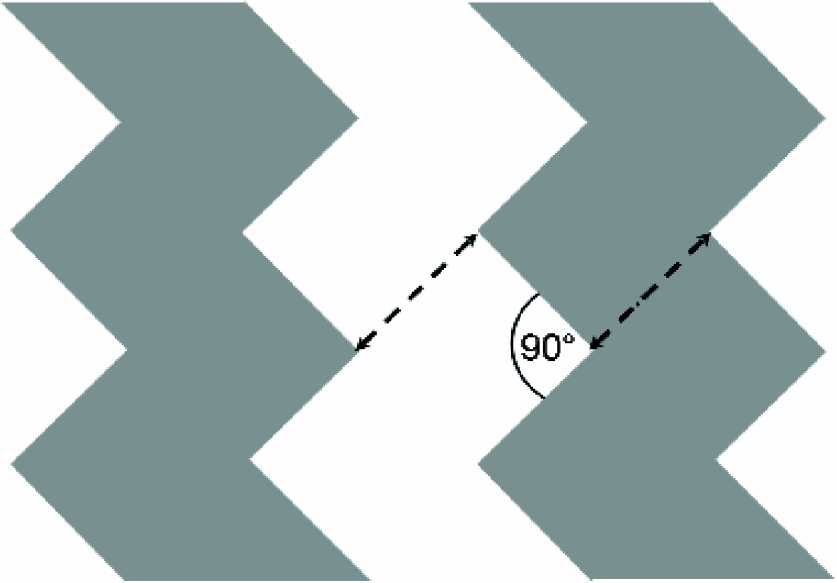
Geometry of zigzag electrodes. The dashed lines indicate the length scale, i.e. the distance between electrodes which equals their lateral dimension, it varies between 3μm and 12 μm.
As a measure for the separation efficiency we chose the average magnitude of the
dielectrophoretic force in opposite flow direction. Since inertia effects can be safely
neglected a particle surrounded by a moving fluid is likely to be trapped if the average
force exceeds the drag force. Fig.
5 shows the average dielectrophoretic force on a logarithmic scale as function of
the level height above the electrodes for an electrode distance of 3μm. As can be read off
from the figure the curve shows a linear decay for heights above 4μm corresponding to an
exponential decay of the dielectrophoretic force. A similar  nential decay
is also found for the corresponding force normal to the electrode array as has been reported
in context with DEP field-flow fractionation.11–13
nential decay
is also found for the corresponding force normal to the electrode array as has been reported
in context with DEP field-flow fractionation.11–13
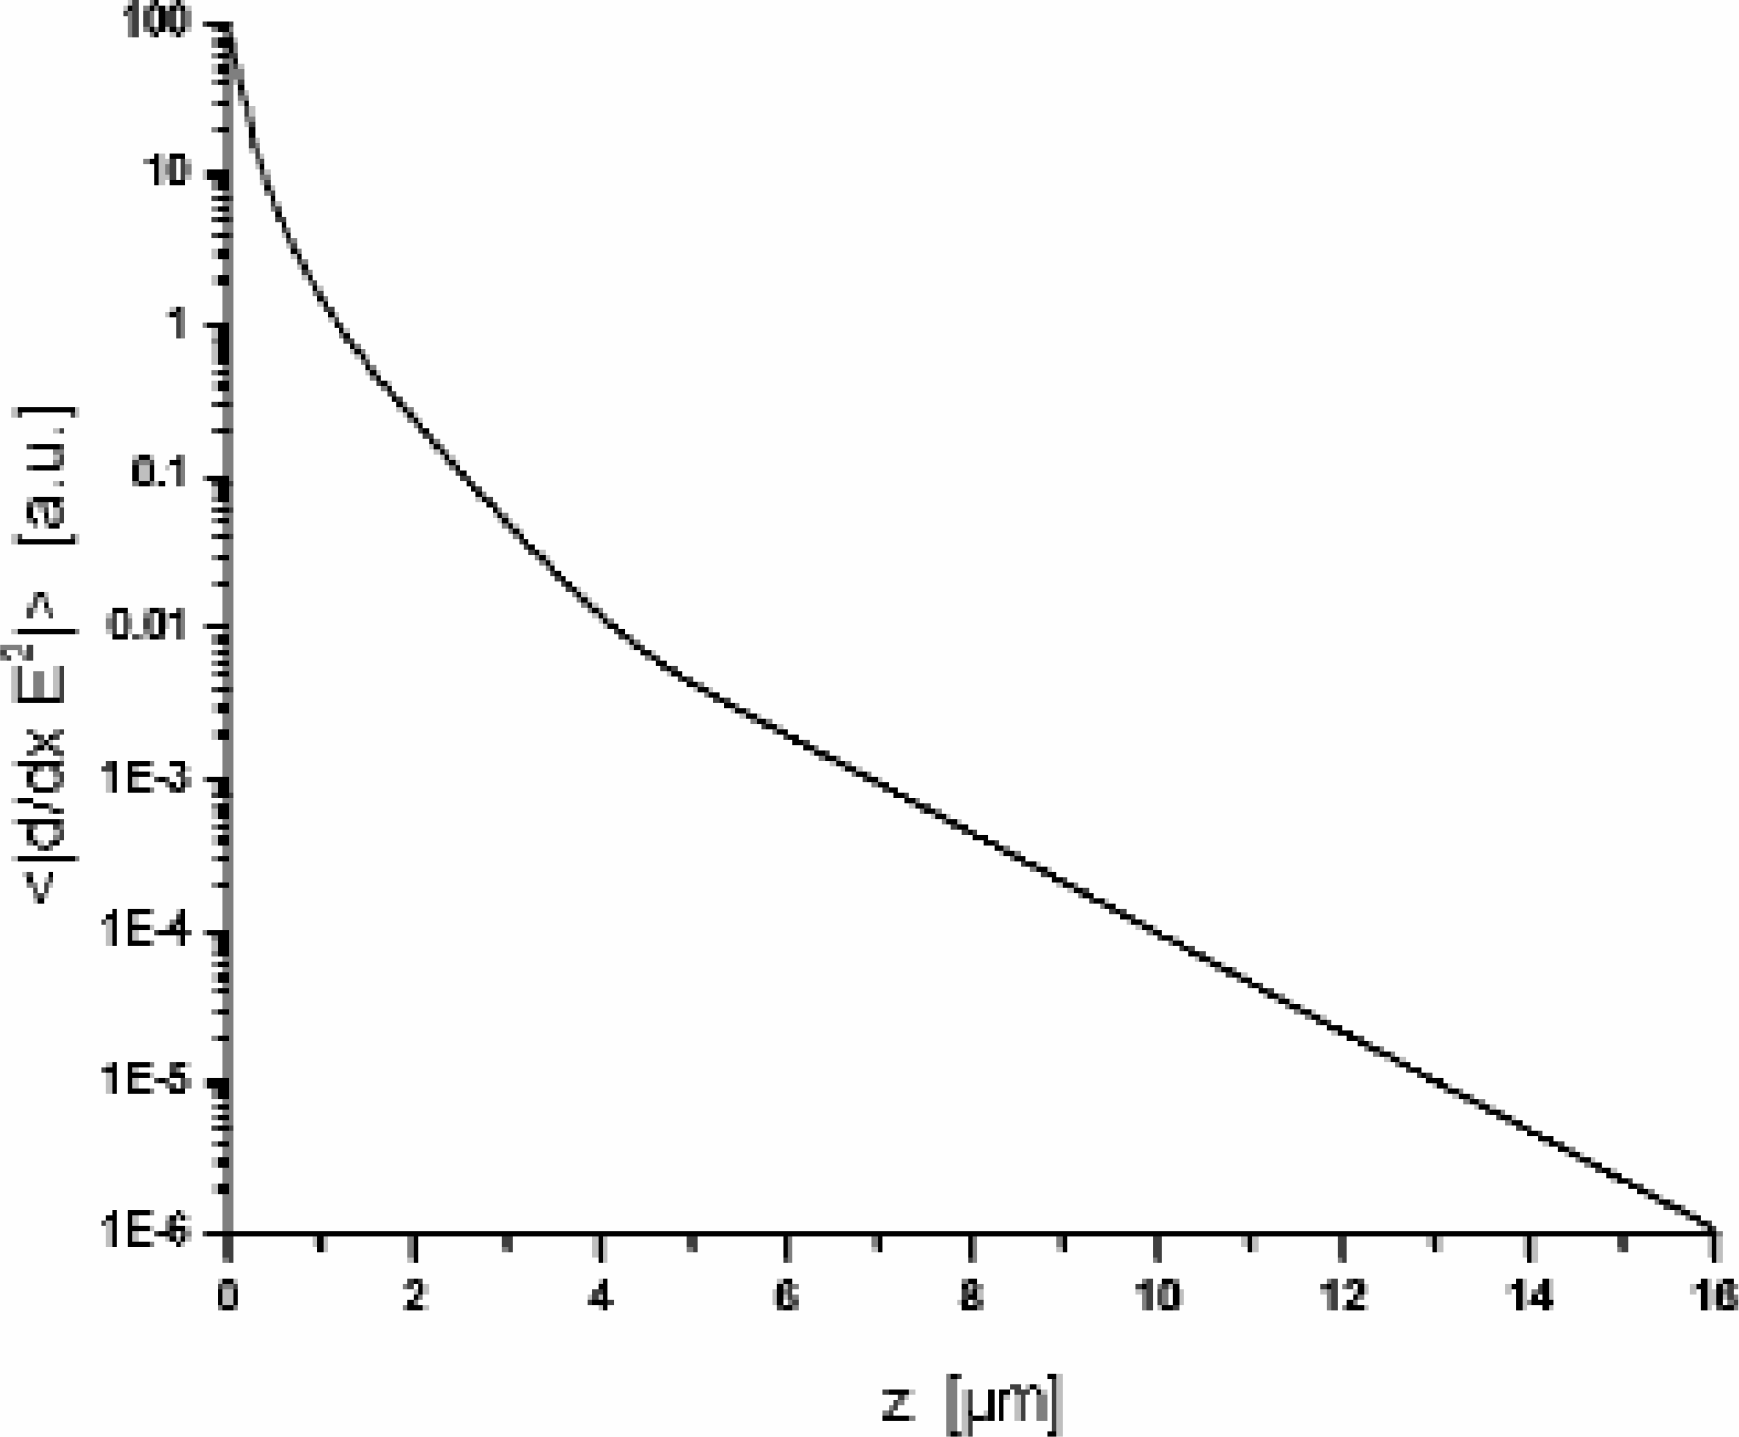
Average magnitude of dielectrophoretic force as function of the level height above the electrode array for an electrode distance of 3μm. The average is performed over the area of the interdigitated electrode array.
Due to the scaling behavior of (∼l-3, with l being the typical length scale of the electrodes) scaled electrodes induce a similar force distribution, however, with a different slope and a different transition point where linearity sets in. Thus comparing the curve of the force distribution shown in Fig. 5 to the curve of a scaled electrode geometry (scaling factor > 1) yields an intersection point for a particular height (z0) above the electrodes. For values < z0 the dielectrophoretic force of the original electrode geometry exceeds the force of the scaled electrodes, for heights > z0 the opposite is true.
The average forces for scaled electrodes are shown in the logarithmic plot in Fig. 6. From this representation it becomes evident that the maximum average dielectrophoretic force at a certain level height is provided by particular electrode dimensions. The inset of Fig. 6 shows the mutual intersection points extracted from the array of curves, i.e., the electrode dimension as function of the height (z0) where the average force equals that of electrodes with a smaller distance. The linear behavior for electrode distances above 6μm is well represented by a straight line with slope 1.7 and offset 1.2μm.
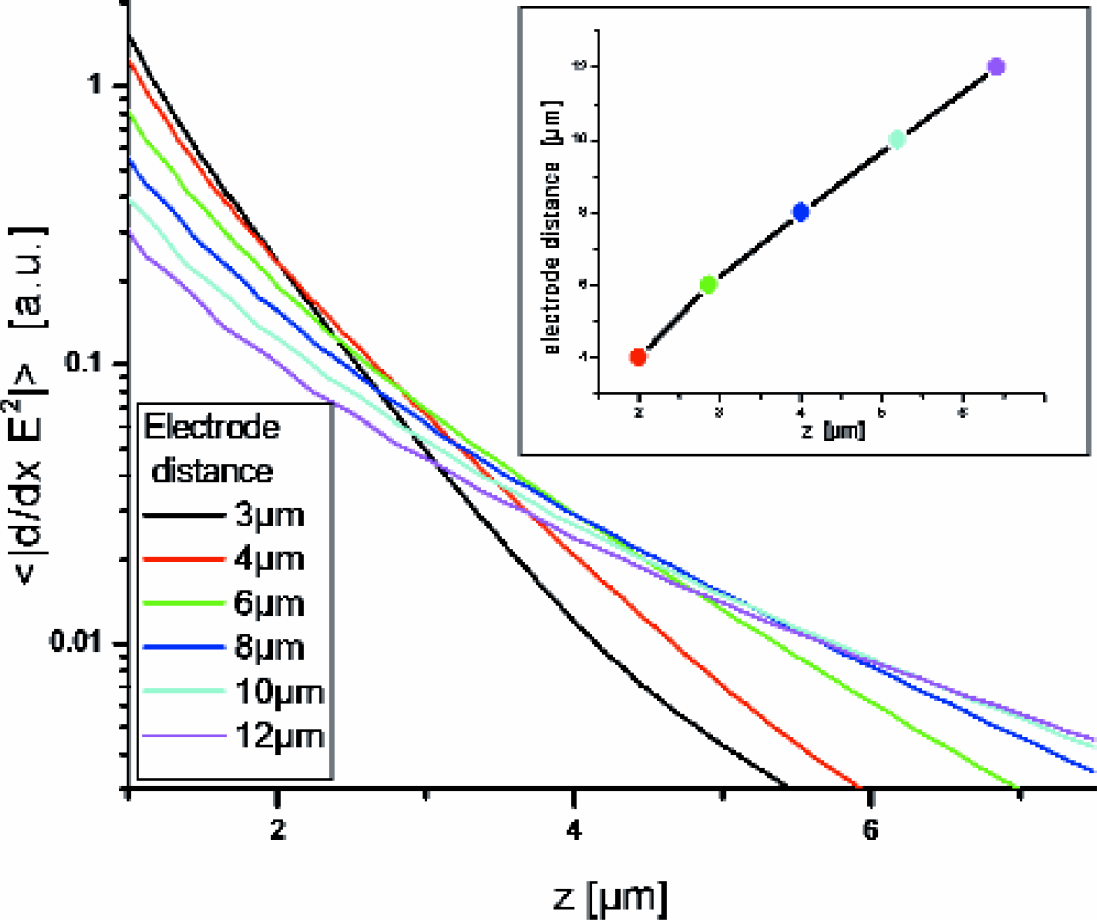
Averages forces as in Fig. 5 for scaled electrode geometries. The inset shows the electrode distances as function of the z-values (heights) of the mutual intersection points.
Concluding the theoretical considerations we state that the efficiency of DEP electrode arrays can be increased by realization of variable electrode distances. Close to the inlet relatively large distances are favorable for attracting particles far away from the electrodes. As the particles are moved towards the electrodes, the electrode dimensions should be gradually decreased, as the maximum force at moderate heights is provided by electrodes with reduced distances. The precise dimensions depend on the height of the fluid chamber, the dimensions of particles which are to be trapped and their concentration. The concentration is of importance since one has to provide sufficient electrode pairs with minimum distance to immobilize all particles.
Results and Discussion
Experiments with latex beads of various sizes showed that even particles with diameters down to 0.2μm could be manipulated. In several concentration experiments with E.-Coli bacteria and subsequent counting of cultivated colonies we achieved separation efficiencies larger than 99.9%, i.e. more than 99.9% of the incoming bacteria were immobilized at the electrodes and detached by sweeping an air bubble through the separation chamber. The bacteria concentration of the incoming suspension and the concentrate was typically larger than 10 6 bacteria/ml while the filtrate concentration was found to be below 10 3 bacteria/ml in several cases.
Fig. 7 shows typical bacteria distributions obtained in a similar experiment where an initial suspension with a large bacteria concentration was used for better visualization. The direction of fluid flow is from right to left. The upstream electrodes or more precise the interspaces between the electrodes are completely covered with bacteria, while only very few bacteria are visible at the electrodes downstream. The gradually filling of the electrode array suggests that the bacteria are immobilized as soon as they experience the force from unoccupied electrodes.
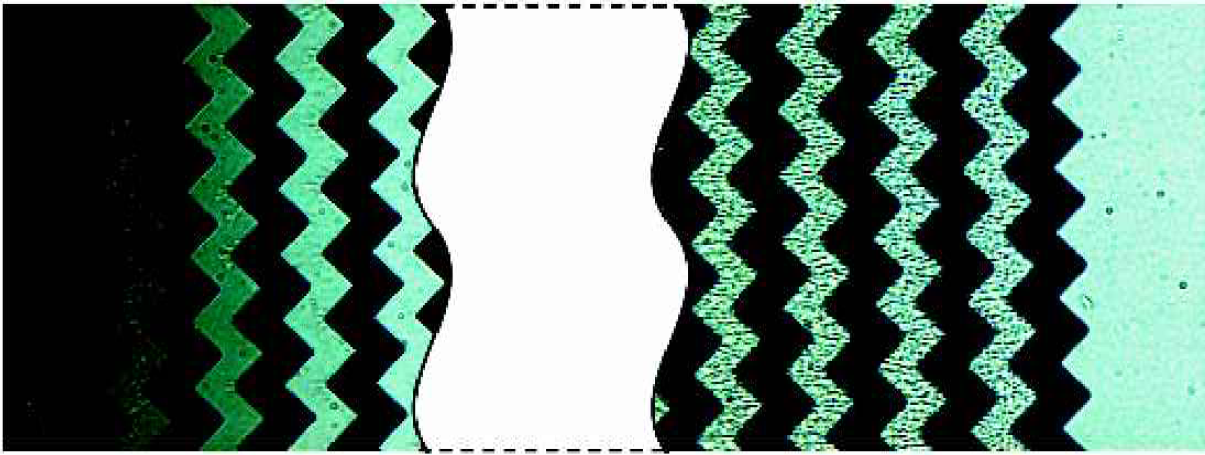
Spatial distribution of E.-Coli bacteria during a concentration run. The fluid flow is from right to left. The distance between the electrodes which are shown in black is 10μm.
The left micrograph of Fig. 8 shows the bacteria distribution in a corresponding experiment with half-circular electrodes and a distance of 6μm. The right part shows a close-up of the bacteria distribution for zigzag electrodes with an angle of 60° and a distance of 3μm. In both cases one finds the bacteria distributions and hence the separation efficiency to be strongly influenced by dipole-dipole interactions, the so-called pearl chain formation. 1 , 14
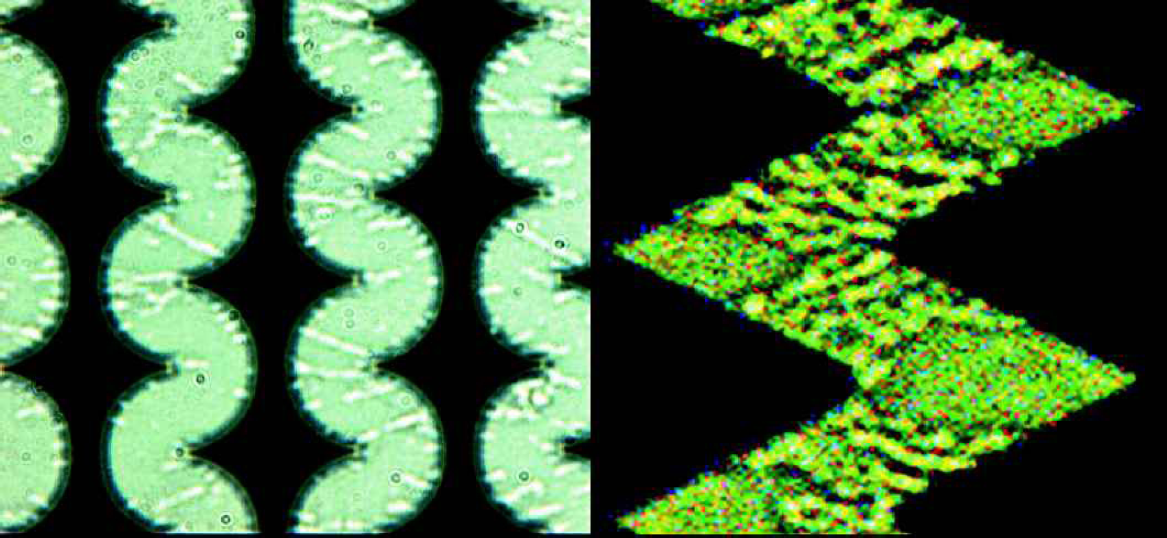
Spatial distribution of E.-Coli bacteria during a concentration run. The fluid flow is from right to left. Left micrograph: half-circular electrodes, distance 6μm; right micrograph: close-up of electrodes with an angle of 60° and a distance of 3μm.
The numerical computation of electrical fields and corresponding dielectrophoretic forces in combination with the appropriate scaling laws allows the identification of optimum electrode geometries and dimensions. Furthermore, modern software tools as CFD-ACE+ 15 allow the direct simulation of dielectrophoretic particle trapping. However, particle-particle interactions are not included, since it implies a considerably increased numerical effort. Thus the agreement between the numerical particle distribution and experiments is poor. Nevertheless, the spatial bacteria distributions as determined from experiment share important features with the simulations. Comparing the micrograph showing the distribution of seeds of chain formation (right part of Fig. 9) with the simulated maxima of the DEP force (pink areas in the left part of Fig. 9) yields a good agreement between simulation and experiment. Both show pronounced features at the electrode tips.
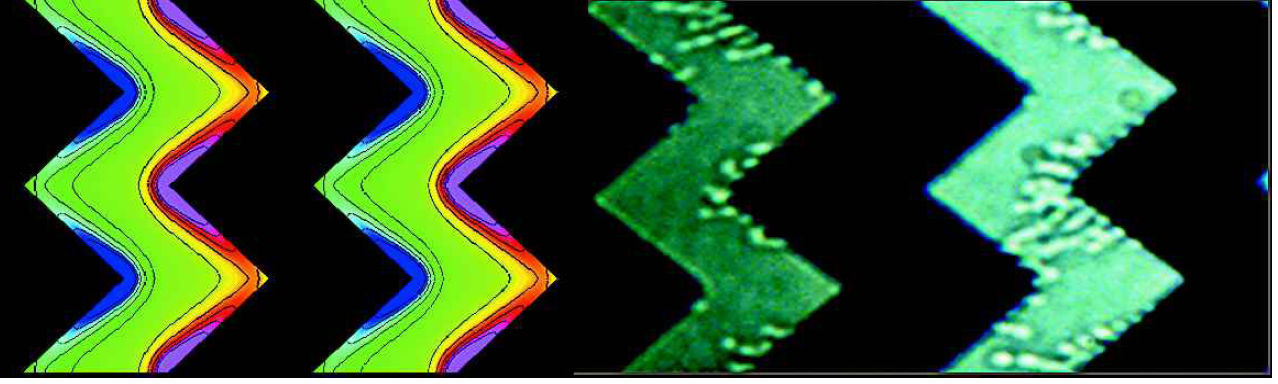
Comparison between simulation (left part) and experimental E.-Coli distribution (right part). The simulation result shows the dielectrophoretic force in opposite flow direction. Pink (blue) areas denote maximum (minimum) forces. The micrograph on the right shows the spatial E.-Coli distribution at the beginning of the concentration run. The flow direction is from right to left.
The excellent concentration performance stated above was only achieved for volume flow rates below about 0.5ml/h. For larger flow rates considerably reduced separation efficiencies are experimentally observed.
Outlook
The restriction to small flow rates originates in the different dependencies of the drag force and the DEP force on the height. Efficient trapping implies the DEP force to exceed the drag force. However, as sketched in Fig. 10, that cannot be achieved in the whole separation chamber. The problem can be overcome by inducing a helical fluid flow in the separation chamber as indicated in Fig. 11. Particles far away are transported closer to the electrodes where they experience a dielectrophoretic force by orders of magnitude larger and where they eventually become immobilized.
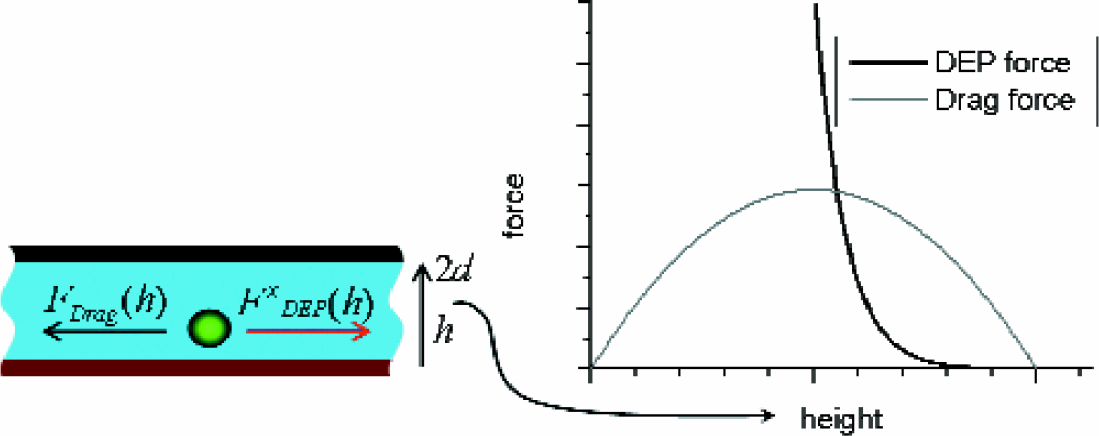
Illustration of the dependencies of DEP force and drag force on the height above the electrodes. The left figure shows a sketch of the separation chamber with the electrode layer at the bottom.
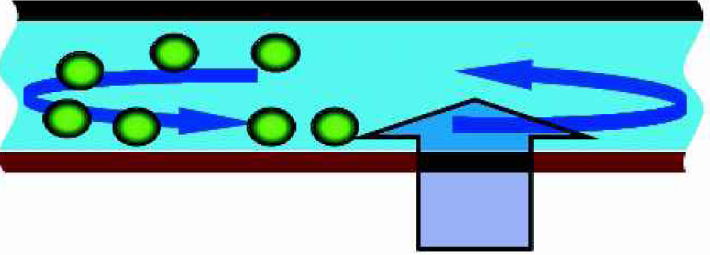
Illustration of helical flow. The main flow direction is into the plane. The helical flow promotes particles from the top to the electrode array at the bottom, where they are immobilized.
Helical flows can be induced between parallel plates by appropriate patterns on one wall. 16 In the context of micro-mixing Stroock et al. 17 showed that so-called bas-relief structures on the bottom of a rectangular channel induce transverse flow. The same mechanism could be utilized to increase the performance of a dielectrophoretic μ-concentrator. Thus a considerably improved separation efficiency is to be expected by combination of DEP using optimized electrodes with mixing effects. A corresponding separation chamber can be realized simply by mounting the electrode chip onto channels structured by means of advanced silicon etching.
The fabrication, experimental validation and the quantification of the separation efficiency is subject of forthcoming investigations.
Acknowledgements
We thank A. Gulliksen, S. Hardt for valuable discussions, R. Huber, L. Schmidt and M. Bär for their assistance in the hardware realization.