
Abstract
This paper describes the automation of an imaging internal source laser desorption
Fourier transform mass spectrometer (I2LD-FTMS). The I2LD-FTMS
consists of a laser-scanning device [Scott and Tremblay, Rev. Sci.
Instrum.
Introduction
Efforts to automate mass spectrometry have increased significantly in recent years.1–12 Automation of the data acquisition and interpretation for our imaging internal laser desorption Fourier transform mass spectrometer (I2LD-FTMS) was necessary to make use of the system practical. The repetitious nature of our case is not due to multiple samples, but from the multiple laser desorption shots necessary to image the surfaces of heterogeneous environmental samples. While we utilized an FTMS as the mass analyzer, with an appropriate interface, our imaging method and software approach would work for any mass analyzer.
Most traditional laser microprobe mass spectrometers utilize time-of-flight (TOF) mass analyzers and translate the sample stage.13–15 Translating the sample was not practical for the FTMS because the sample sits ∼1.5 ft inside the 6-inch bore of a 7 T superconducting magnet. Therefore, we developed a laser-scanning system to manipulate the laser beam to overcome limitations due to the presence of the high magnetic field and geometric constraints of the magnet bore. 16 For true depth-profiling capability, we rely not only on the external laser beam positioning mechanism, but also on the FTMS cell and sample holder design located inside the high magnetic field of the superconducting magnet to take advantage of Lenz's Law 17 to dampen vibrations from the vacuum pumps. It has been reported that even if neither the sample nor the laser is moved, vacuum pump vibrations prevent the laser beam from hitting the exact same spot, 18 preventing true depth-profiling. By building the cell and sample holder out of non-ferromagnetic, but highly conductive material (e.g. aluminum and copper) inside the superconducting magnet, sufficient sample stabilization enables true depth-profiling studies. 16 Another advantage to using an FTMS is its inherent high mass resolution and mass accuracy as well as tandem MS capability. 19 The accurate mass and high resolution are invaluable for unambiguous assignment of peak identities. For example, analysis of minerals often relies on the presence of clusters that contain aluminum, silica, oxygen, and/or hydrogen. Ambiguity arises if AlH (calculated mass 27.988816 Da) and Si (calculated mass 27.976378 Da) cannot be distinguished. For clusters with masses in the range ∼200 Da, a resolution of 15,000 is necessary to distinguish between the peaks. With a mass error of ±0.0004 Da in the mass range <1000 Da, the identity of the peaks is unequivocal.
Our primary interest is in analyzing environmental surfaces, which require depth profiling to determine relationships between contaminant species, microorganisms, and mineral phases. For example, we utilize the depth-profiling enabled by our highly reproducible laser-scanning system to determine where microbes are present during the first scan and then determine the mineral type under the microbes during a subsequent scan to identify preferential binding of microbes to mineral phases. In addition, it is possible to determine the microorganism type by obtaining the mass spectral “fingerprint”. 20 While the instrument is predominantly used for imaging environmental samples, it could also be employed for imaging biological tissues, semi-conductor and other materials.13–15 Additionally, our imaging technique would be useful for analyzing multiple sample locations, such as found in electrophoretic gels. 21
This paper describes the software system designed and implemented at the Idaho National Engineering and Environmental Laboratory (INEEL), which automates both the laboratory-designed laser beam positioning system and the commercial FTMS software of our I2LD-FTMS. Although the FTMS system is a laboratory-built design, we used a commercial FTMS software and firmware package to minimize development time, cost, and risk; therefore, allowing us to concentrate on adding the new automated imaging capability. The laser-scanning system's mechanical details are described in previous literature. 16 The FTMS portion of the system is controlled by a commercial data station obtained from ThermoFinnigan FT/MS. The controlling software is Odyssey 5.0, which is oriented around several programs with graphical user interfaces (GUI). While it is conceivable to utilize the Odyssey system as the ‘Master’ program to control other systems, this option was not chosen because it would limit the number and types of features that could be incorporated into the system in the future. The GUI-centric nature of the Odyssey software, although easy to use by an operator, makes integration with other software more challenging—especially if the Odyssey programs are to be under the control of another program. This paper describes a creative, but simple, method to use undocumented and unadvertised features of the FTMS software to bypass the Odyssey's GUI; therefore, allowing the FTMS package to be used as a system component. We have created our own GUI to control all features of the I2LD-FTMS. Additionally, we report the automation of the data analysis, interpretation and display.
Experimental
I2LD-FTMS System
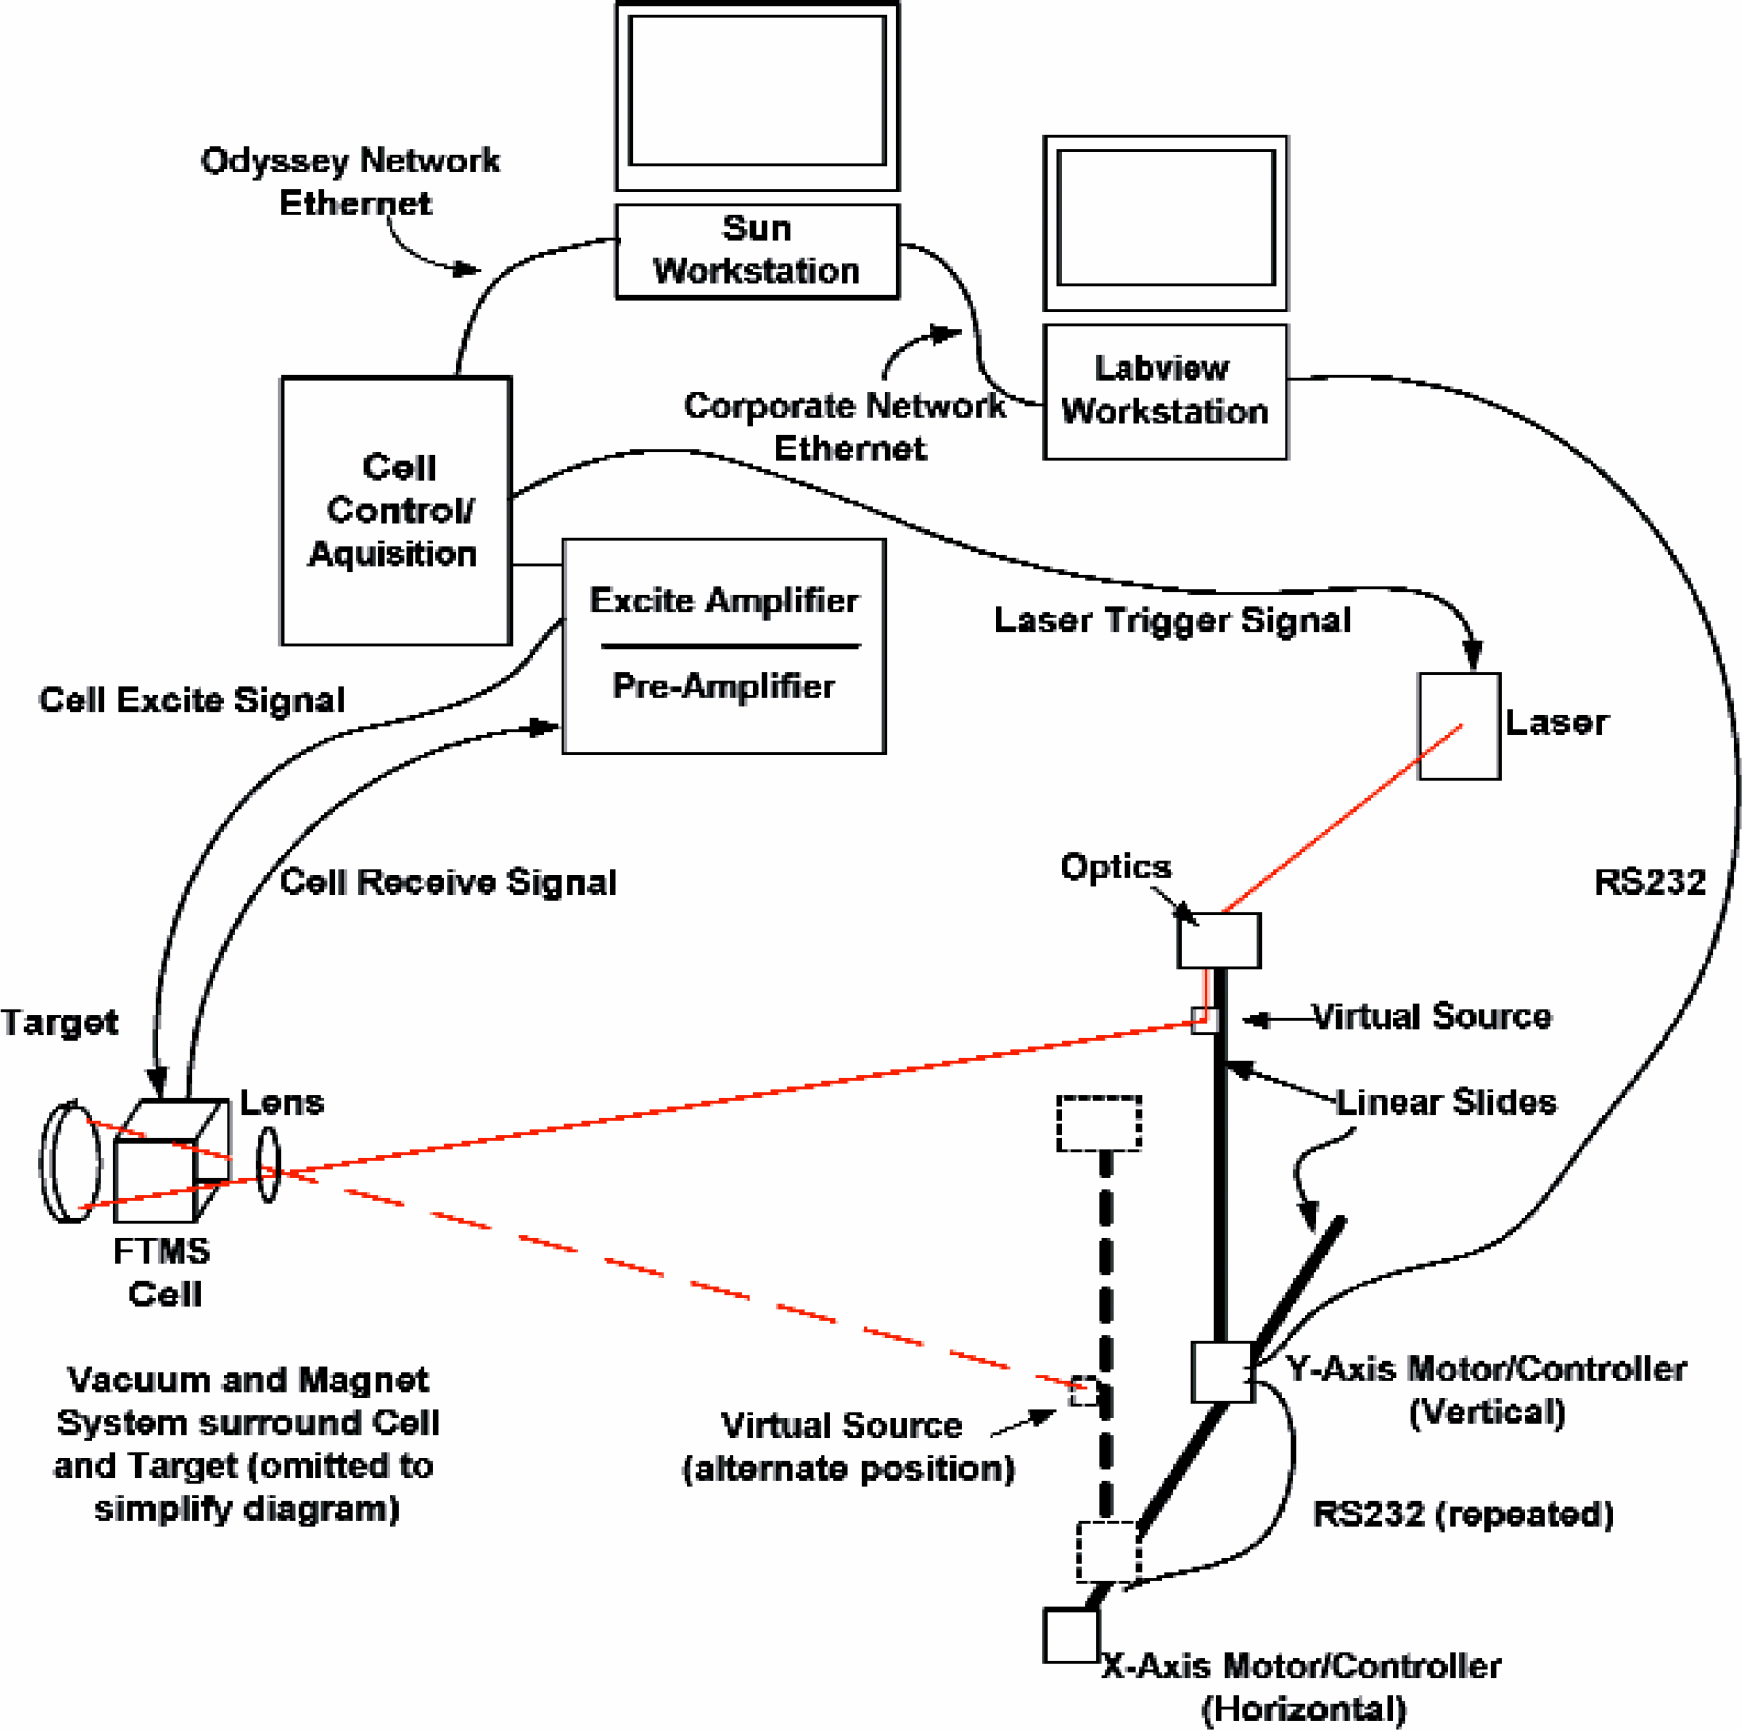
The strengths of Thermo-Finnigan's (Bremen, Germany) Odyssey 5.0, API Control motion controllers (Amherst, New York), and a custom National Instrument's LabVIEW 6i (Austin, Texas) program are combined into INEEL's automated FTMS imaging tool. Figure 1 shows a simplified diagram of the laser beam positioning and FTMS systems. The Odyssey system runs on a Sun Microsystem (Palo Alto, California) workstation running Solaris 2.5.1 UNIX operating system. The Odyssey system consists of the software and the Cell control/acquisition electronics, which also have outputs to trigger the laser system. The Odyssey system is connected to a Dell (Round Rock, Texas) workstation, running Microsoft's Windows 2000 (Redmond, Washington), through INEEL's corporate Ethernet. The Dell workstation is physically connected to the API Control motion controllers for the laser scanning system through a chained RS232 serial bus. There are two motion controllers (horizontal and vertical), to control the linear slides, which position the virtual source optics that direct the laser towards the center of the focusing lens. Each controller is set with unique bus identification (ID). If the ID of the first device on the chain does not match a received command it repeats the command on a separate RS-232 bus to the next device on the chain. The motor controllers can be run open loop, relying on counting the step movements of the motors; or can be configured to use linear optical encoders attached to the linear slide to provide feedback for actual movement of the slide. Although the linear encoders can also have magnetic-mechanical ZERO indicators that the controllers can use to synchronize their position with the origin, we do not utilize this feature because the magnetic field radiating from the unshielded 7 T superconducting magnet interferes with these indicators at distances of less than 10 feet from the magnet. We also intended to use the linear encoder's magnetic limit switches to stop the motors if a user attempted to move them beyond the usable range of the system. Of course, the magnetic field also prevented the use of these sensors; therefore, we place limits in the software that will not allow a user to select positions outside of a specified range. Additionally, the system is mechanically limited by the slide, as the motors will stall at these mechanical limits.
FTMS Parameters
A thin section of basalt was used as the sample. The sample was mounted on a stainless-steel probe tine with double-sided tape (3M, St. Paul, MN) and located 0.5 cm from the front trap plate. During the ionization event, the potential on the front and rear trap plates was maintained at 0 V. After ionization, a trapping potential of 1 V was applied to both front and rear trap plates and maintained until the quench event at the end of the sequence. A chirp over the range of 50 to 4000 kHz with a sweep rate of 3600 Hz/μs was used to excite the ions. After a delay of 0.6 ms, the ions were detected in direct mode using 64K data points. The total time for FTMS sequence of events was 0.5 s. Pressure during analysis was 5 × 10⁻⁸ torr. External calibration of the system was performed using sodium-attached polyethylene glycol 1000.
Results & Discussion
Acquisition/Positioning Software
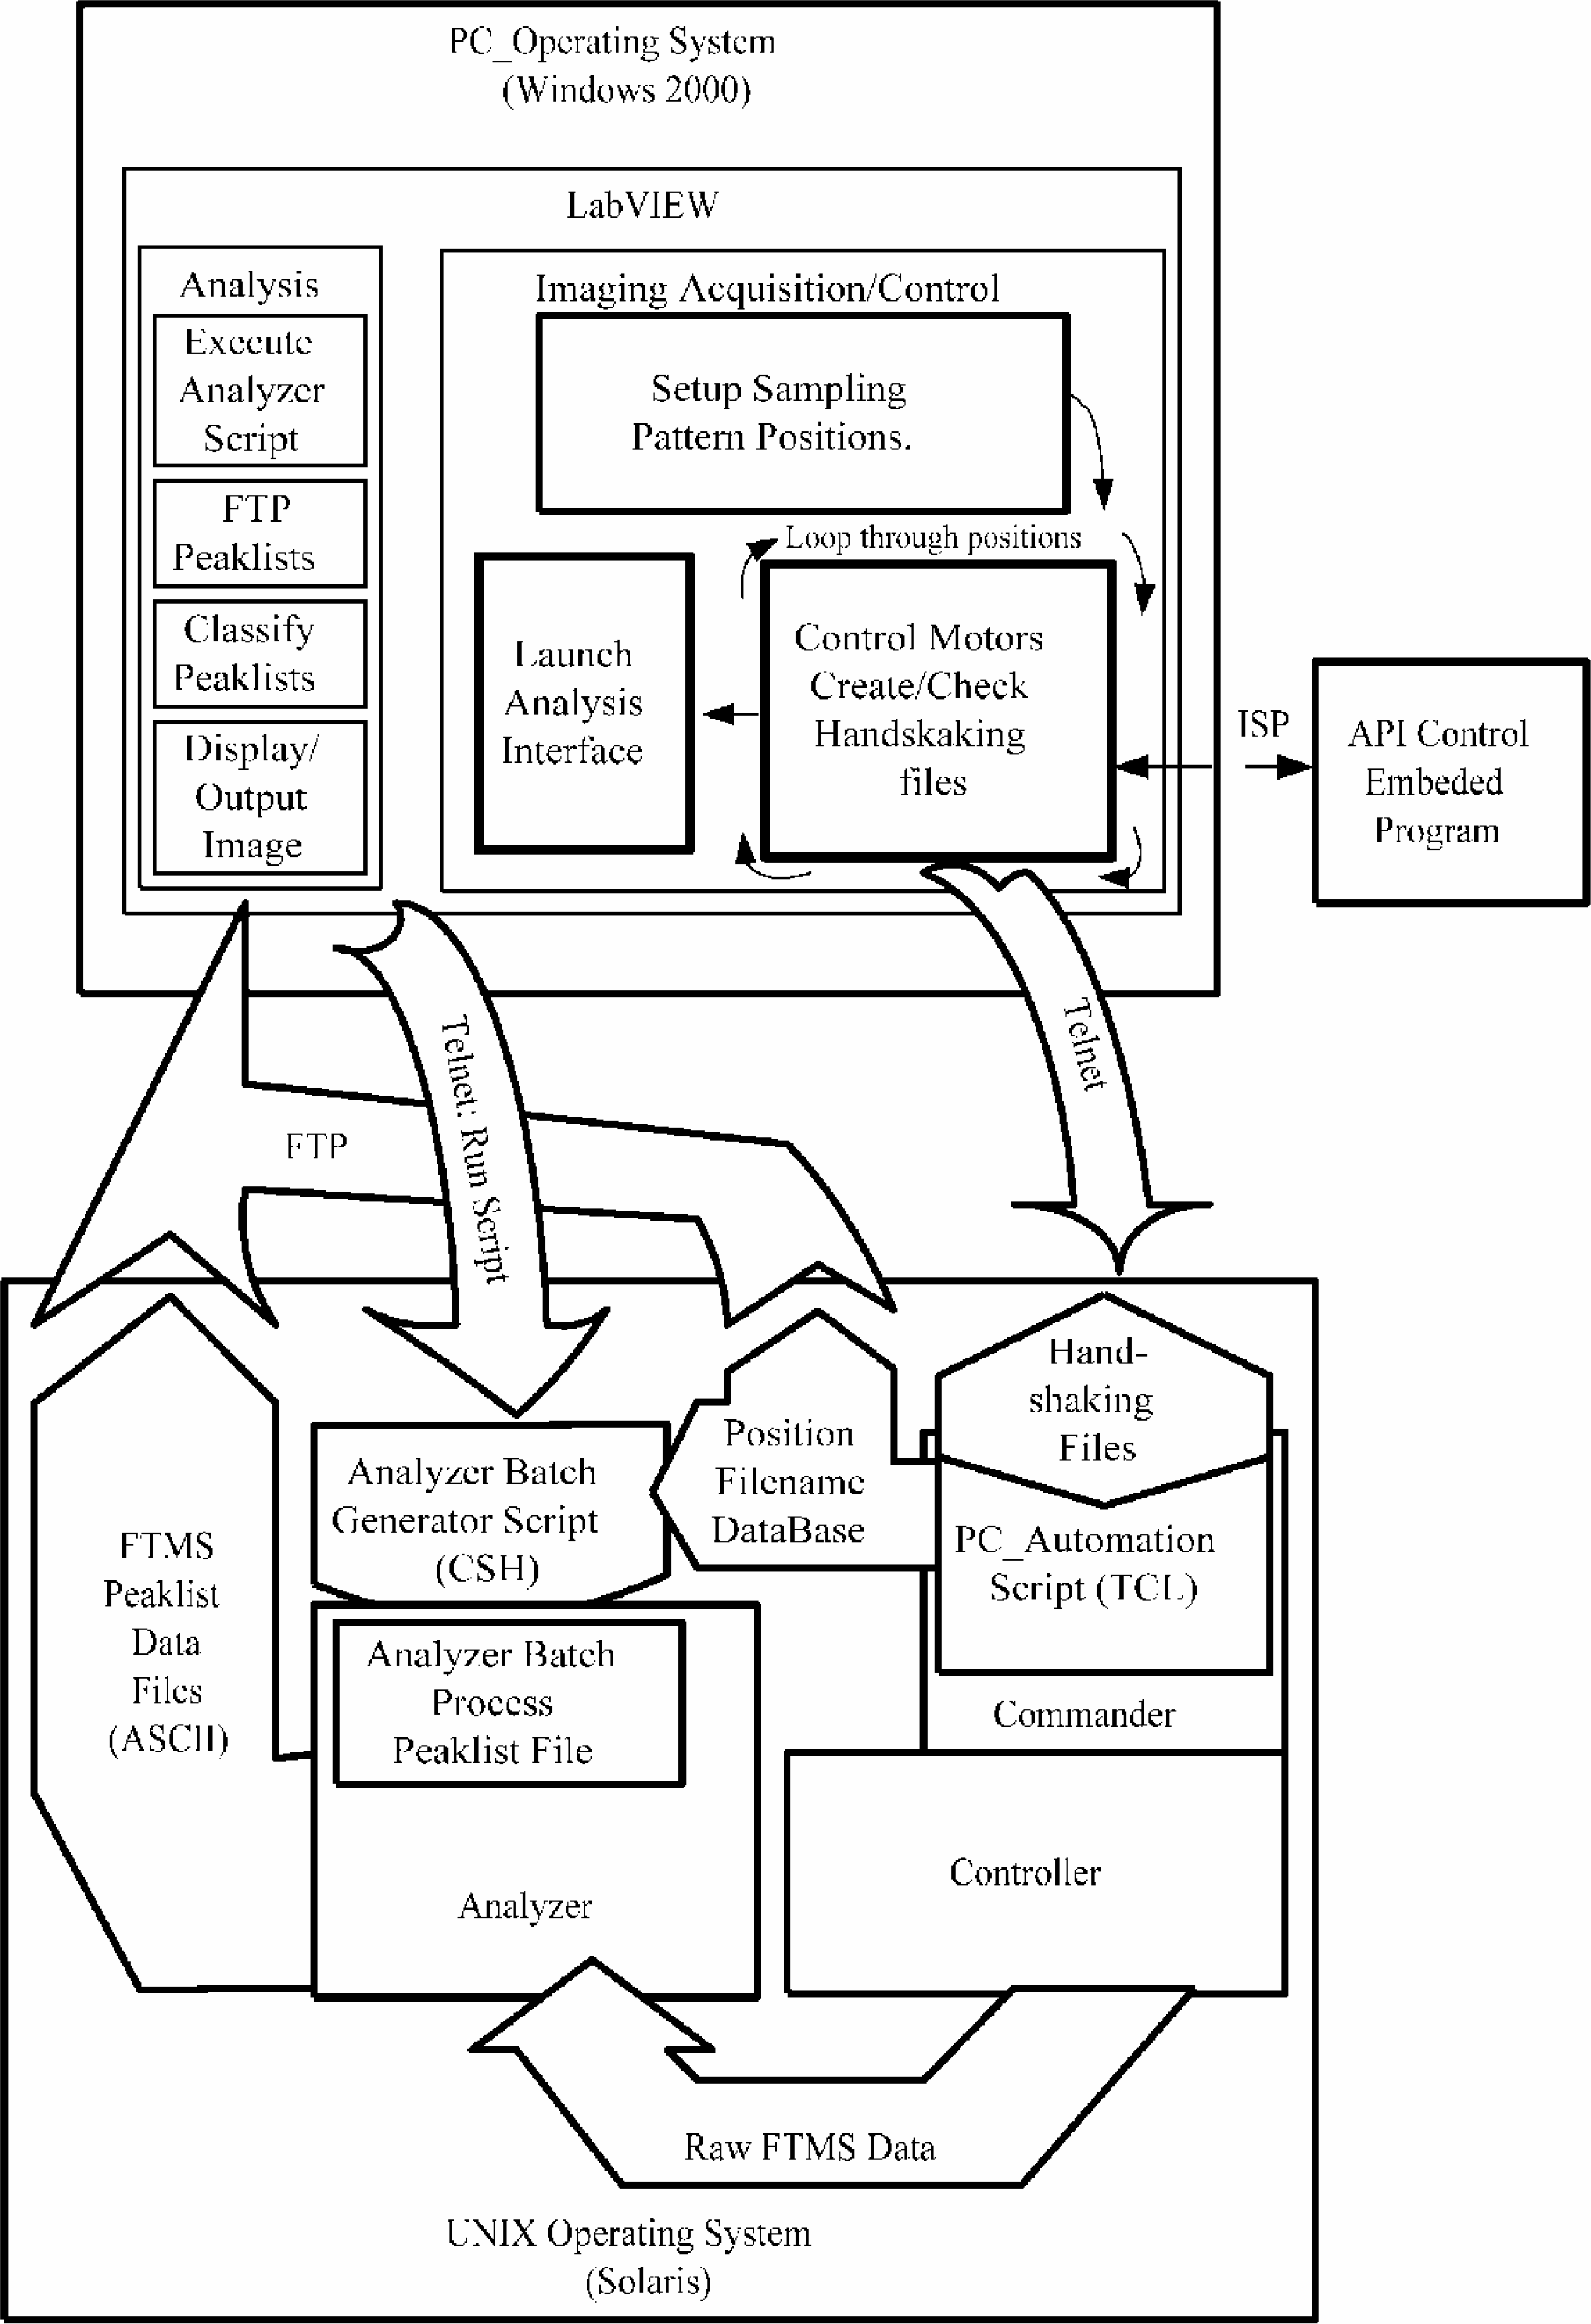
National Instrument's LabVIEW 6i programming tools were chosen to develop our central user interface because they provide a flexible graphical programming environment for easy access to various peripheral ports. The GUI (LabVIEW front panel) is created simultaneously to development of the program, reducing the effort necessary to create a user interface. We also make use of the LabVIEW Internet toolkit to allow telnet and file transfer protocol (FTP) access to the Sun Microsystems workstation running the Odyssey software. Telnet is used to access and create handshaking files on the UNIX files system. FTP is used to transport data files from the UNIX file system for processing by the analysis program. The motor controllers are accessed through API-Control's Intelligent Servo/Stepper Protocol (ISP). The first setup process is for adjustment of the origin of the laser positioning system. The operator may then adjust the position of origin to a new location, if needed. Figure 2 contains a block diagram of software integration.
The central GUI allows the user to configure the pattern of the sampling points on a target. The user sets the center point of the region of interest, the size of the region of interest, and the spacing of sampling points. Each of these parameters can be set independently for the horizontal and vertical axes. As the user changes the parameters, a graph shows the chosen pattern as illustrated in Figure 3. The LabVIEW program can easily be modified to create custom laser desorption patterns for imaging. The program provides two default patterns: an equally spaced, square matrix, or closest packed, hexagonal matrix, with variable spacing between desorption locations for undersampling or oversampling. As seen in the scanning electron micrograph in Figure 4, the user defined desorption pattern is accurately rendered on the sample by the system.
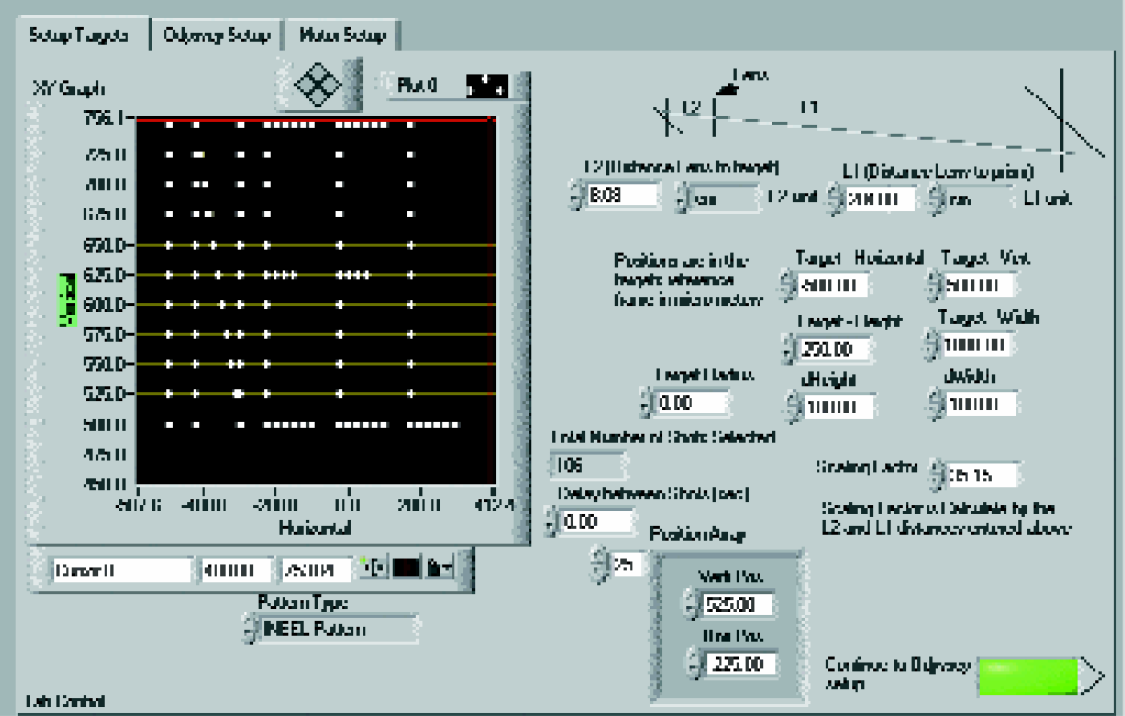
Screen shot of LabVIEW GUI showing “INEEL” desorption pattern.
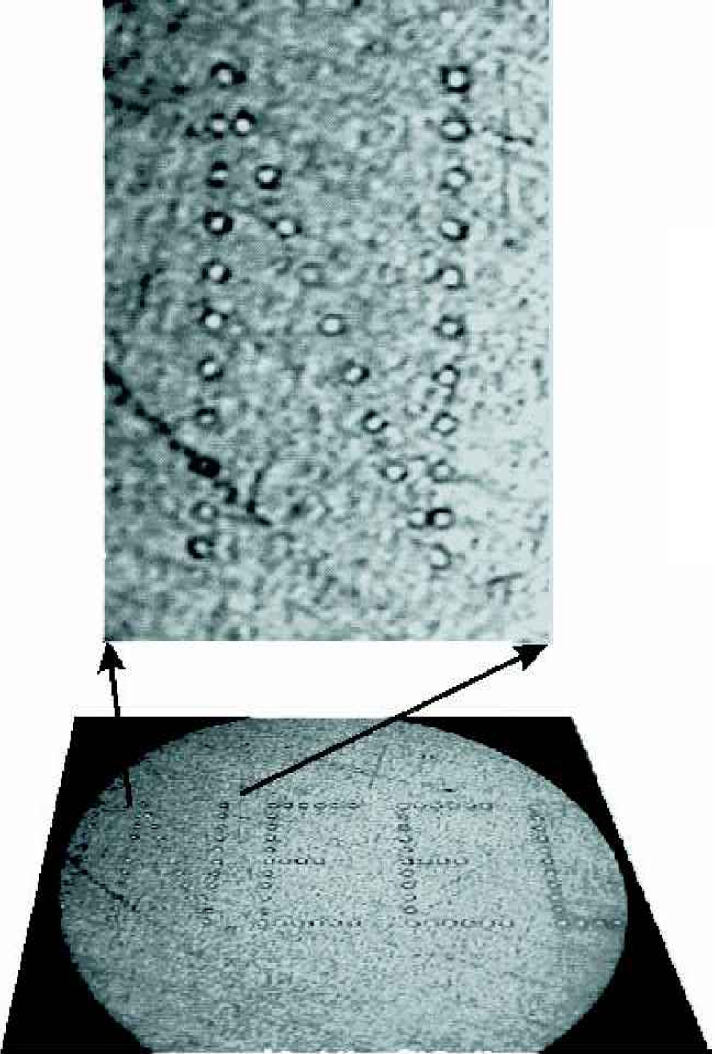
Micrograph of INEEL” on aluminum foil (magnification 100x).
The program uses telnet to login to the UNIX workstation and to start the Controller with the specified script file, if the Controller has not already been started on the UNIX workstation. The automation controls the position of the motors by setting position variables in the API motor controllers embedded program, through ISP. Control of the Odyssey Controller acquisition program happens through a set of handshaking files on the UNIX operating system. The Controller is designed as a GUI. Under normal operation, the user would execute the Controller, set parameters or load a script, and then press the RUN button on the GUI with a mouse click every time a set of data is to be acquired. Automation is achieved through an Odyssey program related to Controller called Commander. The Commander provides the user with a mechanism to create macros or short cuts to commonly used sequences of commands. The macros use the scripting language called Tool Command Language (TCL). This is the backdoor that allows us to write the PC_Automation script, which creates a polling loop that looks for the set of handshaking files to coordinate the acquisition of data with separate motion controls. Unfortunately, Commander cannot be instructed to load PC_Automation at startup; so, at the present time, the system requires the user to load the script into Commander with a macro shortcut. The interface clearly instructs the user how to load the script.
Through telnet the LabVIEW program creates a file, called start_acq, to indicate that the motors have been positioned and data should be acquired. This file also contains the horizontal and vertical position of the current acquisition spot for use in building a data file versus position database. When PC_Automation finds this file it instructs the controller to fire the laser and acquire an FTMS data file. It also writes the position and filename to a database file for use in displaying the image results and deletes the start_acq file. PC_Automation creates a file, acq_done, to indicate the acquisition is done. To remove the latency of waiting to move the motors while the Controller is still acquiring data (in some configurations this can be a substantial amount of time), the acq_done file is actually created immediately after the command to fire the laser is given. A minimum delay is in place to insure the laser has fired before the motors move.
The LabVIEW program waits until it finds the acq_done file to continue to the next spot. This process is repeated for all positions in the pattern. When complete, the program creates a file, stop_prog, to tell the PC_Automation script to terminate. Finally, another LabVIEW interface for analysis of the data is launched. Detailed flow diagrams of the acquisition programs are included in the Appendix.
Automated Data Analysis
Traditionally, the user would analyze the data using another Odyssey program called the Analyzer. However, this requires the user to look at the file for every spot and classify it—an enormous task for the potential number of spots. Therefore, we have developed an analysis inference engine for interpretation and display of spectra classifications. The inference engine is beyond the scope of this scientific brief; however, we will explain the process for retrieving spectral information from the Odyssey data files into a non-proprietary file format.
Analyzer 5.0 does have many useful features, which include the ability for processed data (spectra) to be converted into ASCII files. ASCII versions of peaklists also can be obtained by printing them to a file. Additionally, all data files in a given folder can be batch processed; however, there is not a way to save each ASCII file with a unique filename with this batch method. Therefore, a UNIX script written in C-shell, which can be invoked through command line, was developed to generate an Analyzer batch-processing file that assigns a unique file name for each ASCII output files for every raw data file. This batch process file is allocated a name that is assigned to a specific function key, F2, operation. The analysis LabVIEW program, shown in Figure 5, starts this process by executing the C-shell script and then prompts the user to press the F2 key, with the Analyzer window open, to automatically generate an ASCII file for each spot in the acquired pattern. After the peaklist files are generated, the LabVIEW program downloads the peaklist and position databases to the Dell Workstation. Note: it is possible to generate ASCII spectra instead of peaklists and have the inference engine interpret them; however, the spectra files are much larger than the peaklist files.
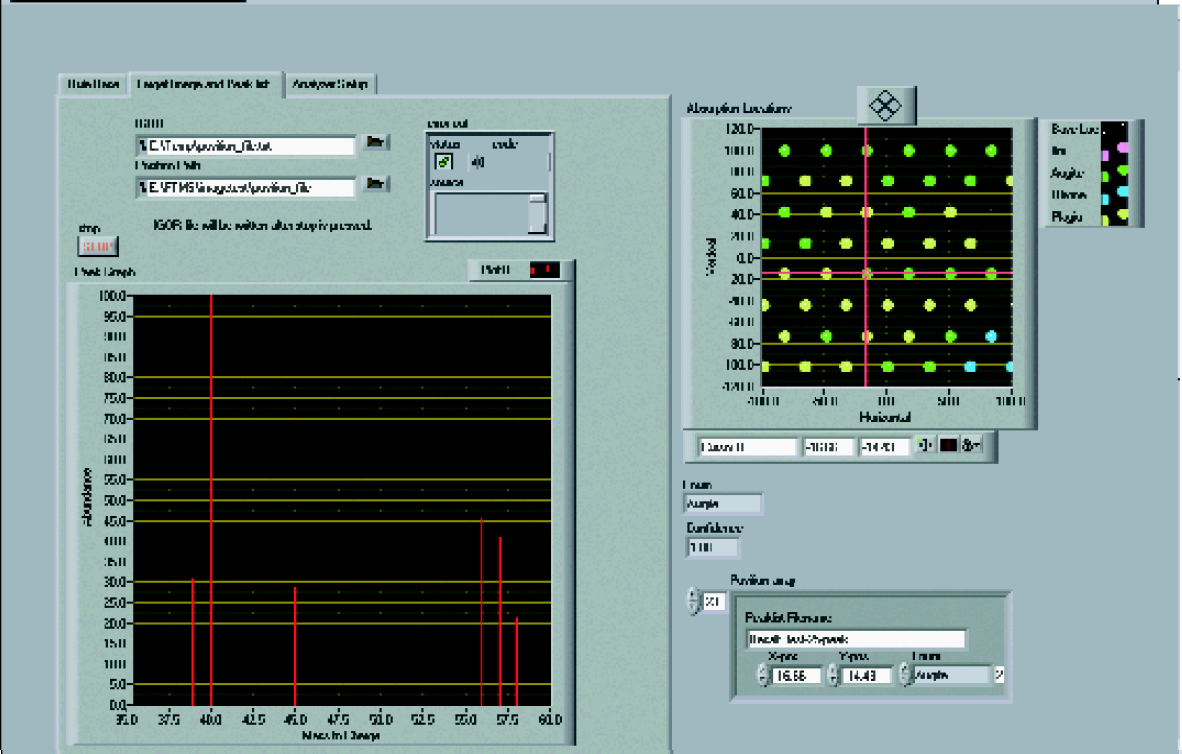
Screen shot of LabVIEW analysis GUI showing one sample run image and one line spectra based on a spots peaklist.
Each peaklist is then assigned a value or color based on the m/z peaks present and their relative abundance by the inference engine. The values are displayed in a scaled map of the spots using the position database and the results of the inference engine. The map also has a data point selection feature. By dragging the cursor to a position of interest, the line spectrum based on the peaklist is displayed, so the user can check the inference engine's results. An output file is generated which is appropriate for input into a professional graphing package. We have used a variety of graphing packages. Figure 6 illustrates the difference between IGOR Pro 4 (WaveMetrics, Lake Oswego, Oregon) and other graphing programs (i.e. Origin 6, Microcal, Northampton, MA). Many graphing programs produce an image that appears to be continuous because they interpolate between pixels of the desorption pattern, see Figure 6A. In other words, they cannot account for the “dead” space around the circular laser desorption spots. IGOR Pro 4 provides the flexibility to replicate any laser desorption pattern, as shown in Figure 6B, including closest packed where the rows of laser shots are offset. Because IGOR Pro 4 allows us to customize the pixel size according to actual spot size, we can accurately reflect true image patterns.
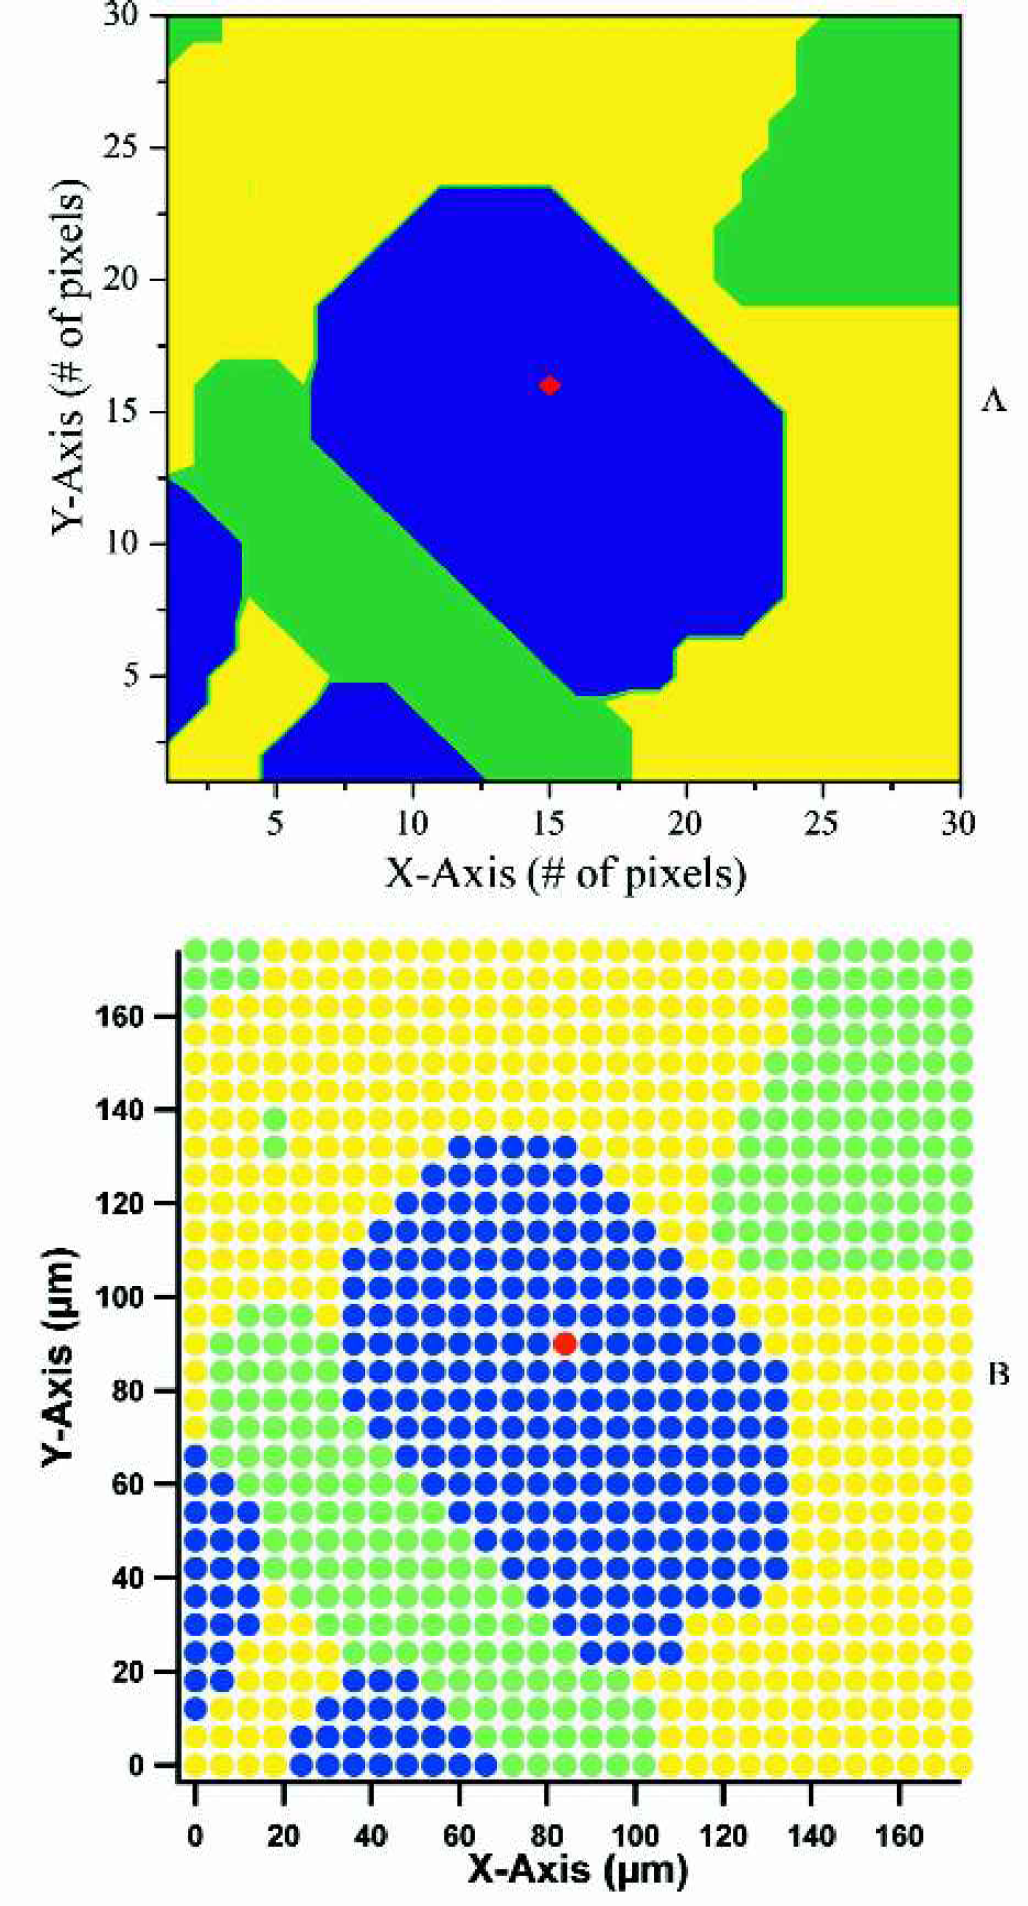
Image of basalt thin section using A) Origin 6 and B) IGOR Pro 4. Mineral type indicated by color: blue = augite, red = chromium in augite, green = plagioclase, and yellow = olivine.
As a side note: It is possible to avoid the necessity of having the user in proximity to the Sun Microsystems workstation by using an X-windows emulator, such as StarNet Communications Corporation's (Sunnyvale, California) X-Win32, to display the Controller and Commander windows on the PC running the LabVIEW program. A program like Symantec's PCAnywhere (Cuppertino, California) could also be used to show the desktop of the Dell Workstation at a remote terminal to allow remote setup and start. In general, since the target must be loaded into the system, remote location of the controlling system is not critical, although addition of remote monitoring would be useful and is being considered.
Automation Performance
The rate at which the system can collect and process data is a function of several variables. The acquisition rate is determined primarily by the longer of two temporal parameters: the FTMS script time (TF) chosen for the Controller and the positioning delay for the motor system. There are also two distinct positioning delays. One delay for horizontal movements, Th, is typically very short, and one for vertical movements, Tv, which, due to the thread pitch of the linear slide, is significantly longer. A sorting of target positions is done to ensure the minimum number of vertical moves. For a regular rectangular array which is N columns by M rows the expected elapse time would be:

where TL are small network latencies and TI is the move time to the initial location. As an example, a typical TF of 0.5 s is significantly larger than the movement delays for 10 μm spot size with 2 μm spacing (12 μm center-to-center spacing). For 12 μm spacing at TF = 0.5 s, the system can cover slightly more than 1 mm2/hour. For comparison, TOF mass analyzers can acquire data more rapidly because they operate in the microsecond regime as compared to FTMS (typically milliseconds to seconds). However, Caprioli and Chaurand 22 reported that their imaging TOF acquisition rate was on the order of 1 spot/s, which is essentially the same time-scale as our imaging FTMS system.
The primary delays in the analysis process are the creation of the peaklist in the batch process and the download of peaklists to the Windows 2000 file system. The batch process for creating peaklist creates approximately four peaklist files per second. This varies based on the number of data points in the raw data file. The process of downloading the files also varies depending on the file size of the peaklists (a function of the detail and range used in generating the peaklist). Our estimate for the example above is 40 minutes to create the output mapping of a data set that took one hour to acquire. Although this is purely an estimate, even if it took as long to process as to acquire, the timesaving is enormous. We estimate that an experienced FTMS technician could only classify 160 spectra per day.
Issues
There continue to be two issues with seamlessly automating this process from the LabVIEW interface. The first is the requirement that the user start the PC_Automation script in the Commander. The second is requiring the user to press F2 in the Analyzer. Both are due to Odyssey's GUI-centricity. If Finnigan were to develop a new version, a useful change would be to add hooks to allow these types of interaction to occur at the command line level. As it stands, the system provides INEEL with an invaluable tool that makes imaging a sample possible.
Future Directions
Our current emphasis is improving the data analysis and display because of the enormous amount of data that can be acquired from a single 19 mm diameter sample (∼2.6 × 10⁶ files with 10 μm spots). Primarily, we are still working on enhancing the intelligence of the software for assigning values to the individual spectrum or peaklist.
Acknowledgments
We would like to thank Tony von Sadovszky, for helpful conversations regarding the Odyssey software. The authors also gratefully acknowledge support from the United States Department of Energy, under contract DE-AC07–99ID13727 BBWI.
Appendix
For those readers who wish more details on the automation programs, detailed flow diagrams are provided in this appendix in Figures A1–A3. Some additional details not covered in the main text are also included here.
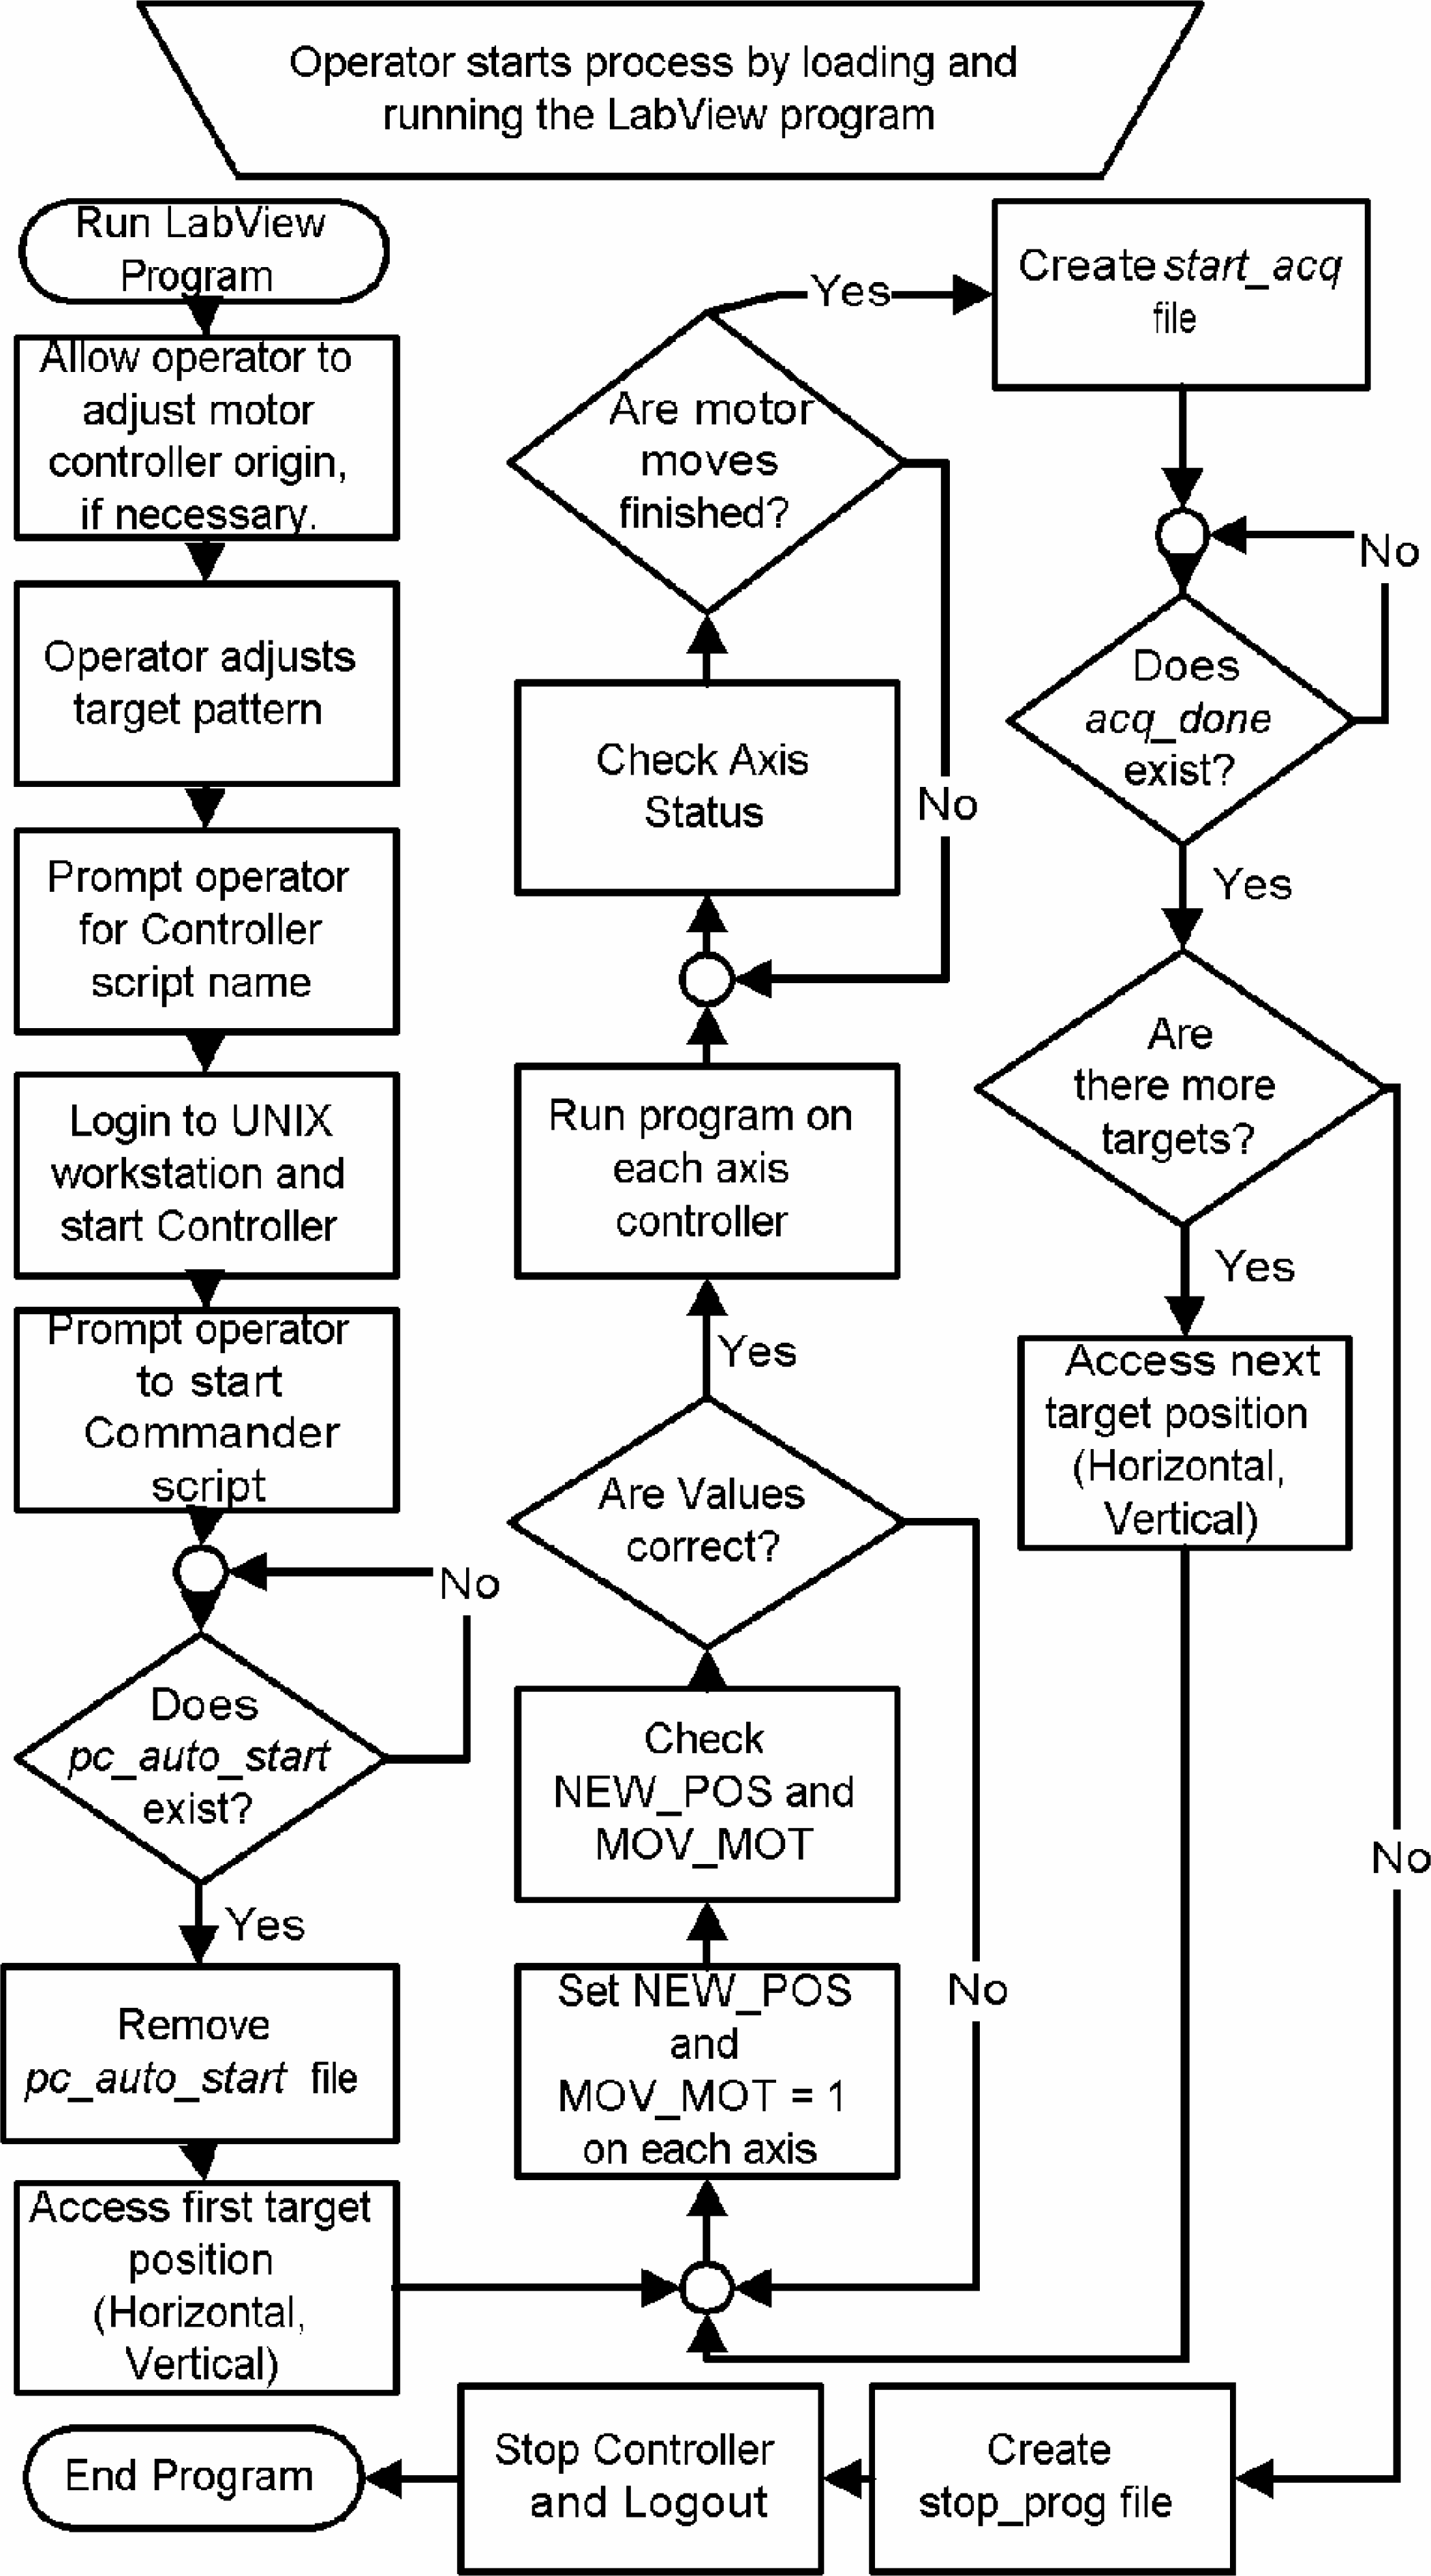
The LabVIEW program flow is described in Figure A1. When the user is prompted to start the PC_Automation script, the program waits for a file called pc_auto_start to be created by PC_Automation, before continuing into the loop. The flow chart in Figure A1 shows the variable names that control the API Controls motor controller's programs. Figure A2 shows the flow of the PC_Automation TCL script which runs in the Commander. The user has to enter “sa” into the Commander to load the script with a macro loaded into the user's .commander setup file. The .commander file would ideally load the script when the Commander was started, but handshaking between Commander and Controller cannot be completed if this is done. Figure A3 shows the embedded program in the API Controls stepper motor controller. It contains the loop that is used to set the origin of its coordinate system to the current position as well as the movement loop. The program sets the variable to the appropriate values and then runs the program. Move completion is determined by polling the status of motor controllers through the ISP interface.

Flow diagram of the Commander script and the interface to the Controller and UNIX file system.

Flow diagram of the motor controller program and the software interface to the PC.