
Abstract
This paper is about the automation of the pre-analytical phase in a biochemical laboratory, which performs more than 3.7 million tests per year. The paper presents how an investment in the laboratory can be evaluated considering both economic criteria, future performance and service quality. The study comprises a workflow analysis of biological materials and information, the corresponding data collection and the use of simulation for performance evaluation. Alternative scenarios have been considered in terms of personnel, pre-analytical devices and management policies. The final scenario has been chosen according to economic criteria among a set of feasible scenarios, able to satisfy constraints.
Keywords
INTRODUCTION
Increasing attention to automation in clinical laboratories is due to the necessity of optimising health care costs (and among them the laboratory costs), to the strong willingness to reduce medical errors, and to a major attention to technicians' safety. Laboratories without enough space or money for a TLA are planning a gradual approach: pre-analytical automation is the first phase. The pre-analytical phase is commonly considered a very critical stage in the laboratory process because it is a very labour intensive area in which there are no economies of scale. Moreover it is still the phase with the highest risk of injures for the workers and the highest prevalence of human errors.
The effectiveness of automation is sometimes evaluated considering a fixed number of samples a day as a break-even point, not considering the pecularities of the laboratory. According to this theory, automation is not adequate if the number of samples received daily by the laboratory is lower than the break-even point. Otherwise it is reasonable.
This paper shows how an investment in the laboratory can be evaluated not only under an economic point of view, but also considering its future performance and service quality. In this way, the laboratory director can be more confident in evaluating the investment, being able to foresee the costs, the levels of performance and the service quality. According to these criteria, the general director and the customers would evaluate the laboratory. On the basis of this the laboratory can be evaluated by the general director and by customers.
The goals of the study are to understand how the future configuration would work and to provide a performance and economic evaluation, prior to implementation.
The main concept is that pre-analytical functions are carried out by an integrated system, composed of personnel, mechanical devices and management rules. The complexity of the system does not allow us to consider each device individually, because there is a large variety of interactions among the different parts of the system itself. For instance, the throughput of a pre-analytical device is highly influenced by the preceding centrifuge's capacity. Different techniques can be used to evaluate the performance of a system, but to take into account this kind of complexity without introducing strong simplifying hypotheses, simulation has been employed. Simulation allows us to answer what-if questions about the future system and to make a comparison of different scenarios of the possible future laboratory. The evaluation of future system performance allows those responsible for the investment to clarify whether or not the new hypothetical solution is able to satisfy the fixed service quality threshold and if the investment is viable from an economical point of view. Using simulation, performance evaluation and comparison are possible without the costs and the disadvantages of the experimentation with the real system.
The realisation of a simulation model requires a deep knowledge of the system, and a close co-operation between the laboratory director and the laboratory personnel. Simulation is useful only if the laboratory is able to identify itself in the model: its resources, management policies and goals have to be designed in accordance with the director of the laboratory in order to be realistic. The simulation model requires validation to verily if the model acts as the real system. There are several methods of validation. For instance, it is possible to perform a sensitivity analysis to test the coherence of the model behaviour, or to ask for the opinion of the experts in the field, or to make a comparison with reality or with an alternative validated model. Only after the validation is it possible to make any decision on the real system based on the results of the simulation model.
The first part of the study has been dedicated to the system comprehension, to the workflow analysis, to the data collection, and to the description of the current procedures. During the second part of the study, a set of alternative scenarios has been designed, a simulation model of the pre-analytical phase has been realised and the criteria for the scenarios evaluated have been defined. The third part is dedicated to model validation, to experimentation on the model, and to performance evaluation.
CURRENT PRE-ANALYTICAL PHASE IN THE LABORATORY
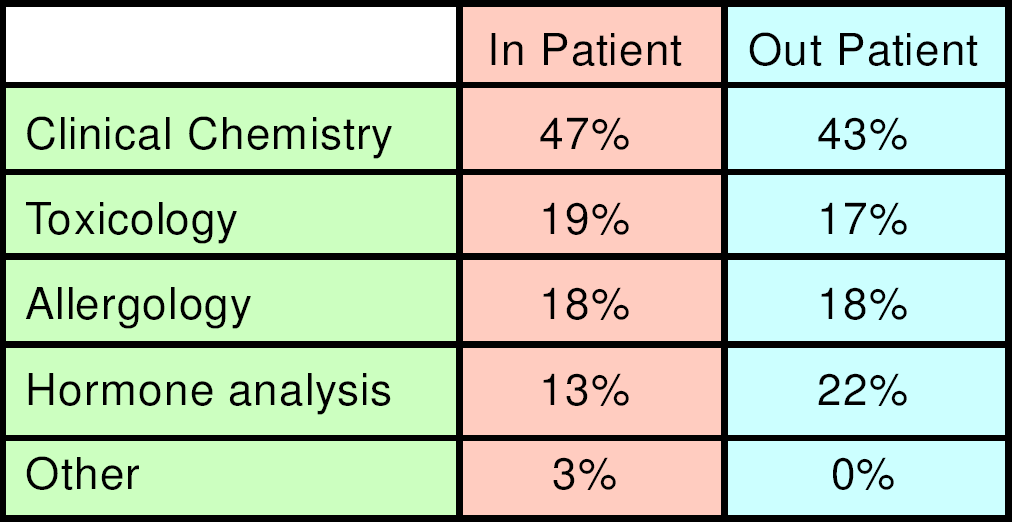
The aim of this work is the analysis of the design of automating the pre-analytical phase in a clinical laboratory which performs more than 3.7 million tests per year in biochemistry, clinical chemistry, haematology, and molecular biology. The laboratory in question belongs to the biggest hospital in Milan, Ospedale Niguarda Ca' Granda; it performs 2.4 million tests per year in the routine laboratory sections. The numbert of tests performed for in-patients and for out-patients is in equal proportion. Different procedures for internal and external samples are due to the fact that currently a direct connection between the LIS (Laboratory Information System) and the HIS (Hospital Information System) is not available.
Workflow analysis of the pre-analytical phase has been done, both for biological materials and for information (See Table 1). For inpatients, (see Figure 1) doctors in the ward do the laboratory test request. Nurses complete the pre-printed request form ticking the requested exams and adding the patient's personal data and patient id (univocal numeric code that identifies the specific admission assigned to the patient at hospital reception). The request form is a module with a pre-printed list of possible exams and adhesive barcode labels for the preparation of the collection tubes. The barcode has a numeric code for tube identification (human and machine readable) and contains the indication of the cap colour of the tube to be used. Each colour, or set of colours, corresponds to a laboratory section. After the phlebotomy, the nurse inserts the request module and the bar-coded specimens in a plastic bag for transportation of biological specimens. Every morning, at 7:30, 9:00 and 10:30, a hospital attendant collects plastic bags at several points close to the wards and delivers them to the sorting area in the laboratory. In this area five people open the bags, extract the request forms and insert the tubes in racks to be carried to different analytical sections inside the laboratory, according to the colour of the cap. During this phase, technicians also check that the number of tubes corresponds to the number of bar-codes detached from the request form. This is the first opportunity to find out if any tube is missing. The request forms are delivered to an area where administrative personnel insert the test requisitions in a LIS terminal by reading them with the optical mark reader, or typing them on the keyboard.
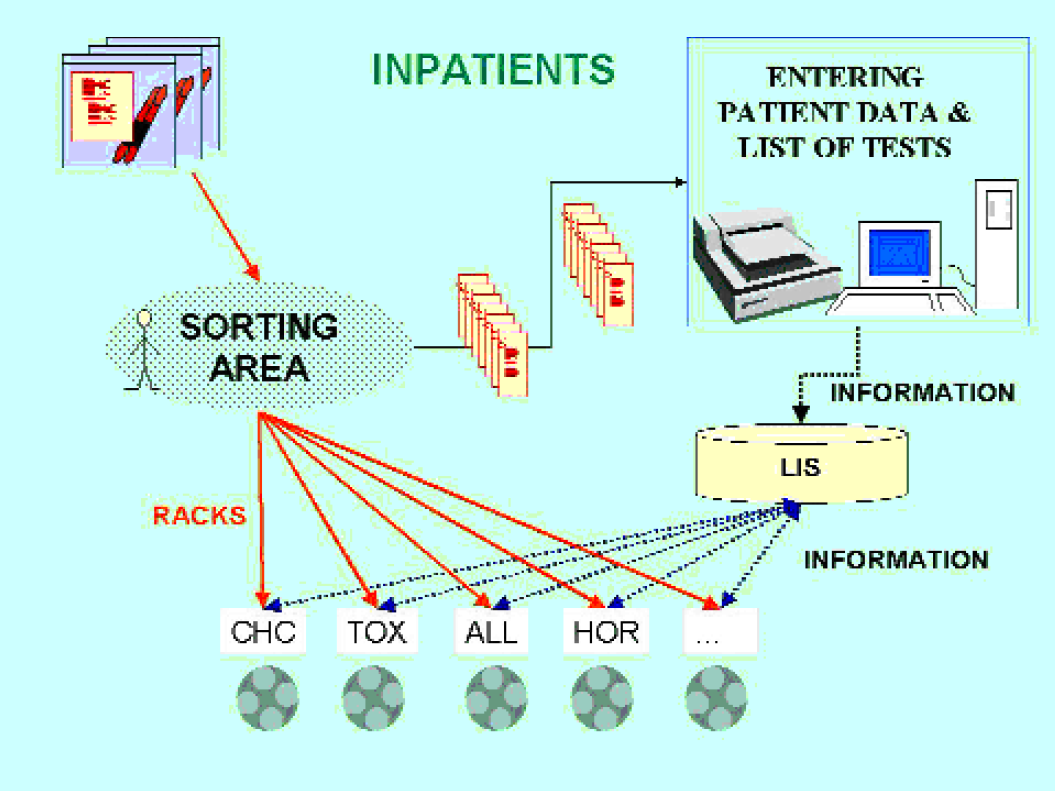
Flow of information and biological material for in-patient
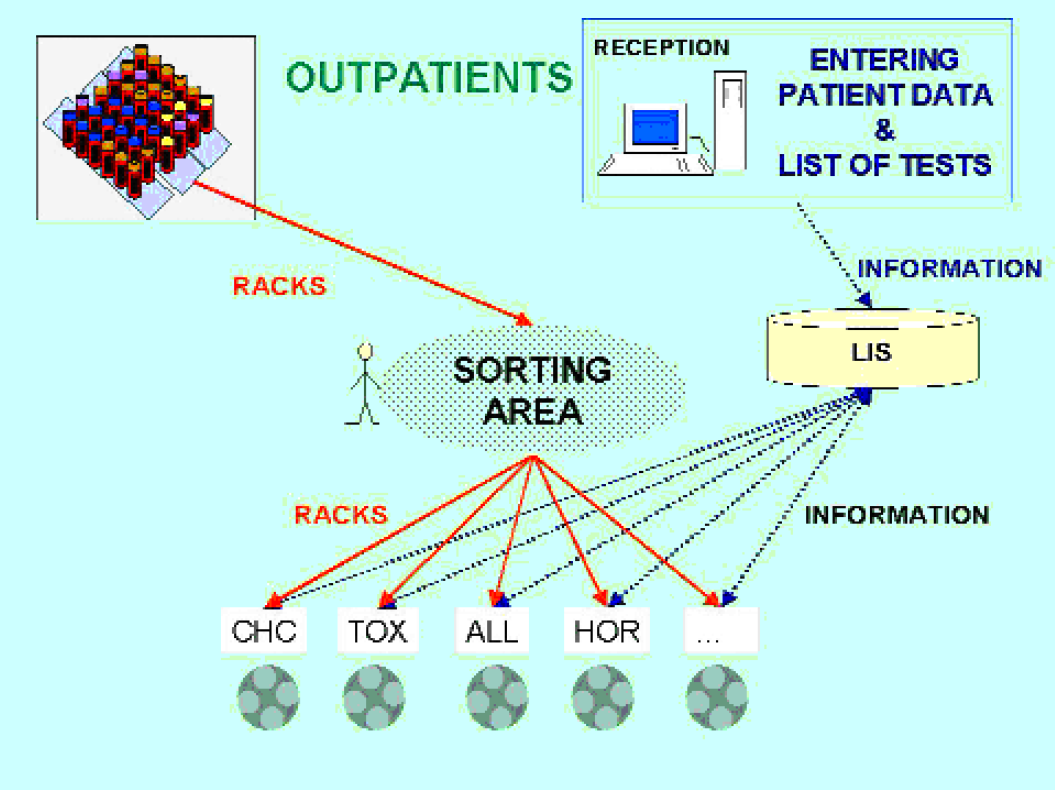
Outpatients (Figure 2): At reception, personal patient data and the list of required tests are entered by administrative personnel in the LIS. The LIS prints automatically the barcode labels for the collection tubes; attendants in the back office perform the labelling of the tubes. After phlebotomy, the specimens are stocked in racks and delivered to the sorting area four times a day, every hour from 9:00 AM onward. In the sorting area tubes are treated as described above.
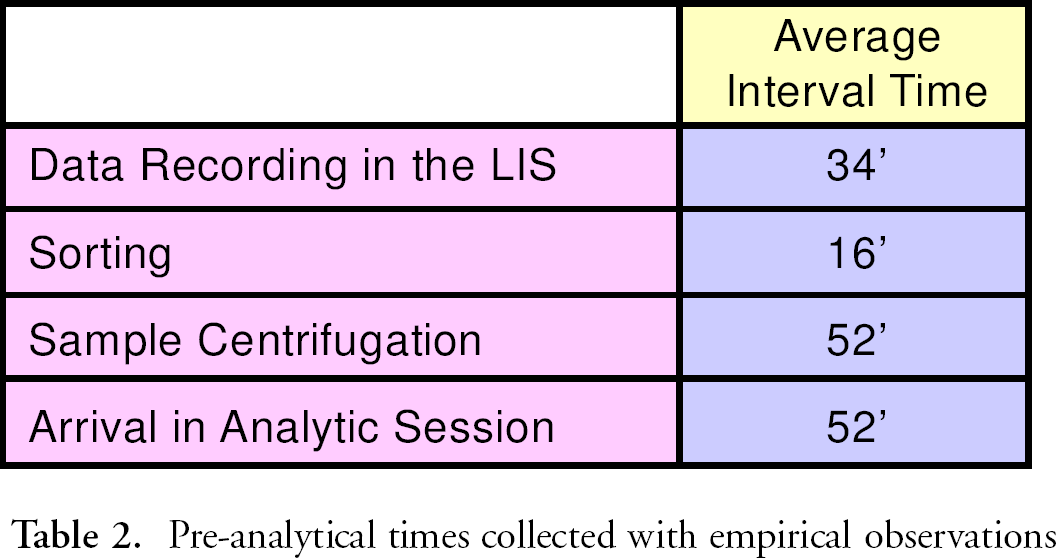
In this study data collection has been done using both data available in the LIS and data collected from direct workflow observation. The time of the registration of a request, of technical validation, of clinical validation and of final printing of results has been extracted from the LIS. These data provide information on the total flow time in the laboratory, comprehensive for pre-analytical, analytical and post-analytical phases. Specific time checks have been performed in order to get information from each step of the pre-analytical phase: sorting time, data recording time in the LIS, tube loading time in centrifuges, tube loading time on the diagnostic device (Table 2).
Pre-analytical times collected with empirical observations
AUTOMATION OF THE PRE-ANALYTICAL PHASE: INTEGRATION BETWEEN LIS AND HIS
In general terms, the efficient flow of an automated pre-analytical phase is greatly conditioned by the presence of a connection between ward information system (HIS) and laboratory information system (LIS). The moment when the bar-code is scanned on the pre-analytical device is very critical because the instrument software needs information on which actions to perform on the specimen. The availability of an intranet allows wards to record directly the test requests and to print the bar-code labels for the specimen tubes in number and type corresponding to the tests requested. In that way the pre-analytical device, by reading the tube bar-code, is able to recognise the specimen and to get the necessary information from the host. This includes the number of aliquots to be prepared, the sample volume in each of them, the information to be printed on the bar-code of the secondary tubes, and the rack of final destination for the secondary tube. If the information is not available from the LIS when the barcode on the specimen tube is scanned, the tube is stocked in a rack for storage of unknown specimens.
AUTOMATION OF THE PRE-ANALYTICAL PHASE: CONFIGURATION
The lack of computer connection between the wards and the laboratory has been taken into account in the study during the design of the possible scenarios in order not to affect the performance. The main concern in the design has been to assure the timely recording of information in the LIS, before the specimens are scanned on the pre-analytical device. The specimens are centrifuged before loading on the pre-analytical device, and during this time interval the requests have to be registered into the LIS.
To find out the best configuration of the system, different scenarios have been defined. A scenario is composed of a pre-analytical area configuration and a set of management rules. In particular, a configuration is defined by
number of centrifuges
tube capacity of centrifuges
number of operators for the loading/unloading of centrifuges
number of operators for request forms recording
The management rules applied to each configuration are as follows:
priority of inpatient's samples over outpatient's samples
priority on arrival order within the inpatient's samples and within the outpatient's samples (FIFO)
the specimen tubes with no information available from the LIS are inserted again on the pre-analytic device every 20 minutes
the primary specimen is stocked and not used on the diagnostic process
each secondary specimen is used in a single diagnostic unit only
continuous access to pre-analytic device
Each scenario has to be evaluated according to some criteria defined by the laboratory director. For the evaluation it is possible to select several criteria: economy, throughput, reliability, etc. Not all the possible scenarios are feasible according to the selected criteria. Through simulation it is possible to select the set of solutions able to respect the defined constraints. From this set, the final scenario of the future laboratory is the one with the best performance. The choice within the set of feasible scenarios is consistent with the objective function, that is the mathematical translation of the laboratory goal and target performance. In the study, constraints about the service quality or the flow time have been fixed: the values of flow-time threshold result from the analysis of the real flow times and the target values. The selected constraints on service quality are the following:
percentage of internal patient's specimens with a flow time lower than 45 minutes ≥ 70% in 98% of cases
percentage of internal patient's specimens with a flow time lower than 70 minutes = 100% in 98% of cases
percentage of samples with no data available lower than 5%
As can be seen, to guarantee the feasibility of the problem, it is necessary to introduce a confidence interval for the constraints. Other constraints concern the resource saturation: an upper bound of 80% has been fixed. This limit is due to the fact that a saturation of 100% is not realistic. A person may be asked to do something else; to provide information to someone, to answer the phone or simply to have a coffee break. The same limit is valid also for a mechanical device in order to assure more reliability for the system: if a centrifuge is down, for instance, the others have a residual capacity to control the delay in the system.
saturation of centrifuge ≤ 80% in 98% of cases
saturation of operator for load/unload of centrifuges ≤ 80% in 98% of cases
saturation of operator for request recording ≤ 80% in 98% of cases
In the study case, the objective function which expresses the goal of the laboratory, is the minimisation of the total cost of the pre-analytical phase.

The costs are defined in terms of personnel (hourly cost). For each feasible scenario, the cost of the personnel has been calculated and a comparison with the cost of the current system has been done. The chosen scenario is the one with the lowest cost able to satisfy all the constraints.
AUTOMATION OF THE PRE-ANALYTICAL PHASE: SIMULATION MODEL
The simulation model is created in Arena 3.5, simulation software from Rockwell Software. The interface between simulation and Microsoft Excel for the data input is realised in Microsoft Visual Basic. Input data for simulation are provided by a tool that inputs the list of tests, outputs the number of primary tubes and the number and destination for the secondary tubes.
The simulation model represents centrifuges, operators for loading/unloading, operators for request recording, and the pre-analytical device. The model simulates the four arrivals of outpatients' samples and the three arrivals of inpatients' samples. As said before, inpatient samples are delivered in plastic bags, so that a few seconds must be dedicated for the extraction of samples and request forms. The incoming primary tubes are inserted in a queue, waiting for the loading of one of the idle centrifuges. The order of loading on centrifuges reflects a management rule of priority assigned to inpatient samples: even if an inpatient sample arrives later than an outpatient one, it is loaded before. Condition for the loading is that both operator and centrifuge have to be idle. At the end of the loading the operator is idle and he/she is able to perform other actions (another loading or an unloading, or 10% of the time other actions). After centrifugation, samples wait for a free operator to be unloaded and then they are inserted in a waiting queue for the pre-analytical device. The pre-analytical device is characterised by continuous access, and has an output of 600 secondary tubes per hour.
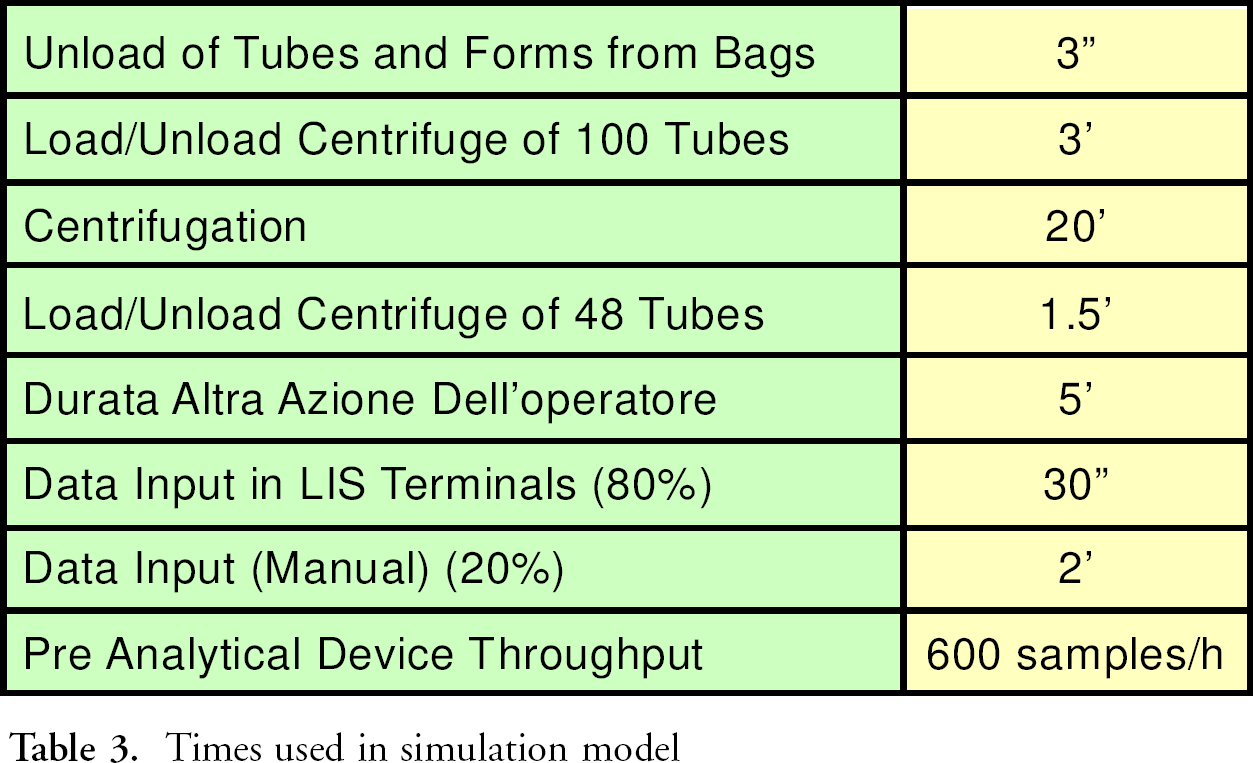
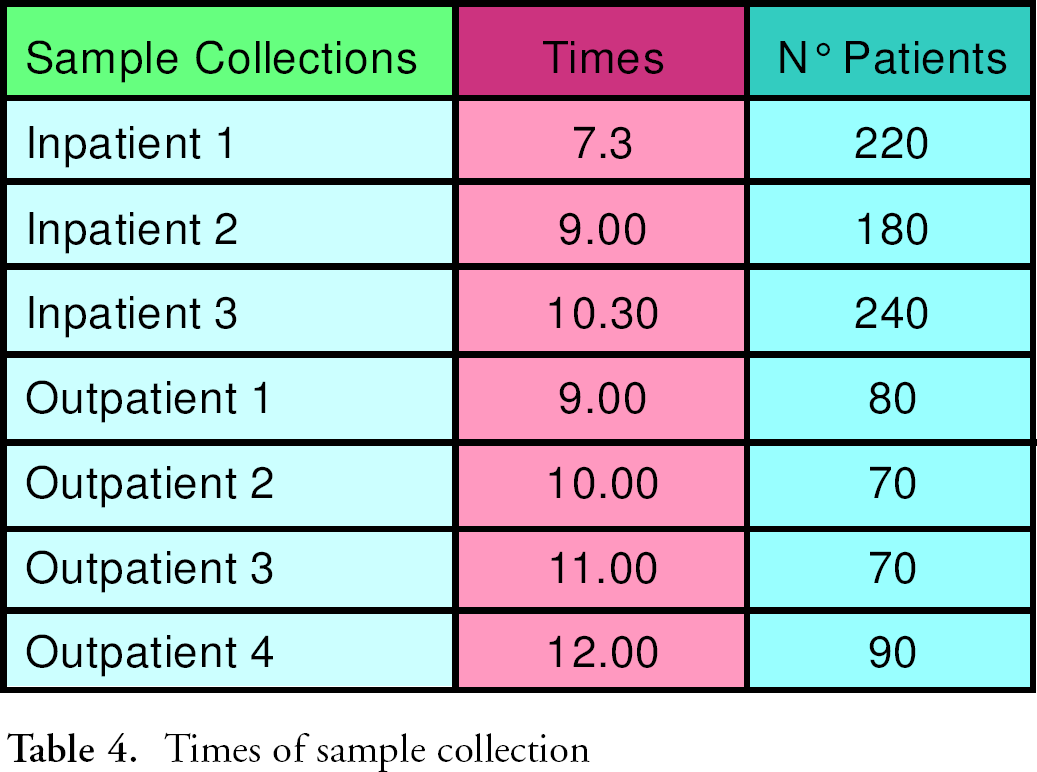
During centrifugation, the operators in the dedicated area read the content of the inpatient request forms by means of optical readers. The model considers that the optical reader is working correctly 80% of time, and that in 20% a keyboard recording by the operator is needed. All the time used in the simulation model are reported in Table 3; number of patients and sample collection times are reported in Table 4. The generation of alternative scenarios is made according to the defined rules. For instance, if the operator who records the request forms is working 90% of the time and there is a queue of specimens without information, it is useless to increase the number of centrifuges, but it is meaningful to increase the number of operators.
The model has been validated in order to test if the simulation model behaviour is realistic. Only under this condition can it be assumed as support for the laboratory. In the study two methods have been used for validation. First a sensitivity analysis on different parameters of configuration has been performed in order to verify the coherence of the simulation model. For instance, when increasing the time of centrifuging, the queue before the centrifuges becomes longer and the queue of specimens waiting for pre-analytic becomes shorter. The model has been validated by the laboratory personnel and by the laboratory director. They have judged the simulation model to be a realistic model of the real system, considering times, management rules and resources.
Times used in simulation model
Times of sample collection
The generation of alternative scenarios has been made according to the laboratory director, considering the centrifuges present in the laboratory and the personnel working in the laboratory at the moment.
EXPERIMENTATION AND RESULTS ANALYSIS
Outputs of the simulation are the following:
Percentage of inpatient specimens with a flow time lower than 45′
Percentage of inpatient specimens with a flow time lower than 70′
Total flow time, for each batch of specimen (I, II, III collection)
Flow Time for each specimen (average, maximum, mini mum value)
Saturation of centrifuges
Saturation of operator for load/unload of centrifuges
Saturation of operators for input of requests
Number of tubes with no information available, rejected and reloaded
Number of reloading every 20 minutes waiting for the data insertion
The outputs of simulation of three scenarios among the ones evaluated are listed in Table 5. The first scenario is not feasible because the service quality is not assured. In fact there are 142 samples loaded without data, more than the 5% considered acceptable by the constraint. The other two scenarios are feasible. The Objective function has been evaluated only for the feasible scenarios, able to satisfy the constraints and the best scenario is the one with the lowest total cost.
Simulation output
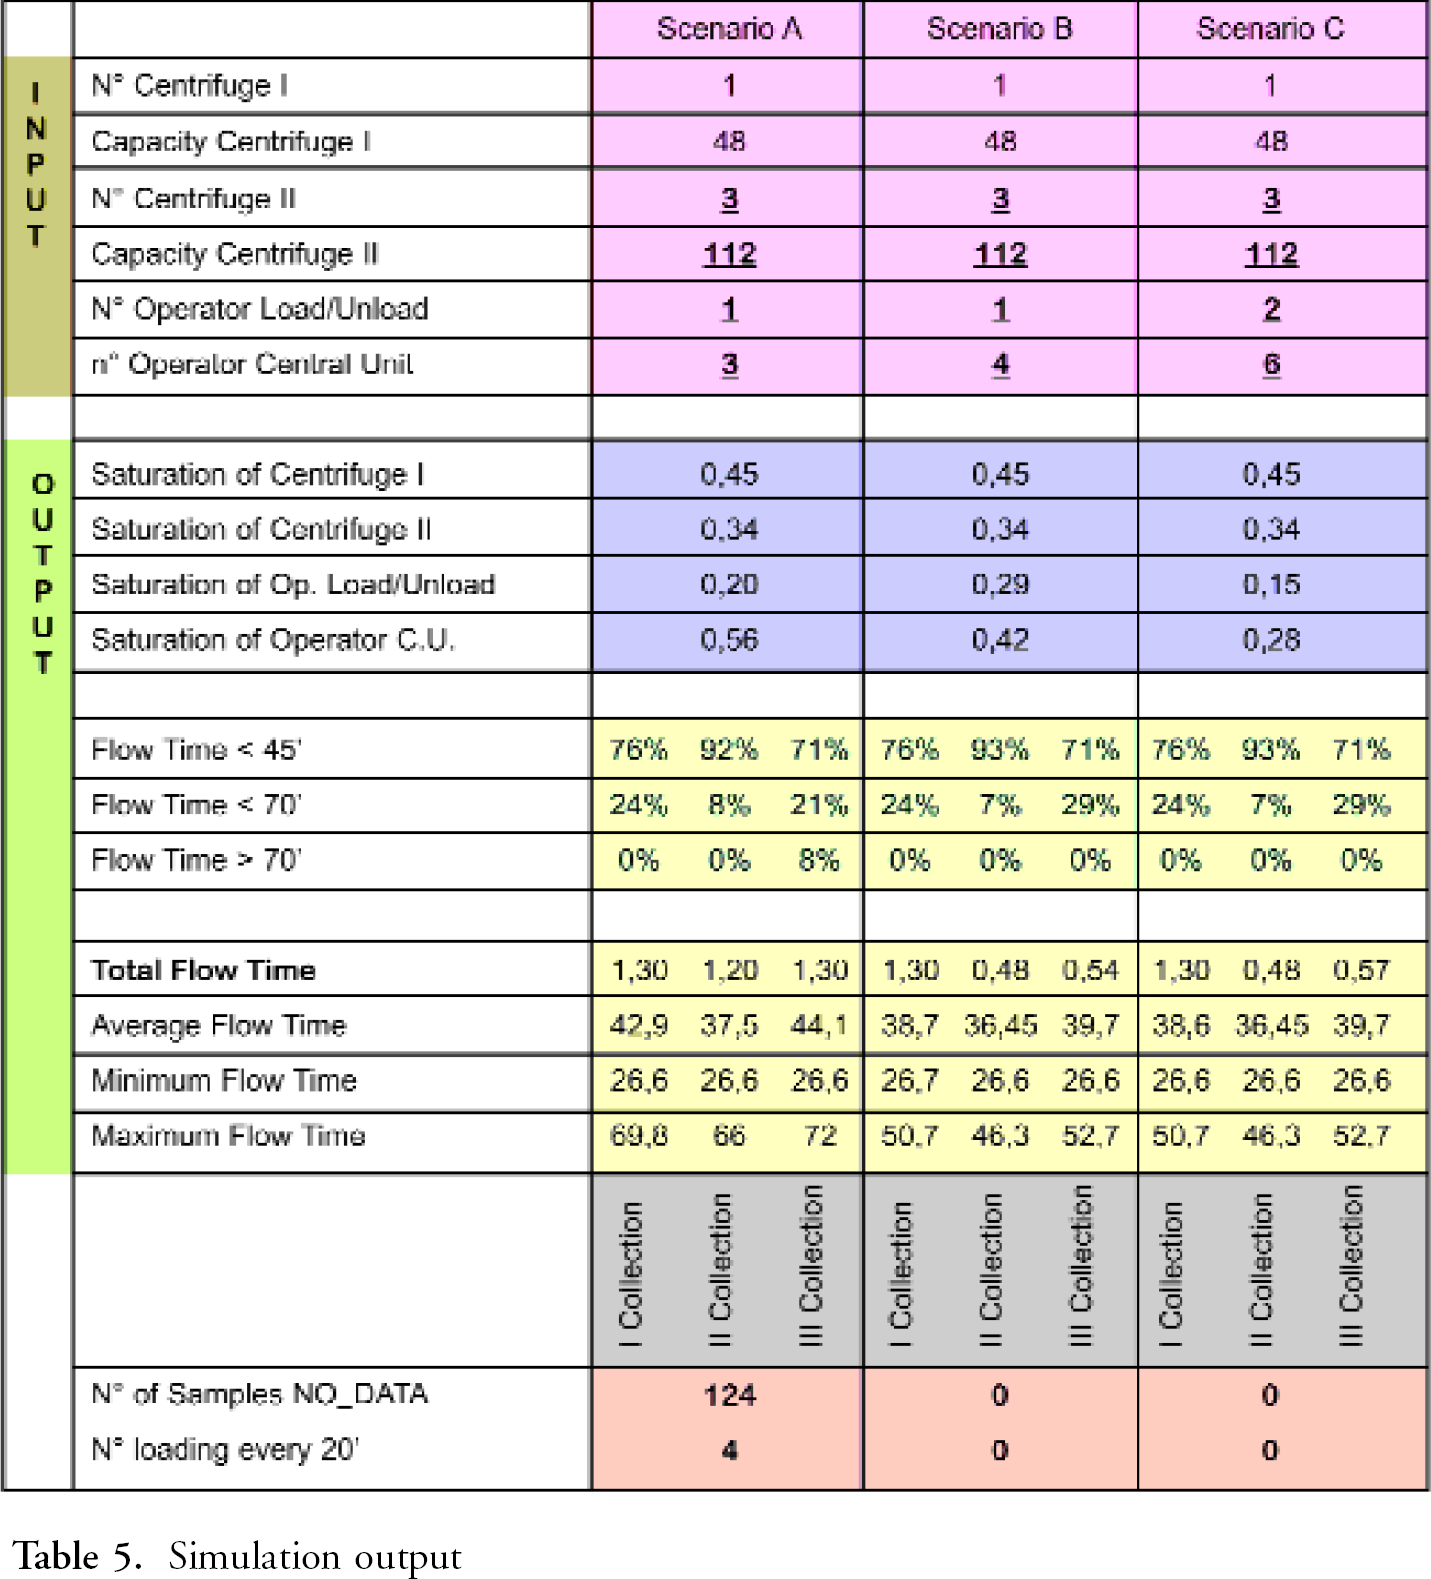
The scenario most proper, among the two feasible described in Table 5, for the hospital is scenario B with only one operator for the load/unload of the tubes and three operators for request input. The laboratory director has to employ four administrative clerks for three hours, instead of three for four hours for the request input, to make the information available to the pre-analytical device as soon as possible. The optimised configuration suggests that one technician for the load/unload of the centrifuges is enough (saturation lower than 30%). Considering also a technician for the load/unload and management of the pre-analytical device, two technicians are necessary for four hours, at 33,2 euro/h. According to this the cost of personnel for the automation of the pre-analytical phase is 596 euro/day. The cost of the current pre-analytical phase, in terms of personnel is 993,8 euro/day. The value is found by considering five technicians for four hours, at 33,2 euro/h, and three administrative clerks for four hours, at 27,5 euro/h. So the automation of the pre-analytical phase allows a savings of 40%. The saving is in fact higher because the cost of the pre-analytical phase currently does not include the cost of personnel for centrifugation. It is currently executed in the analytical sessions.
Automation allows an improvement in the service quality also. The flow time that currently has an average value of 74′ for all the samples, becomes lower than 45′ for the 71% of samples and lower than 70′ for the others.
CONCLUSION
In the necessity of optimising health care costs, this paper shows how an investment in the laboratory can be evaluated not only under an economic point of view, but also considering its future performance and service quality. The laboratory is an integrated and complex system, because there is a wide variety of interactions among the different parts of the system itself and it is affected by variability for different parameters. According to that, in order to take into account complexity and integration in the study, simulation has been used. Simulation is a good instrument of performance evaluation of alternative scenarios in order to answer “what-if” and in order to verify the satisfaction of constraints on service quality and saturation of the resouces. The study highlights the personnel cost saving (more than 40% of saving in terms of personnel) and the improvement in service quality of pre-analytical phase automation, even during the period without the connection between LIS-HIS.