
Abstract
A system using a liquid-core waveguide for the full scanning of capillary electrophoresis processes is presented. The system utilizes the liquid-core waveguide as an efficient window for the excitation of separated samples and the collection of light through total internal reflectance, with zeptomolar detection limits. Scanning the excitation laser along the length of the electrophoresis capillary excites individually separated analyte bands, while the fluorescence is collected end-on by an optical fiber coupled to a photomultiplier. A new procedure for denoising and deconvolution was applied to the experimental electropherograms, removing the noise and resolving the highly overlapped peaks observed in early stages of the separation.
Keywords
Introduction
Capillary electrophoresis (CE) has rapidly become an important analytical technique for the separation of compounds ranging from small inorganic ions to large biological molecules. In DNA fragment sizing and sequencing, capillary electrophoresis (CE) has become the standard technique of use. CE has many features that make it attractive, including high separation efficiency, speed, sensitivity, flexibility, and low cost. However, CE still presents a challenge to detector technology because of the constraints of nanoliter analyte volumes, micrometer detection path lengths, and overlapping of analyte peaks in the early stages of separation.
The high sensitivity and selectivity of laser-induced fluorescence (LIF) detection, together with the small volume required for detection, makes LIF an excellent detection method for electrophoresis 1 and one of the most sensitive optical detection schemes available for CE today. Traditionally, LIF detection in capillary electrophoresis and etched channels is implemented with a fixed-detector format; i.e., the fluorescence is induced and observed at a particular point or “window” that the analytes flow past as they traverse the separation channel. The excitation light is usually focused near the end of the capillary, and a photon detector measures the emitted fluorescence. Therefore, it is necessary to wait until the analytes have moved to the detection window before any information about the separation can be obtained. This usually results in time-consuming and often excessive separation times. In addition, investigation of the course of events during the separation is not possible. Therefore, imaging or scanning the electrophoretic process along the complete separation channel length offers an attractive alternative that can provide more information and speed up the analysis process. In this case, it is necessary to consider the accuracy of the results and the analysis of the data, especially during the early stages of separation. Most instrumental systems have some limitations due to experimental signals associated with noise. The noisy signals can be induced by imperfections in the optical and electronic components, interferences of chemical or physical processes, and/or other noise sources that add fluctuations to the pure signal. Moreover, the signals usually obtained by capillary electrophoresis show overlapped peaks if the data are acquired in the early stages of the DNA separation. Both noise and overlapped peaks complicate the data analysis and adversely affect the accuracy of the results.
In this work, we demonstrate the imaging of the electrophoretic process along the complete separation channel length of a Teflon AF capillary using a new system based on a liquid-core waveguide. The system shows excellent sensitivity and provides the ability to observe the electrophoresis separation at any point in the capillary, providing information about the events taking place during the separation. Also, a new processing method based on a combination of a wavelet-based denoising and a novel approximate deconvolution technique has been used to analyze the experimental electropherogram. This new method resolves the DNA fragment peaks and dramatically improves the ability to separate highly overlapped peaks early in the electrophoresis process.
Full Imaging System
The instrumental setup is schematically shown in Figure 1. A 300-μm o.d. by 100-μm i.d. by 12-cm-long Teflon AF-coated capillary (Polymicro Technologies; Phoenix, AZ) was securely positioned between two modified Peek Ts (Valco Instruments; Houston, TX). The Peek Ts were drilled through with a 0.5-mm drill to allow the ends of the capillary to be inserted up to the middle of the T. A 1-mm orifice connecting to the T channel was drilled on the top of each structure to make small reservoirs (∼5 μL) that served as injection-end and termination-end buffer reservoirs. A platinum electrode, connected to electrical ground potential, was inserted into one leg of the injection-end T. A syringe (not shown) with running buffer was connected to the second leg of the injection-end T. The buffer syringe was used to wash the buffer reservoir and maintain it full. A second platinum electrode, connected to a 5000-V dc power supply, was inserted into the leg of the terminating-end T coupling. A 400-μm-core diameter fiber-optic (model FVP400440480UVM; Polymicro Technologies) was inserted into the leg directly opposite the Teflon AF-coated capillary. The fiber-optic end and capillary end were aligned under a stereomicroscope by viewing their positions through the reservoir opening. The spacing between the two ends was ∼500 μm. The detection fiber optic was coupled to a 510-nm bandpass filter (model 510DF20; Omega Optical, Brattleboro, VT) and an analog photomultiplier (model HC120–05; Hamamatsu, Bridgewater, NJ). A fiber-optic-coupled argon ion laser (model Reliant 50S; Laser Physics, Salt Lake City, UT), 488-nm emission line, was coupled to a 15-mm focal length lens and focused to 50-μm spot. The fiber-optic and lens mount were mounted on a stepper motor XY translational table (model MD-2; Arrick Robotics, Hurst, TX). The table had a resolution of 125 μm/step and was typically run at 2 steps/acquisition and 3.98 steps/s. A Lab View program (National Instruments, Austin, TX) was created to control the XY table and acquire the photomultiplier output data from a 12-bit ADC board (model PCI-MIO-16E-4; National Instruments, Austin, TX). Data were typically acquired with 0.25-s integration time per two motor steps. The XY table allowed the positioning of the fiber optically coupled laser along the entire length of the Teflon AF-coated capillary.
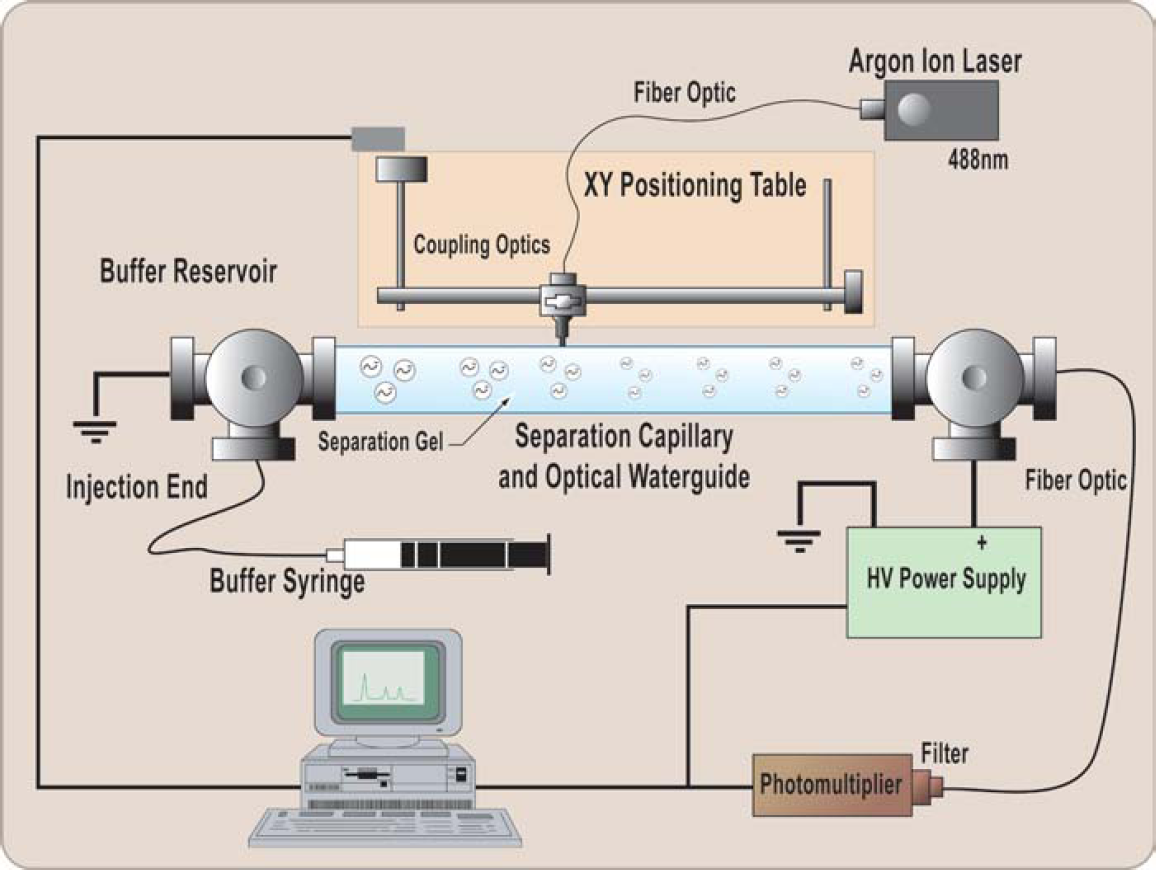
Schematic diagram of the capillary electrophoresis/laser-induced fluorescence detection and imaging system.
Theory
Denoising
The extraction of useful information from the recorded data (raw data) is usually complicated by the presence of noise. A common practice to noise suppression is to use digital-processing methods. In the last decade, wavelet transforms (WTs) have received considerable attention in signal denoising and it has been shown that WTs are more efficient in denoising signals than traditional methods such as Fourier filtering and Savitzky-Golay smoothing. 2 –4
In this work, the use of WTs to eliminate noise from the original spectra is applied. Accordingly, the wavelet shrinkage approach to denoising the signal is taken. 5 This method, which is nonparametric, is best suited for dealing with noise profiles whose characteristics are unknown. Also, since the instrument noise characteristics are not known, an additive white noise with zero mean and an unknown probability distribution function is assumed.
Wavelets for denoising and deconvolution of signal have been previously reviewed 6,7 and the basis and theory extensively explained. 8 –12 The goal of denoising is to obtain an estimate of the signal and remove the noise components. Typically, the signal information will be located in the low-frequency domain, and the information contained in the high-frequency domain above a certain level will be mainly due to noise. Therefore, the noise components are localized in the finer detailed levels of the transform. In these levels, the coefficients of the true signal have high amplitude, and the coefficients of the noise have the lowest magnitude coefficients. Thus, removal of the noise can be accomplished by taking off the coefficients that are smaller than a predetermined value or threshold. This is the basis of the wavelet shrinkage method developed by Donoho and Johnstone. 13 The procedure using wavelet shrinkage consists of (1) obtaining an orthogonal wavelet transform of the signal to be denoised, (2) applying a nonlinear shrinkage (i.e., reduction in magnitude) of the resulting wavelet coefficients, and (3) reconstructing the denoised signal via the inverse wavelet transform that contains the processed wavelet coefficients.
Deconvolution
In electrophoresis data, we can consider that the signal peaks are Gaussians whose parameters are governed by the injection profile, the laser pointspread function, and the diffusion parameters of the various components in the mixture. In addition, there is overlap of neighboring Gaussian peaks that makes the estimation of the individual peaks inaccurate. The main purpose of deconvoluting the electrophoresis data is to obtain a better resolution of the overlapping Gaussians. With this in mind, we have developed an approximate deconvolution scheme that makes a pointwise estimation of the effective local parameters to reduce the peak spreads and resolve the peaks satisfactorily. The approximate deconvolution is implemented as a second order differential operator with variable coefficients. The differential operator is a first order approximation of the annihilator of the Gaussian. That is to say, the operator, when applied to the Gaussian, yields a dirac delta function. The coefficient values at each point are determined by the local values of the signal and its second derivative, ensuring perfect cancellation outside a finite neighborhood of the local peaks' maxima. A detailed explanation of the process is found in a separate paper. 14
Methods
Denoising
All the data vectors' lengths corresponding to the experimental electropherograms (raw data) were converted into a dyadic length: 2n. A stationary wavelet transform (SWT), which has the advantage of being shift-invariant, was employed. A wavelet Coiflet 2 was applied to the noisy signal obtaining the wavelet coefficients. In the absence of a priori knowledge of the noise model, we apply the VisuShrink thresholding scheme of Donoho and Johnstone 13 to determine the threshold value. Then, a soft thresholding was used, and the coefficients were reduced, eliminating the noise component of the signal. Finally, the processed signal is reconstructed via the inverse wavelet transform to obtain the denoised signal.
Deconvolution
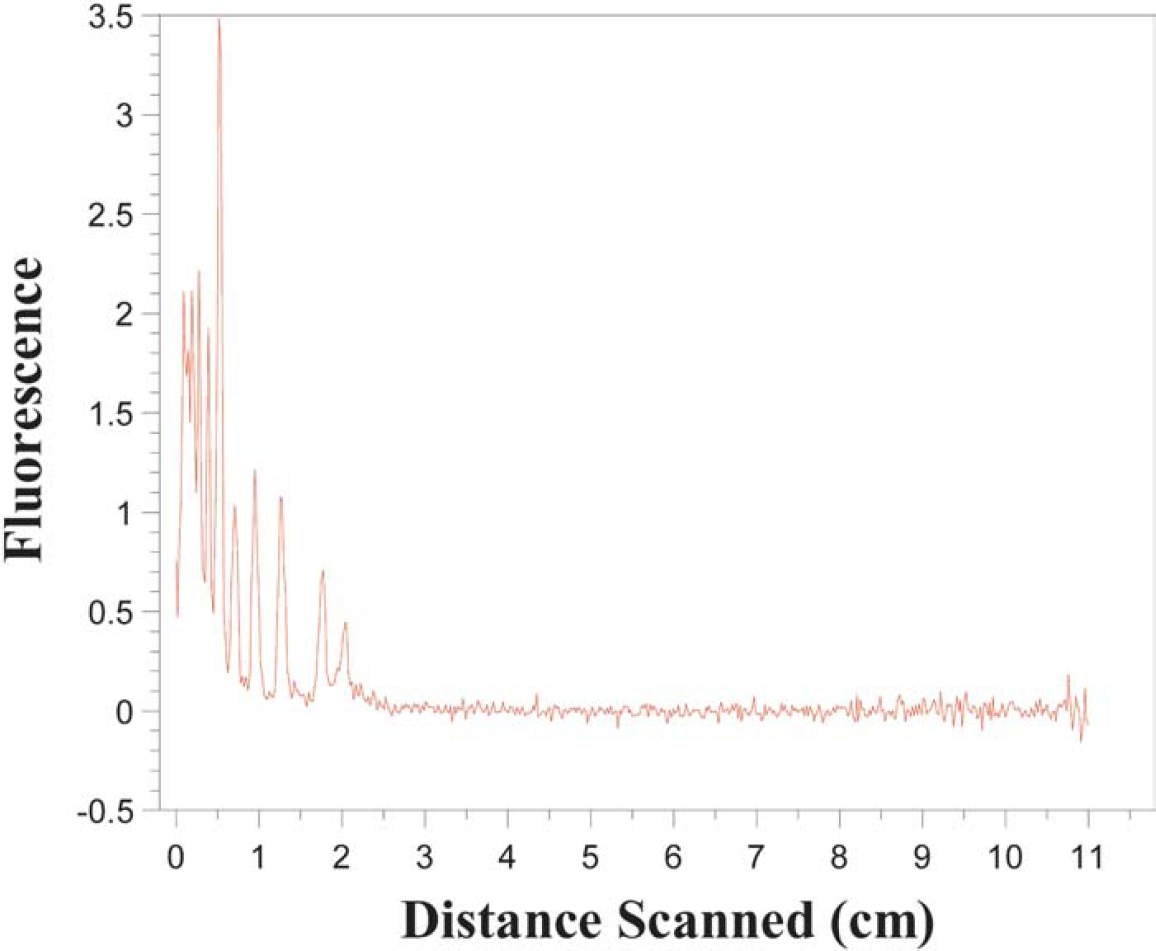
If y is the denoised signal to be deconvolved, the coefficient signal
was computed. Then a differential operator 1–k 2 D 2 was applied to the signal y, obtaining the deconvolved signal z = (1 – k 2 D 2)y.
Materials
Sieving Matrix
For DNA fragment analysis, the two 5-μm electrode reservoirs and the separation capillary were each loaded with a mixture containing 0.5% (w/v) poly (vinylpyrrolidone) (PVP, 1 000 000 Mr; Polyscience, Warrington, PA) and 0.9% (w/v) hydroxypropylmethyl cellulose (HPMC; Sigma Chemical, St. Louis, MO). These materials were prepared in electrophoresis grade 2xTris-boric acid-EDTA (TBE; Fisher Scientific, Fairlawn, NJ). Combined in this manner, these polymers served both as a physical sieving medium for the DNA electrophoretic separations and to deactivate the surface charge on the inner wall of the 100-μ m-i.d. Teflon-coated separation capillary, thus stopping the electroosmotic flow of the buffer/sieving matrix. This combination of HPMC with PVP provided a reduction in the overall viscosity of the sieving matrix while allowing high-resolution DNA separations normally achievable only with the use of higher concentrations and consequently higher viscosity, cellulose-based sieving matrixes.
Sample
Fluorescently labeled DNA samples for capillary electrophoresis experiments were prepared by contacting a 100 base pair (bp) DNA ladder (Promega, Madison, WI) with Pico-Green nucleic acid stain (Molecular Probes, Eugene, OR). Briefly, this involved preparing a 1/20 dilution of the Pico-Green reagent in 1 TBE and adding 30 μL of this solution to 75 μL of separations in 30-cm capillaries. The Promega ladder consists of 11 fragments ranging in size from 100 to 1000 base pairs in 100-bp increments, with an additional fragment at 1500 base pairs. The 500-bp fragment is present at approximately three times the concentration of the other fragments and was used as a reference indicator. The Pico-Green DNA stain is specific for double-stranded DNA and exhibits fluorescence excitation and emission maximums at 480 and 520 nm, respectively, making it ideal for use with the 488-nm line from an argon ion laser.
Sample Injection Procedure
With the capillary carefully positioned in the modified PEEK fittings, the capillary was loaded with the PVP/HPMC sieving mixture by closing off the injection buffer reservoir and applying pressure with the syringe containing the sieving material at the injection end of the capillary. The injection and terminal-end buffer reservoirs were also each filled with the PVP/HPMC sieving matrix. A 3000-V potential was applied for 1 min to precondition the capillary and to monitor the current, typically 10–20 μA. Next, the PVP/HPMC sieving material was removed from the injection-end buffer reservoir using a Pasteur pipet and replaced with the PicoGreen-labeled Promega 100-bp DNA ladder. A 1500-V potential was again applied for 12 s to electrokinetically inject the sample into Teflon capillary. The DNA ladder was removed from the injection port reservoir and replaced with the PVP/HPMC buffer solution. The potential was again set to 1250 V, and a LabView VI was started to monitor the electrophoresis current and voltage, laser position, time, and photomultiplier response.
Results and Discussion
Making the electrophoresis separation channel function as an optical waveguide provided several advantages to our detection system. The detection limit observed for fluorescein, using an analog photomultiplier and simple light filter, is below 40 zmol. An estimate of the efficiency of light collection can be made from the critical angle for light reflection due to the change in the index of refraction between the liquid core and the Teflon AF coating. The index of refraction for gels is ∼1.4, while for Teflon AF, it is 1.31. 15,16 The critical angle is given by sinθc = n 2/n 1, and for this system, it is 69°. 11 Thus, the calculated light collection efficiency for the current system is ∼12%. Adding an additional detection fiber optic at the injection end should further improve the sensitivity by a factor of 2. Nevertheless, imperfections in the Teflon coating, such as scratches and impurities, will cause further light losses.
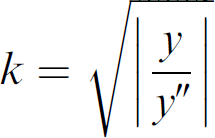
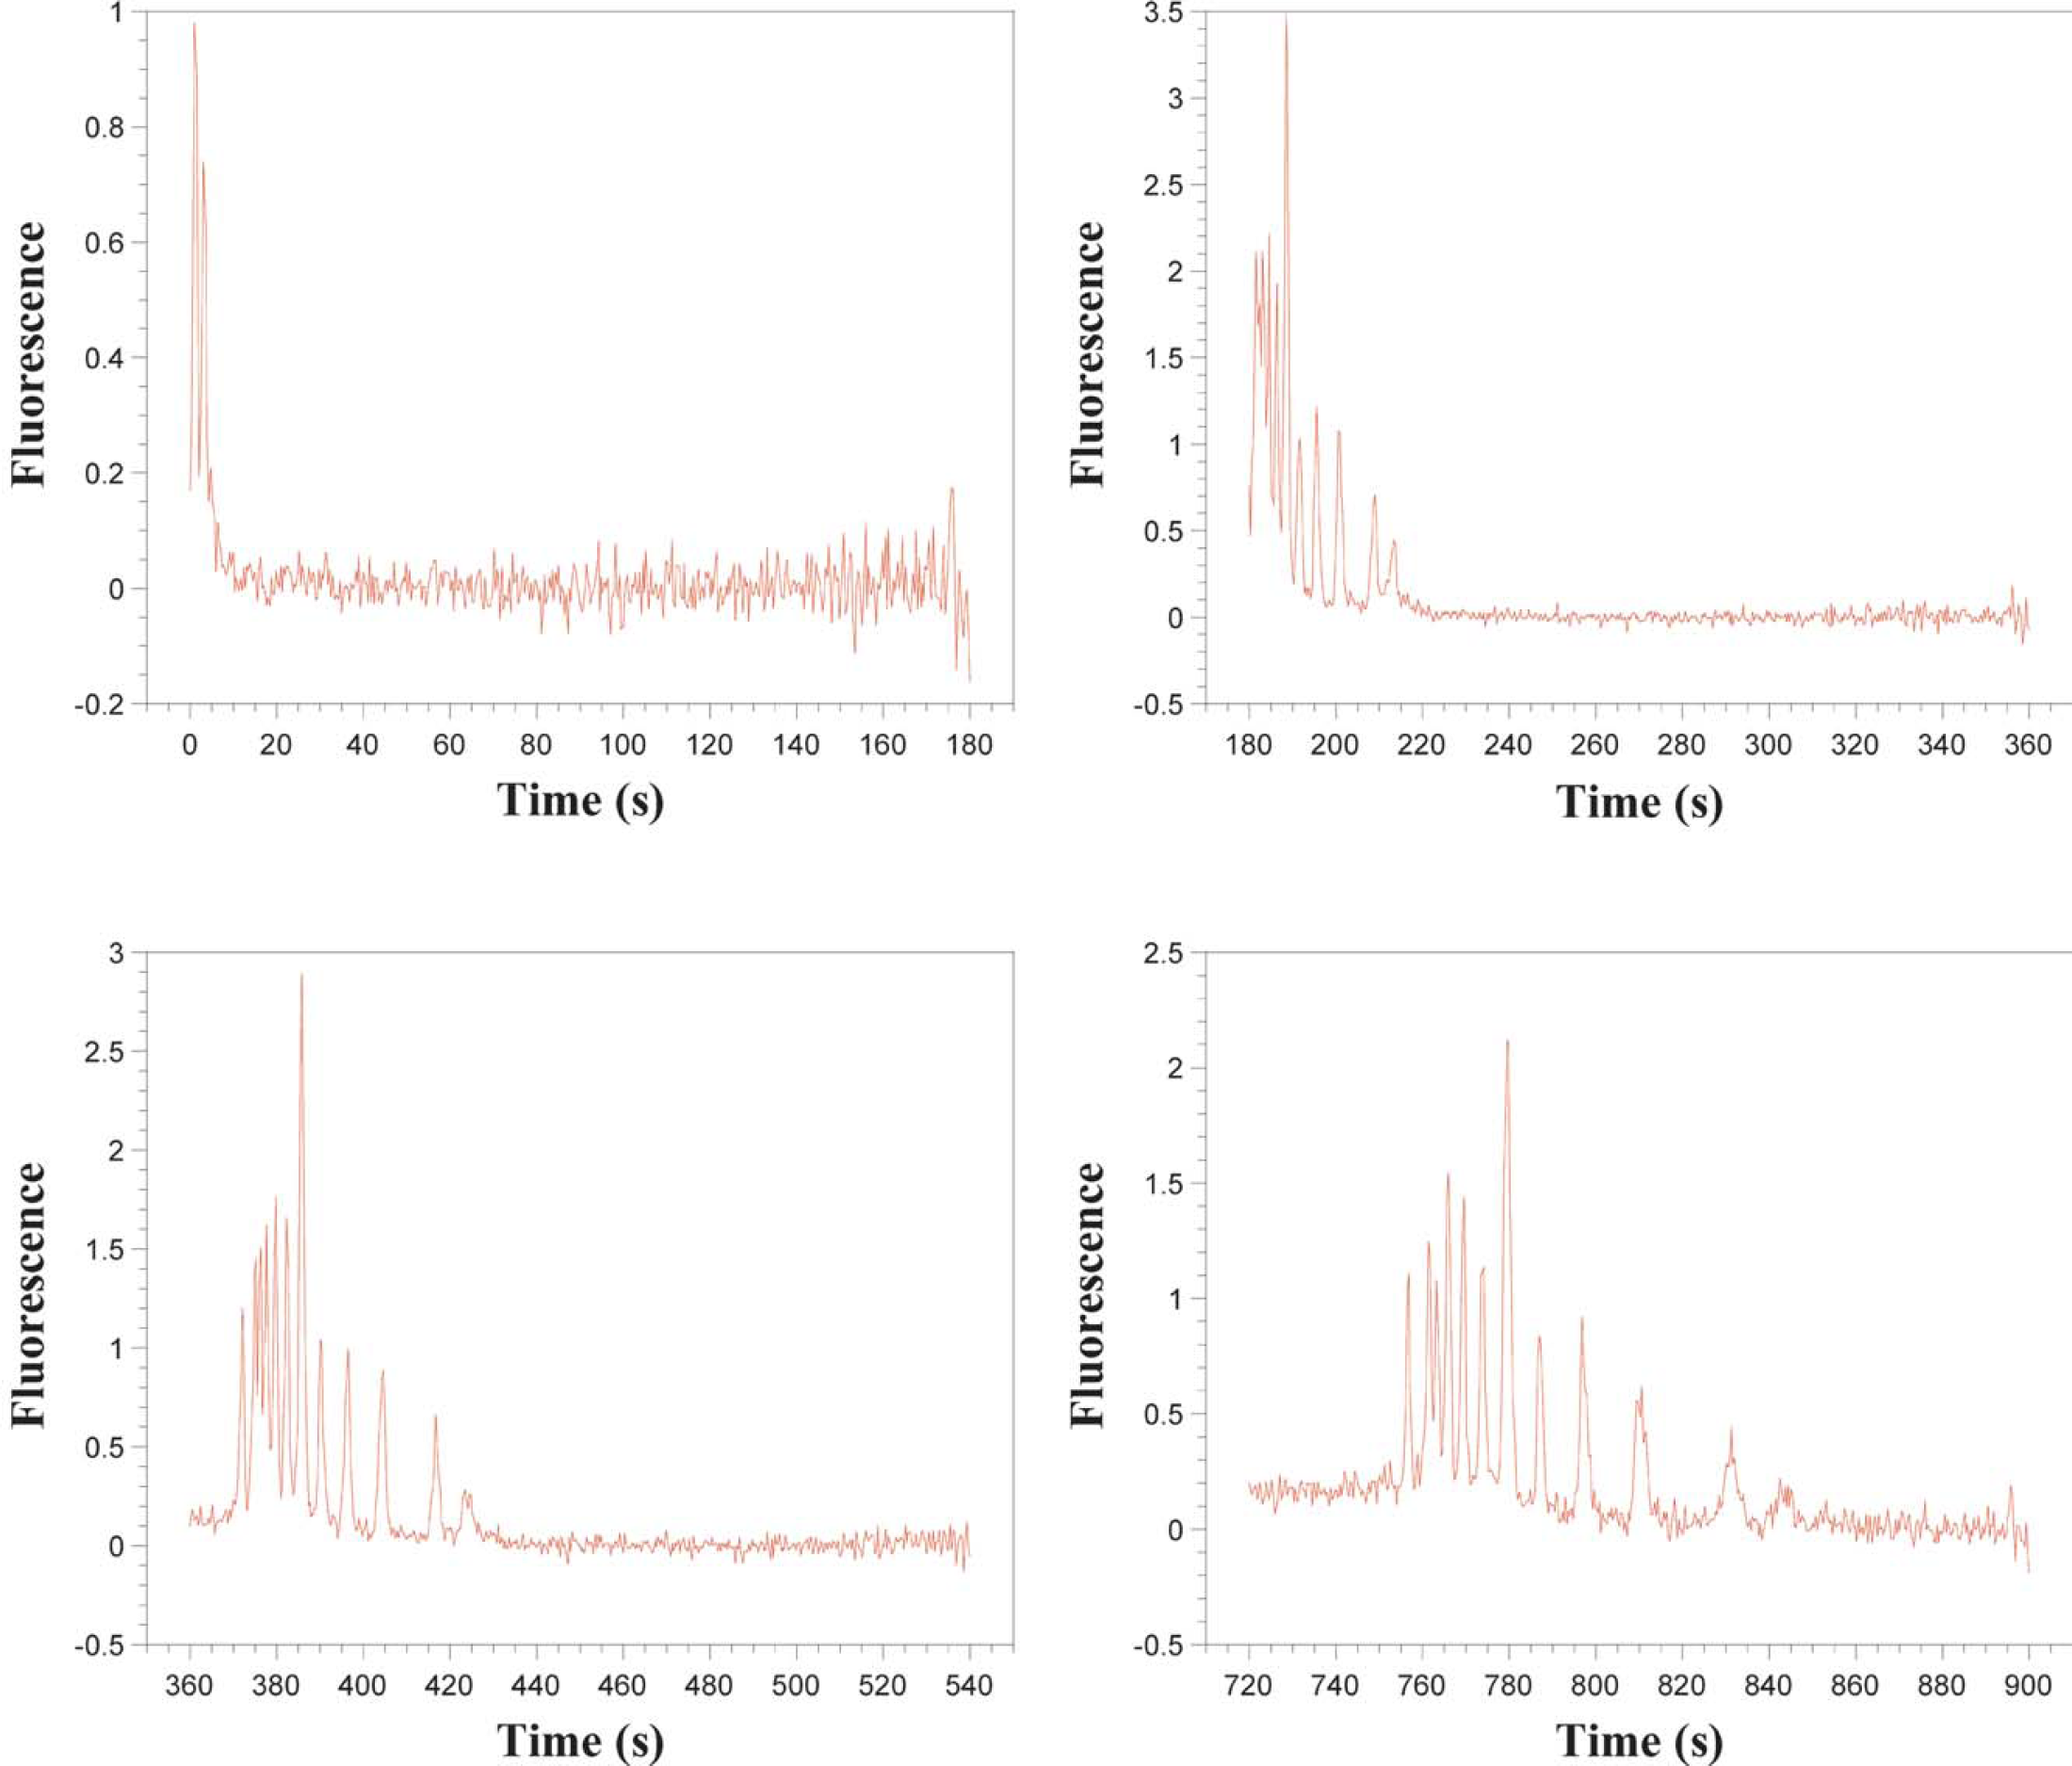
In addition to this excellent sensitivity, the light waveguide provides the ability to observe the electrophoresis separation at any point in the capillary. This is done by scanning the length of the capillary with the excitation beam, as shown in Figure 1, thus producing a full image of the separation inside the capillary. The separation can be imaged several times, as long as the laser power is low enough so as not to cause significant photobleaching of the analyte. Although the laser system used in this work was capable of 20-mW power output, it was typically used at its minimum setting estimated to be 5 mW. With this system, we are able to monitor full separations as they occur in time, as shown in Figure 2. In traditional electropherograms, obtained with a fixed detector, signal amplitude is plotted against time as the x-axis. Our system collects an electropherogram using a moving excitation source; therefore, it can be used to collect an electropherogram of all of the analyte peaks within the separation channel at any one time. Thus, the analyte signal amplitude can be plotted as a function of position in the capillary as in Figure 3.
Experimental DNA electropherograms obtained for separations running at different times.
Experimental electropherogram obtained for a separation running at 180 s as a function of position.
In Figure 2, a DNA fragment ladder is separated and the electropherogram recorded at various times during the electrophoresis run. The peaks are due to DNA fragments with sizes of 100, 200, 300, 400, 500, 600, 700, 800, 900, 1000, and 1500 bp. The smaller the DNA fragment size the larger its mobility and the further it travels at any one time frame. A small peak that appears before the 100-bp fragment is of unknown origin, possibly associated with an impurity in the sample. The largest peak corresponds to the 500-bp fragment.
In all the scans, a considerable quantity of noise is evident. This noise is higher than the detected signals recorded in the fixed mode. 17 Also, in the early stages of the separation, highly overlapped peaks are observed, complicating the analysis of the data.
Resolution of the noisy, highly overlapped peaks is necessary if we want to use this system to speed up analysis time, yielding higher throughput for sample analysis by observing separations in their early stages.
To obtain denoised and deconvolved signals from the experimental data, the process described in “Methods” was applied. In Figure 4b, the reconstructed signal obtained after submitting the original signal (Figure 4a) to the denoising process is shown. All the filtered signals were obtained by using the same level of decomposition. The findings for the experimental signal acquired at 180 s are used to discuss the results. Similar results have been obtained with processing signals corresponding to other times.
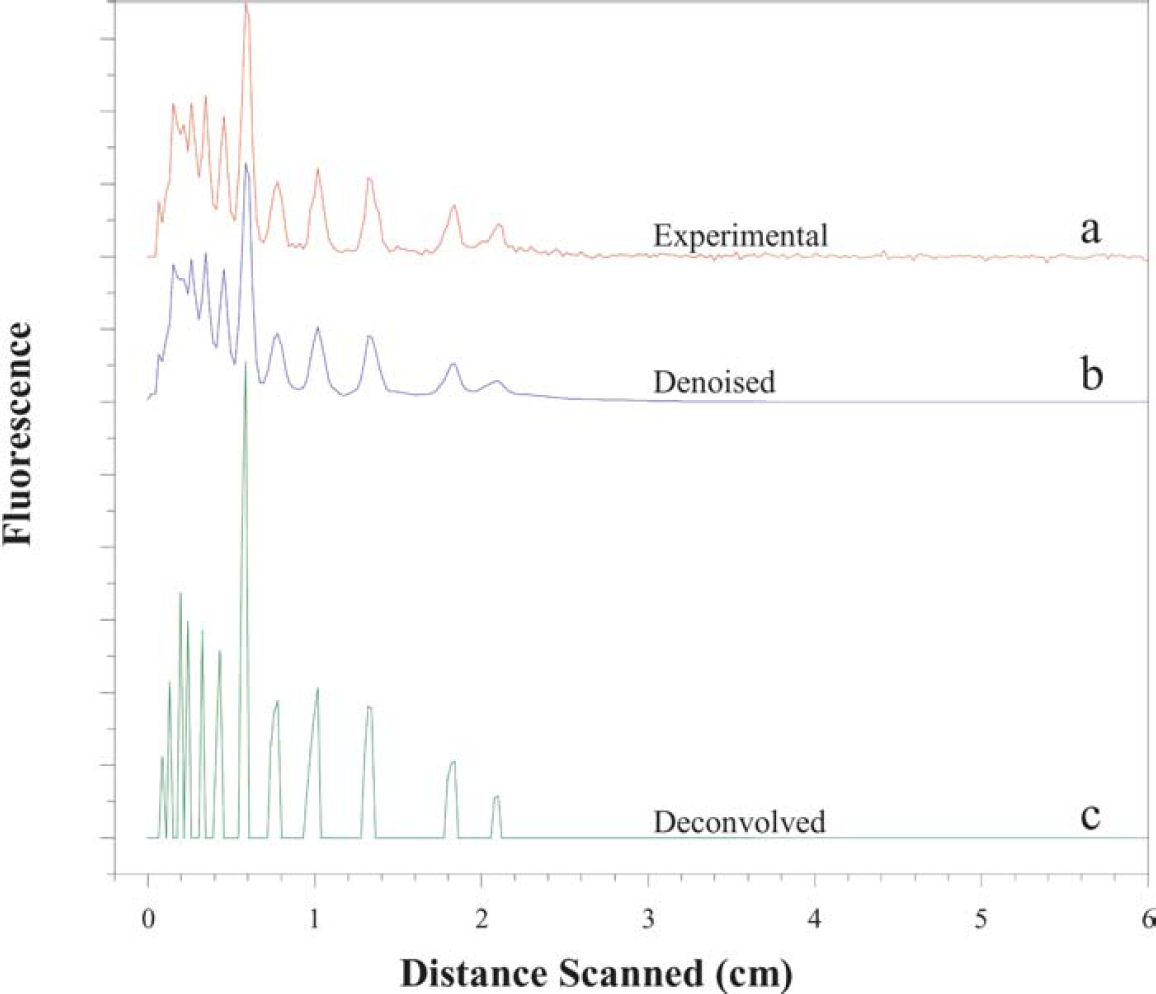
(a) Experimental electropherogram obtained at 180 s. Results obtained after the (b) denoising and (c) deconvolution procedure.
We have observed that the use of a maximally symmetric orthogonal wavelet, such as the Coiflet 2, to perform the transform gives very good noise removal while maintaining the characteristics of the original signal. This is because adapting the wavelet to share known signal characteristics, such as smoothness, symmetry, etc., enhances the contrasting behavior of signal versus noise in the wavelet transform domain.
Moreover, the reconstructed signal does not create artifacts. This is mainly due to (a) the success of the translation-invariant denoising method and (b) a good selection of the wavelet shape. Furthermore, the denoised peaks show the same width and shape as the original signal, but a slight decrease in the intensity of the peaks is observed due to the subtraction of the noise contribution.
The results of the signal deconvolution using the process described in “Methods” are also displayed in Figure 4c. The approximately deconvolved signal exhibits well-resolved peaks corresponding to each of the expected DNA fragments.
The peaks in the approximately deconvolved signal are twice the height and half the width of the original peaks. This is because the deconvolution operator effectively doubles the values of a Gaussian in the interval [–σ, σ], where σ is the standard deviation of the Gaussian, while canceling the values outside this interval. The interference of the Gaussian peaks with one another shifts the peaks in the signal in different directions. Upon deconvolution, these shifts are lessened, and, as expected, the deconvolved peaks are slightly shifted back. This is equivalent to saying that the deconvolution restores true peak positions to some extent.
To illustrate that our method of approximate deconvolution preserves peak positions, we have simulated a signal, Figure 5a, as the superposition (i.e., simple addition) of five Gaussians. The five Gaussians have means 200, 220, 240, 260, and 280 and may be thought of as the convolutions of a Gaussian with zero mean convolved with five injection samples at times 200, 220, …, 280, where each injection sample is a dirac delta (i.e., a spike). Also, we want to point out that in the simulated signal, noise was not added, and, therefore, in this case, we did not use the denoising process.
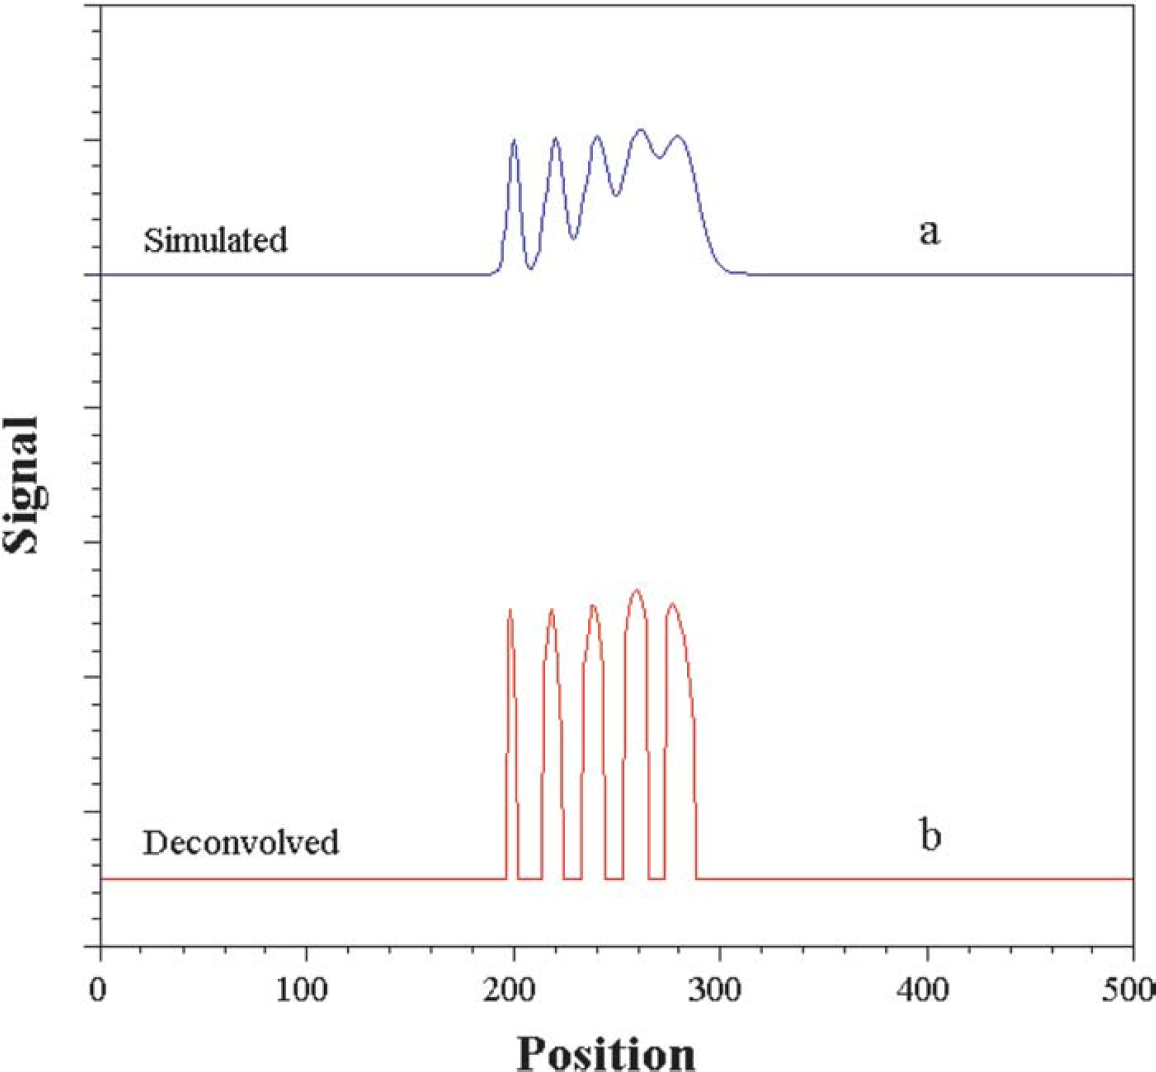
(a) Simulated signal obtained as the superposition of five Gaussians. (b) Deconvolved signal obtained after applied the de-convolution process using Coiflet 2 and a decomposition level of 5.
When the deconvolution procedure is applied, approximations of the injection profiles at positions 200, …, 280 are obtained (Figure 5b). The recovered peaks are approximate dirac deltas, as the deconvolution operator is only a second-order approximation to the actual annihilator of the Gaussian. However, it can be seen that the deconvolved peaks are at the original Gaussian peak positions of 200, 220, 240, 260, and 280. If we had higher order approximations to the annihilator of the Gaussian, we would get even better localizations at these positions. This, however, would require very high sampling rate of data to reduce numerical errors. Our method offers a reasonable practical and useful compromise in the face of limitations on data resolution and computational time to achieve fast early time deconvolution.
Conclusions
We have demonstrated the utility of this system to observe DNA fragment sizing and protein separations. The system utilizes the liquid-core waveguide as an efficient window for light excitation of separated samples and the collection of fluorescence through total internal reflectance, with zeptomolar detection limits. Scanning the excitation laser along the length of the electrophoresis capillary excites individually separated analyte bands, while the fluorescence is collected end-on by an optical fiber coupled to a photomultiplier. Since the analyte never leaves the capillary, the separation may be rescanned and imaged several times, with or without the electrophoresis voltage, to maximize separation between critical analyte bands, increase signal-to-noise ratio, or verify the analysis. Although the system is demonstrated using direct fluorescence in electrophoretic separations, it can be applied to isotachophoresis, micellar electrokinetic chromatography, and open tubular capillary chromatography, among others. Like most capillary electrophoresis systems, the system can be multiplexed and should be amenable to microchip packaging and integration.
Also, a method for denoising and deconvolution was applied to the experimental electropherograms, removing the noise and resolving the highly overlapped peaks observed in early stages of the separation. This method for denoising and deconvolution can also be applied to denoising and deconvoluting overlapped peaks in different analytical techniques such as spectrometry, voltammetry, oscillographic chronopotentiometry, and chromatography.
Acknowledgments
The authors want to acknowledge the financial support received from the Laboratory Directed Research and Development program. Los Alamos National Laboratory is operated by the University of California for the U.S. Department of Energy under contract no. W-7406-ENG-36.