
Abstract
An optical wave-guide based two-color capillary electrophoresis laser induced fluorescence (CE-LIF) instrument is described. The wave-guide based approach allows for on column excitation and detection with two-color discrimination. The instrument is designed to allow either electrokinetic or hydrodynamic injections. In its present configuration, the attainable limit of detection (LOD, S/N = 3) was 50 × 10−21 moles of fluorescein with a 488-nm excitation source. This study was designed to test the instrument design for applications in protein analyses. Fluorescent dyes with two different wavelengths were simultaneously separated and detected as were complexes formed by labeled antibodies to NF'B p65 and cdc2p34. Quantification of both proteins in THP-1 cell lysates performed using this approach illustrates a rapid screening application of this instrument.
Introduction
Capillary Electrophoresis (CE) as an analytical technique is rapidly gaining prominence as judged by the increasing number of reports in the literature. The popularity of CE appears to stem chiefly from its high separation efficiency, relatively short analysis time and meager sample consumption. In addition, CE is very versatile in the range of compounds that can be separated, from small inorganic compounds and amino acids to large proteins and DNA. 1 – 5 The separation efficiency of this method has been utilized very effectively for the detection of complexes between proteins and antibodies or “Fab” antibody fragments. 6 Antibody affinity approaches, termed affinity probe capillary electrophoresis (APCE) have proven to be extremely useful in immunoassays. 7,8 CE-based immunoassays have also been exploited to study antibody-DNA complex formation by recognition of bases that have undergone oxidative damage. 9
In addition to enhanced sensitivity, LIF overcomes many of the problems associated with UV absorption, some of which are discussed by Jin et al. 10 in their study of dynamic fluorescent labeling of protein-SDS complexes. CE combined with LIF has been used to monitor separations of chiral compounds 11 and Green Fluorescent Protein (GFP). 12 The use of multi-color LIF in capillary electrophoresis has been primarily applied to DNA analysis systems, e.g., DNA sequencing 4,5 and short tandem repeat (STR) fragment sizing 2,3 Typically, LIF experiments have been performed using a sheath flow cuvette for detection. The sheath flow approach allows for excellent detection limits and has been used effectively in several studies for post-column detection of reaction metabolites such as oligosaccharides from enzymatic hydrolysis of a fluorescent trisaccharide. 13 Dasgupta et al 14 suggested an attractive alternative in their report on the use of a liquid core waveguide (LCW) for on-column luminescent excitation and detection in capillary electrophoresis. Hanning et al. applied the LCW scheme coupled with CCD camera based detection for multicolor DNA sequencing. 15 In the LCW, the excitation is performed directly on column and efficient detection is achieved by total internal reflectance (TIR) of the fluorescence emitted by the analytes. TIR is produced in a liquid core wave-guide when the capillary is coated with a low index of refraction coating, e.g., Teflon AF'. Here, we report on the development of a two-color capillary electrophoresis fixed laser-induced fluorescence instrument using a liquid core optical wave-guide. The capillary is externally coated with Teflon AF™, with a R.I = 1.31, lower than that of water (1.33). Excitation is performed axially using two lasers of different wavelengths and detection is accomplished by collecting the fluorescence end-on by optical fibers that are coupled to photomulipliers. In this paper, we examine the utility of this simple design for protein analyses.
Experimental
INSTRUMENTATION
Figure 1 shows a schematic diagram of the two-color CE-LIF instrument. It comprises a 30 cm long, 100 μm i.d. fused silica capillary with Teflon AF™ external coating (model TSU100375 Polymicro Technologies, Phoenix, AZ). A 15 mW − 488 nm argon ion laser and a 5 mW − 532 nm Nd-YAG diode pumped laser (models M0341–1 and 58GM5011, Melles Griot, Irvine, CA) were used with standard optical quality mirrors and mechanical adjusters to locate the light beams at the middle of the capillary giving an effective separation length of 15 cm. The injection end is at the anode. At the cathode end, the capillary was introduced into a modified Peek T junction (Valco Instruments Co, Houston, TX). The Peek T junction was drilled through with a 0.5 mm drill to allow the ends of the capillary to be inserted up to the middle of the T. The opposite end of the T was connected to a bifurcated optical fiber assembly consisting of one 400 μm core fiber spliced onto four 200 μm core fibers (models FVP400440480UVM and FVP200220240UVM respectively, Polymicro Technologies, Phoenix, AZ). The 200 μm core fibers lead to two photomultiplier tubes (PMT), with band pass filters set at 520 nm and 560 nm, respectively. A short length of capillary tube is inserted into the third leg of the T-junction. This short tube provides the final connection to cathode and end buffer reservoir. The instrument was controlled by a computer using a program written in-house with the graphical instrument control and programming language LabView (National Instruments, Austin, TX) and a multi-function control board (model PCI-MIO-16E-4, National Instruments, Austin, TX). Injection of samples was made either electrokinetically or hydrodynamically using an electronically controlled valve to a pressure regulated N2 (g) tank. Electrophoresis was typically conducted at 10000 V in Tris-borate buffers unless described otherwise.
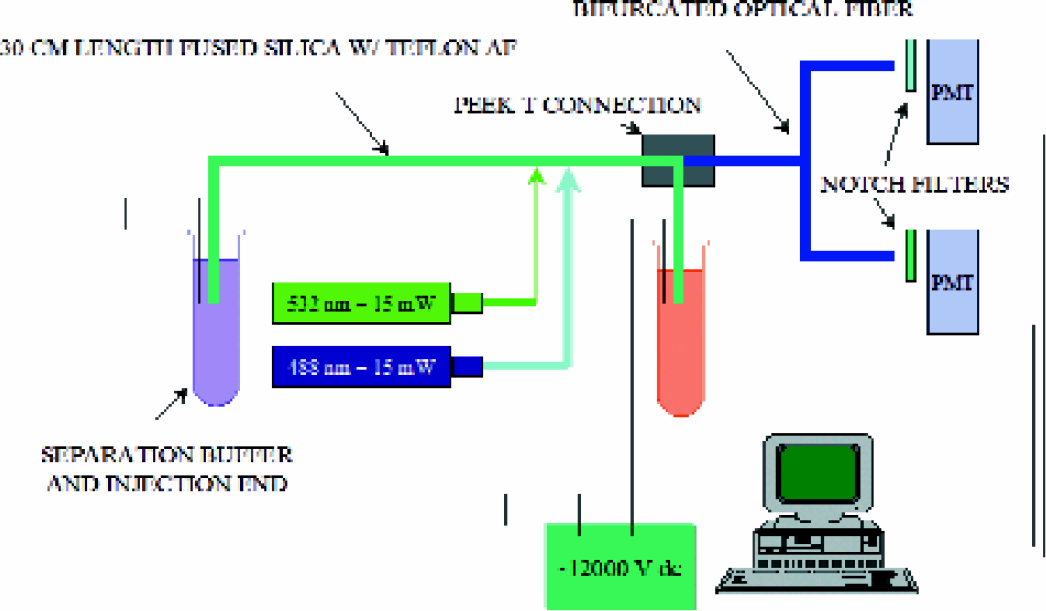
Schematic diagram of the two-color CELIF instrument.
CAPILLARY CONDITIONING
New capillaries (30 cm length) were first installed on the unit. Hydrodynamic pressure at 3 psi was used to condition the capillary with a 5 minute sequential application of 0.1 N HCl, deionized water, 0.1 N NaOH, deionized water and then separation buffer. Between runs, the capillary was flushed with 0.1N NaOH, water and separation buffer. Before each sample injection, blank runs with separation buffer were performed to ensure removal of contaminants from previous runs. At the end of the day, the capillary was flushed extensively with 0.1N NaOH and deionized water and stored filled with water.
EXPERIMENTS WITH FLUORESCENT DYES
Stock solutions of fluorescein and rhodamine were serially diluted to the required concentrations. A 2 second plug was injected hydrodynamically and the sample vial was replaced with one containing separation buffer. The PMT voltage gain was adjusted to prevent saturation, and 0.85V appeared to provide the best dynamic range. Either the 488 nm or the 532 nm laser or both were switched on as desired.
PROTEIN SAMPLES AND ANTIBODIES
THP-1 human monocytic cells were obtained from ATCC. Cells were maintained in suspension in RPMI 1640 and harvested by centrifugation upon confluence. Cell pellets were washed twice with cold PBS and lysed using the M-PER reagent (Pierce) as per the manufacturer's instructions. Protein concentrations were measured using the BCA micro kit from Pierce. Fluorescently labeled and unlabeled antibodies were purchased from Santa-Cruz Biotechnology (Santa-Cruz, CA). Secondary antibodies conjugated to rhodamine were purchased from Calbiochem. When desired, antibodies were labeled using the FluoReporter kit (Molecular Probes, Eugene, OR) choosing fluorescent dyes to suit the wavelength requirements of our system. Alexa Fluor 488/532 labeled reagents and Nano-orange protein quantitation kit were procured from Molecular Probes. Fluorescein labeled molecular weight markers were purchased from Sigma (St. Louis, MO) and unlabeled SDS-PAGE standards were obtained from Bio-Rad (Richmond, CA). In all cases, labeled proteins were cleaned up to ensure removal of any free, unbound fluorescent dye. All other reagents were analytical grade or better and purchased from Sigma Chemical Company. Incubation and running conditions for individual experiments are described in the Results section.
PEAK ANALYSIS
The experimental electropherograms were denoised using stationary wavelet transform (SWT) 17,18 (Wavelet toolbox, Matlab v6.5.0, The MathWorks Inc., Natick, MA). In this case, all the data vector lengths corresponding to the experimental electropherograms were converted into a dyadic length: 2n. A stationary wavelet transform using Coiflet 2 19,20 was applied to the noisy experimental signal obtaining the wavelet coefficients. The coefficients were reduced eliminating the noise component of the signal using a nonlinear shrinkage, soft thresholding, 17 determining the threshold value through the statistical VisuShrink universal method. 21 Finally, the processed signal was reconstructed via the inverse wavelet transform obtaining the denoised electropherogram. The denoised electropherograms were analyzed using PeakFit software 22 (Systat Software Inc., Richmond, CA) by means of an iterative non-linear curve-fitting procedure. Fitting analysis was performed using a linear combination of Gaussian spectral functions. The AutoFit Peaks I Residuals algorithm without smoothing was employed to identify the positions, width, amplitude, and area of the peaks in the denoised electropherogram.
Discussion of Results
LCW based LODs: By virtue of a lower refractive index than water, Teflon AF™ coated capillaries act as liquid core wave-guides (LCW). 14 Thus, fluorescence emitted by samples that are excited while migrating through the capillary is collected by an optical fiber coupled to a photomultiplier. Such an approach facilitates sensitive detection of fluorescent molecules as seen in the raw electropherogram in Figure 2, where at a S/N =3, the detection limit for fluorescein, hydrodynamically injected at the anode and excited by the 488 nm argon ion laser, was determined to be 50 × 10– 21 moles. In similar experiments, we were able to detect 7.2 × 10⁻¹⁸ moles of rhodamine using the 532 nm Nd-Yg laser for excitation (data not shown). These LODs are lower than the yoctomole levels of rhodamine reported by Chen and Dovichi 23 using the sheath-flow approach, but compare well with LCW designs on which limited data is currently available. However, the end-on coupling design is simpler, robust and more amenable to high-throughput, multiplexed assays than the sheath-flow method. Further, end-on collection allows imaging of a complete electrophoretic separation, which is particularly useful in applications such as capillary isoelectric focusing of proteins. 24 The sensitivity achieved is sufficient for applications in DNA and protein analysis. We believe that any increase in sensitivity will have to be made at the level of the detector. Dark field microscopic examination of the tip of the capillary shows that when the capillary contains a fluorescent compound, the emission is largely confined to the liquid core. Dasgupta et al. 14 have suggested silvering of the capillary face to reject any stray beams. Similar attempts by us were not successful due to blocking of the T-junction by particles of the coating material that would periodically get dislodged.
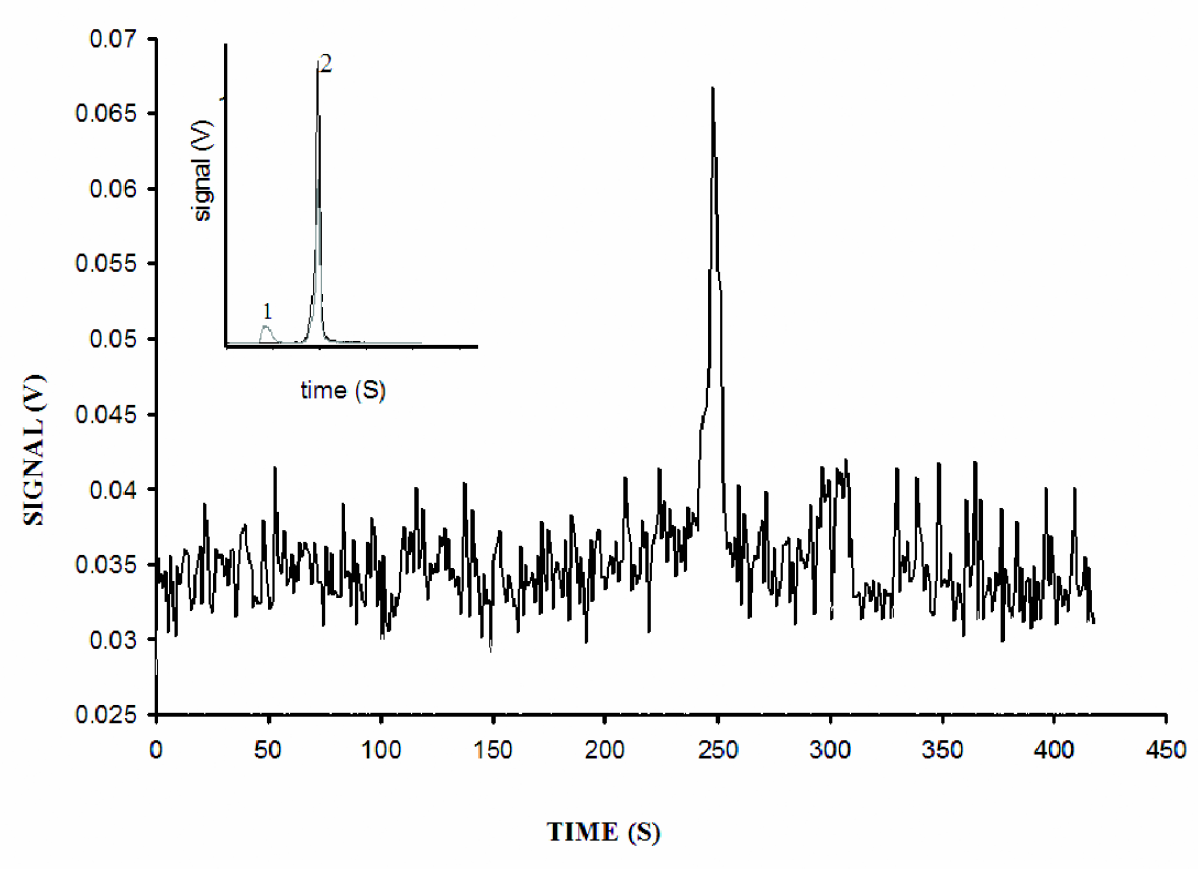
125 zeptomoles of Fluorescein was injected hydrodynamically at the anode end. Electrophoresis was carried out at 11 kV in 3.3 mM Tris, 6.6.mM Borate, pH 8.0. Inset: A solution containing 925 femtomoles (injected) each of Fluorescein and rhodamine was electrophoresed. Peak 1: rhodamine fluorescence captured by PMT2. Peak 2: Fluorescein captured by PMT1.
DUAL-WAVELENGTH EXCITATION/DETECTION AND CHANNEL BLEED-OVER
The insert in Figure 2 shows the simultaneous separation and detection of fluorescein and rhodamine when injected together. The first peak is rhodamine fluorescence as a result of excitation by the 532 nm laser and detection at 560 nm. The second peak arises from fluorescein, excited by the 488 nm laser and detected at 520 nm. The typical emission spectrum for fluorescein type dyes bleeds over into the spectral window of the 560 nm emission detector (data not shown). This is seen in the second peak where the fluorescein bleed-over is observed in the 560 nm signal trace. At specific PMT voltages, the extent of bleed over is constant, thus allowing for relatively easy interpretation of the electropherograms. This bleed-over can only be overcome by choosing dyes that have emission bands that do not overlap, but for the purposes of the experiments performed total elimination of the bleed-over was not necessary.
PROTEIN SEPARATIONS
The following experiments were performed to evaluate the applicability of this instrument to routine biological applications. Protein separation was monitored using fluorescein-labeled low molecular weight markers that contain a mixture of five proteins ranging from 6.5 kDa to 39 kDa (Figure 3, upper panel). Electrophoresis was conducted at 11000V in a 1:4 dilution of CE Protein Separation Buffer A (Sigma) containing 0.1% SDS. A similar approach was used for the separation of 6 fluorescein-labeled high range markers (20 kDa − 205 kDa), seen in the lower panel in Figure 3. In the latter experiment, rhodamine labeled IgG (MW ∼ 145 kDa) was included to demonstrate the simultaneous dual-color detection capability of the instrument with labeled proteins. The peak generated by rhodamine labeled IgG is distinctly observed among the fluorescein labeled protein peaks. The inset shows a trace of rhodamine-IgG alone. In situations where labeling of proteins may not be possible or desirable, an alternative approach using NanoOrange can be applied. 10 This fluorescein-like dye undergoes significant enhancement in fluorescence upon binding to a protein-SDS complex. Such an approach is particularly useful for whole lysate analysis, which is presently a focus in our laboratory.
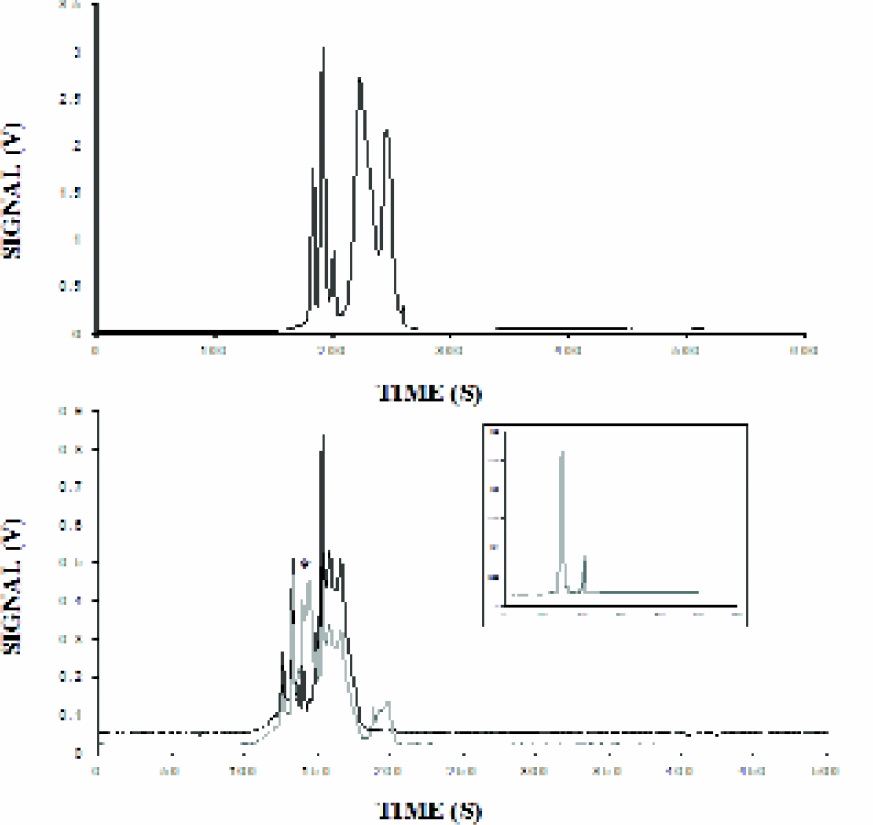
Top panel: Fluorescein labeled low molecular weight markers were diluted 1:50 in 10 mM Tris, 20mM Borate, pH 6.0 and injected for 2 seconds at 1.5 psi. Running buffer and voltage were 0.25X Sigma CE Buffer at 11 kV. The markers comprised alcohol dehydrogenase (39 kDa), carbonic anhydrase (29 kDa), soybean trypsin inhibitor (20.1 kDa), lactalbumin (14.2 kDa) and aprotinin (6.5 kDa). Bottom panel shows fluorescent high molecular weight markers diluted 1:30 in 10 mM Tris, 20 mM Borate, 20 μM TTAB, pH 6.0. Rhodamine labeled anti-mouse IgG (Calbiochem) was added to a final concentration of 25 μg/ml and the mixture was injected for 2 seconds at 1.5 psi. The IgG peak is marked with an asterisk and appears in the PMT2 (inset shows the IgG electrophoresed alone) trace which is colored gray. The PMT1 signal is traced in black; the peaks comprise myosin, β-galactosidase, BSA, alcohol dehydrogenase, carbonic anhydrase and soybean trypsin inhibitor
IMMUNOASSAYS
Given the short separation channel (15 cm to detector) in our instrument design, we examined whether we could obtain adequate separation of a labeled antibody tracer molecule from its complex with a target under simple running conditions. These experiments were conducted using commercially available antibodies to two proteins of specific interest to our laboratory and which were determined in earlier studies to be very specific. The NFκB family of transcription factors has been well characterized and plays a crucial role in cellular processes such as cell cycle and inflammation. APCE using a FITC-labeled antibody to NFκBp65 was performed to detect the levels of this protein in differentiated THP-1 cells. The antibody was incubated with total cell lysate for five minutes at room temperature before injection (an increase in incubation time did not alter the results). The electropherograms in Figure 4 show the efficient separation of the NFκB p65 protein-antibody complex (marked with an asterisk) from free antibody at two different concentration ratios of antibody: total protein. The measurement of analyte bound labeled antibody and its separation from excess antibody may classify this as a non-competitive, heterogeneous assay. 25,26 CE is particularly well suited for such assays due to the relatively easy and rapid separation of the components. The amounts of labeled antibody were varied (4 pg/nL in the main panel and 3 pg/nL in the inset) while the lysate containing the target protein was kept constant. Peak Fit analysis was performed on these peaks to quantify the extent of binding. Assuming a binding stoichiometry of two antigen molecules per IgG, the amount of NFκB was estimated to be 1.56 × 10⁻¹⁵ moles.
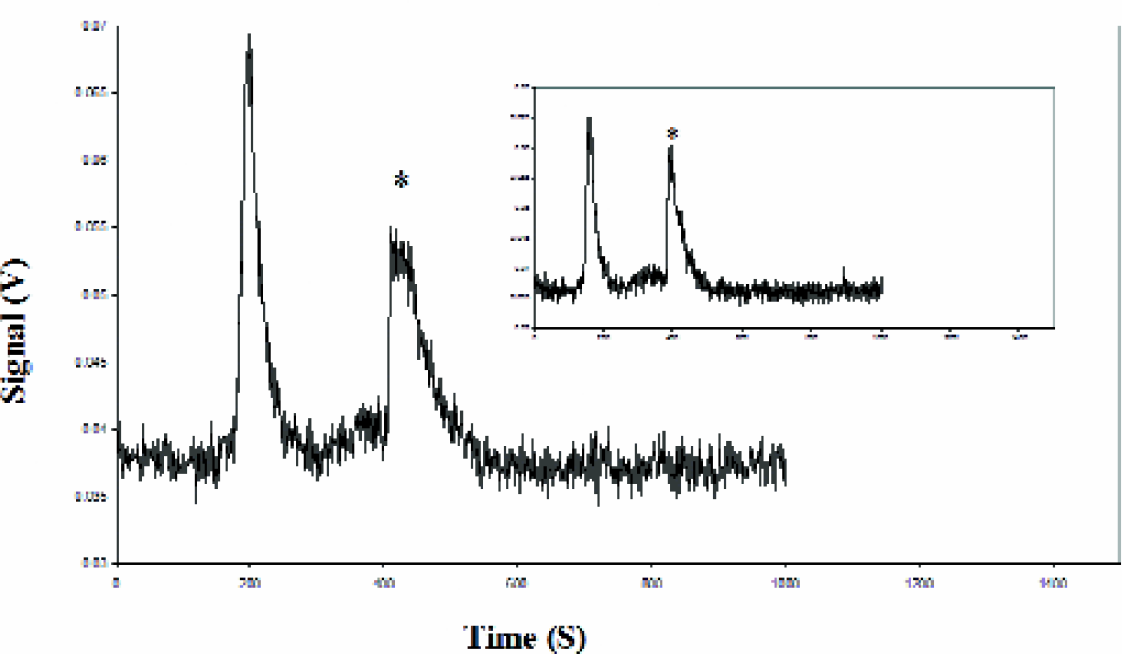
THP-1 cell lysate (0.38 mg/mL) was incubated with 4 μg/mL anti-NFkB p65-FITC (3 μg/mL in inset). Electrophoresis conducted at 11KV in 0.25X CE buffer. The protein-antibody complex is marked with “*”. Peak Fit analysis was performed to determine the peak area and target protein amount was calculated based on the ratio of bound:unbound labeled antibody signals.
In Figure 5, the dual wavelength capability of the instrument is exploited to simultaneously detect two target proteins in a single sandwich assay. Cdc2 p34 along with cyclins and cdks are involved in nuclear cell division cycles and the gene has been shown to be up regulated in virally induced carcinogenesis. 27 The antibody to p34 was used unlabeled in combination with a rhodamine labeled secondary antibody so as to generate enough separation between the two antigen-antibody complexes. THP-1 lysate was incubated with anti-NFkB-FITC and a complex of anti-CDC2p34 with rhodamine labeled anti-mouse IgG. The sample was electrophoresed first with both lasers on to visualize both protein complexes and then with each laser individually (insets) to determine the contribution of each analyte signal to the overall electropherogram. Since the p34-antibody and its complex is rhodamine tagged, the 532 nm laser excites it and the emitted fluorescence is collected through the 560 nm band pass filter (inset ‘b’). The p65-FITC antibody and complex are excited by the 488 nm laser and detected at 520 nm (inset ‘a’). As described earlier, the bleed over into the 560 nm detection channel is seen and can be resolved from the p34 complex. Based on analysis of the p34 complex peak, the concentration of the p34 protein is estimated to be 0.4 × 10⁻²¹ moles.
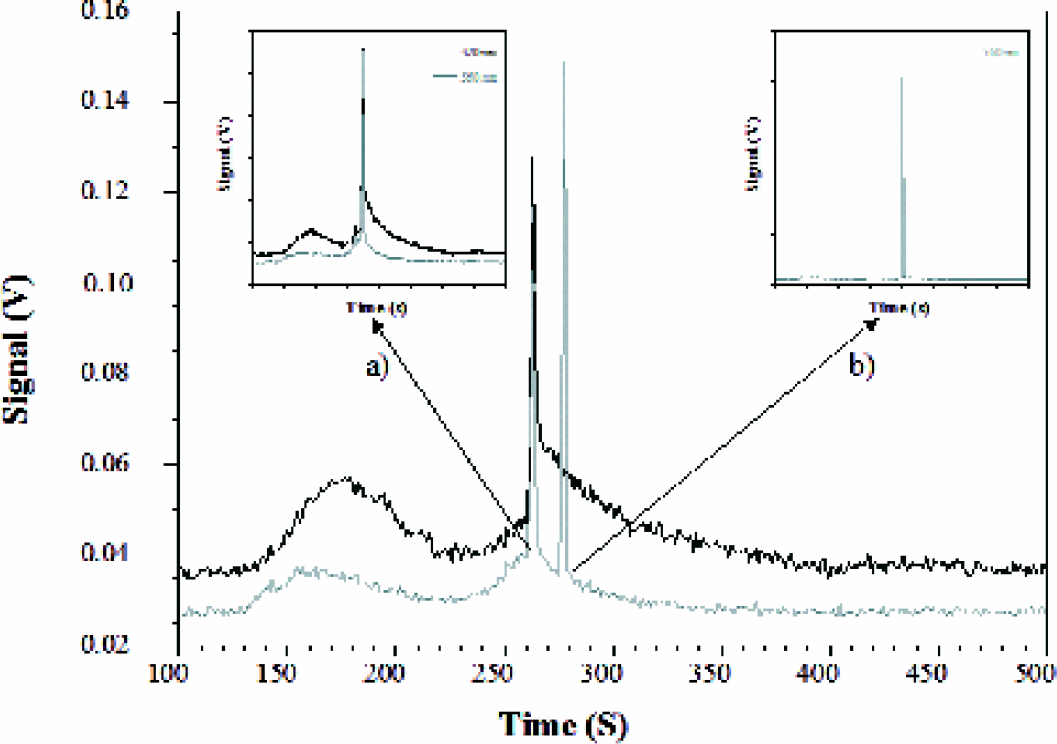
THP-1 lysate at 0.38 mg/ml was incubated with 4 μg/ml anti-NFkB-FITC and a complex of anti-CDC2p34 (20 μg/ml) with rhodamine labeled anti-mouse IgG (0.3 mg/ml). The sample was electrophoresed with both lasers on and then with each laser individually (inset ‘a’: 488 nm and ‘b’: 532 nm).
Concluding Remarks
We have described the development of a two-color CE-LIF instrument using a liquid core optical wave-guide for total internal reflectance detection. The two-color detection mode enables detection of two separate affinity-binding events in a single sample. To demonstrate the utility of this approach for protein complex analysis, we have used two antigens that are the focus of particular studies in our laboratory as examples. In addition to the NanoOrange approach mentioned earlier, Protein A coated polystyrene microspheres containing FITC can be used to tether unlabeled antibodies (data not shown) as an alternative to labeling commercial antibodies that are typically supplied in concentrations that are too low for efficient labeling with fluorophores without addition of proteins such as BSA to increase the total protein concentration. The optical wave-guide mode of detection provides for a simple arrangement capable of sensitivity levels in the low zeptomole range for direct dyes and femtomole to attomole detection of antigen-antibody complexes. We are hopeful that this approach will gain acceptance for “western-blotting” type high throughput screening assays.
Acknowledgements
The authors thank Virginia Olazabal for assisting with peak area calculations. Los Alamos National Laboratory is operated by the University of California for the U.S. Department of Energy under contract no. W-7406-ENG-36.