
Abstract
The application of automation in conjunction with DoE designs towards the rapid discovery and optimization of metal-catalyzed reactions used in the synthetic preparation of clinical drug candidates at Merck Process Research is demonstrated with three examples. A description of the software and hardware is provided, followed by three examples highlighting these applications. The first example highlights a DoE optimization of a platinum-catalyzed chemoselective hydrogenation of a nitroaromatic nitrile. In the second example, automated screening is employed to discover a highly efficient palladium catalyst that affects nitrostyrene cyclization under a carbon monoxide reducing atmosphere. In the last example, a rapid discovery and DoE optimization of a rhodium-catalyzed diastereoselective hydrogenation of an unsaturated ester is detailed.
Keywords
Process research is characterized as much by speed and efficiency as it is by creativity and quality in the development of synthetic routes to active pharmaceutical ingredients (API). In some cases, speed to delivery of API in the initial phases of a project moving into clinical development is the primary objective. In those instances, the process chemist is challenged with minimizing people and time invested to develop scalable synthetic transformations that provide quality product and consistent results. Automated equipment, in conjunction with statistical design of experiments (DoE),1, 2 can accelerate both the screening and optimization phase of discovery and development of scalable synthetic transformations.3, 4 In particular, metal-catalyzed reactions, which are often characterized by multiple interacting parameter dependencies (e.g., pressure, temperature, catalyst loading), are not easily optimized by a more traditional “one factor at a time approach”. Furthermore, heterogeneous and homogeneous catalyses can be some of the most challenging reactions to optimize in small-scale automation equipment due to the very small quantities of catalyst employed and the complexity of the parameters involved (multiple physical phases, mass transfer effects, etc.).
In this article, we describe some of the software and hardware used within Merck Process Research to apply automation and DoE designs to the optimization of catalyzed processes. We then highlight the application of this technology with three examples of metal-catalyzed transformations. Of particular note is the use of these techniques early in the development of catalytic processes.
Description of Software and Hardware
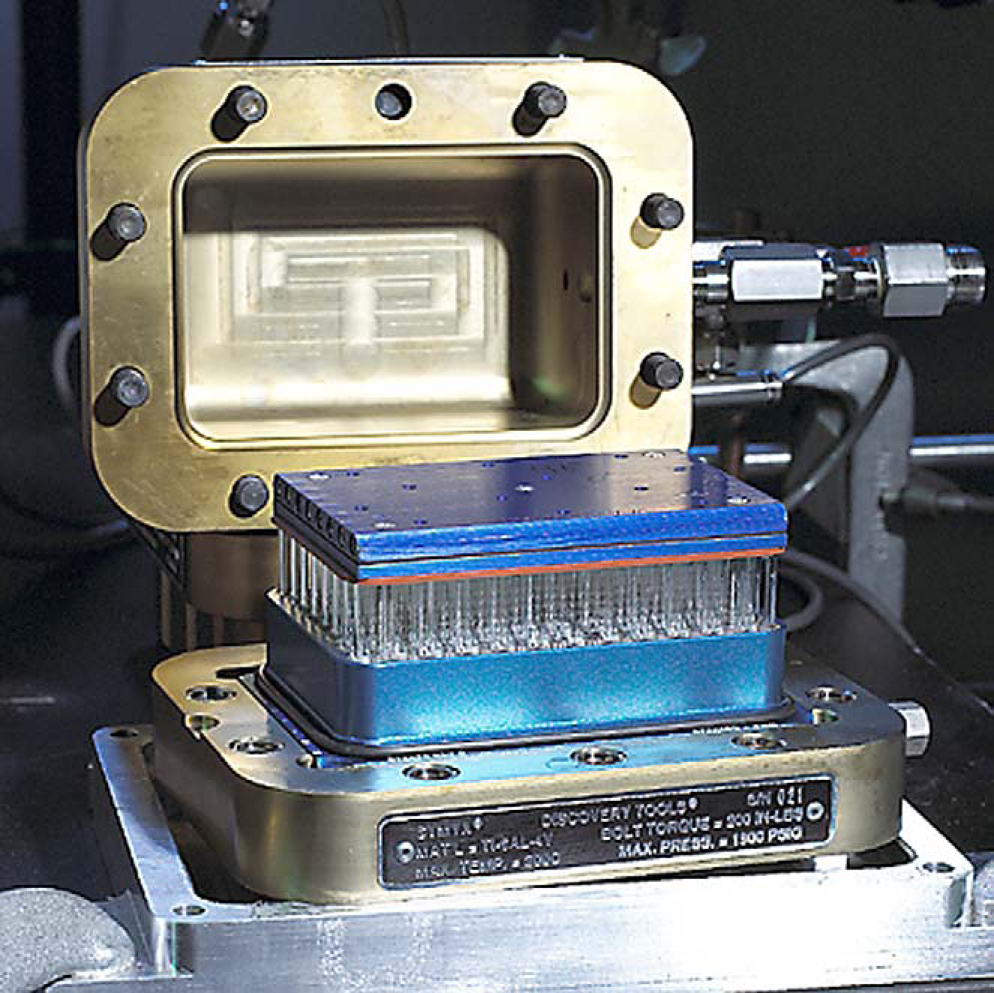
Our choice of software for the design and execution of screening reactions for both homogeneous and heterogeneous hydrogenation reactions has been the Renaissance software suite from Symyx Technologies. Within this suite, Library Studio allows for the visual creation of library designs incorporating all required parameters for the reaction, including materials and their charges, as well as processing parameters such as reaction time, temperature, and pressure (Fig. 1). Information from the library, or reaction, design can then be transferred to a software module for instrument control, which executes the creation of the experiments through use of automated instrumentation for dispensing solids and liquids. Following dispense of the reagents and reactants, the 96-well plate is sealed in a reactor block (Fig. 2) and subjected to processing parameters, within a temperature range of –10 < T < 200 °C and pressure of up to 1500 psi. Following completion of the reaction, liquid-handling robots are used to prepare samples for assay, which includes integration with supercritical fluid chromatography (SFC), HPLC, and GC analysis techniques. Data on the composition of each well, as well as the plate processing parameters, dilution factors, and chromatographic results are stored in an Oracle database, where they are available for searching and visualizing.
Library design layout and processing parameters. 96-well high pressure reaction block.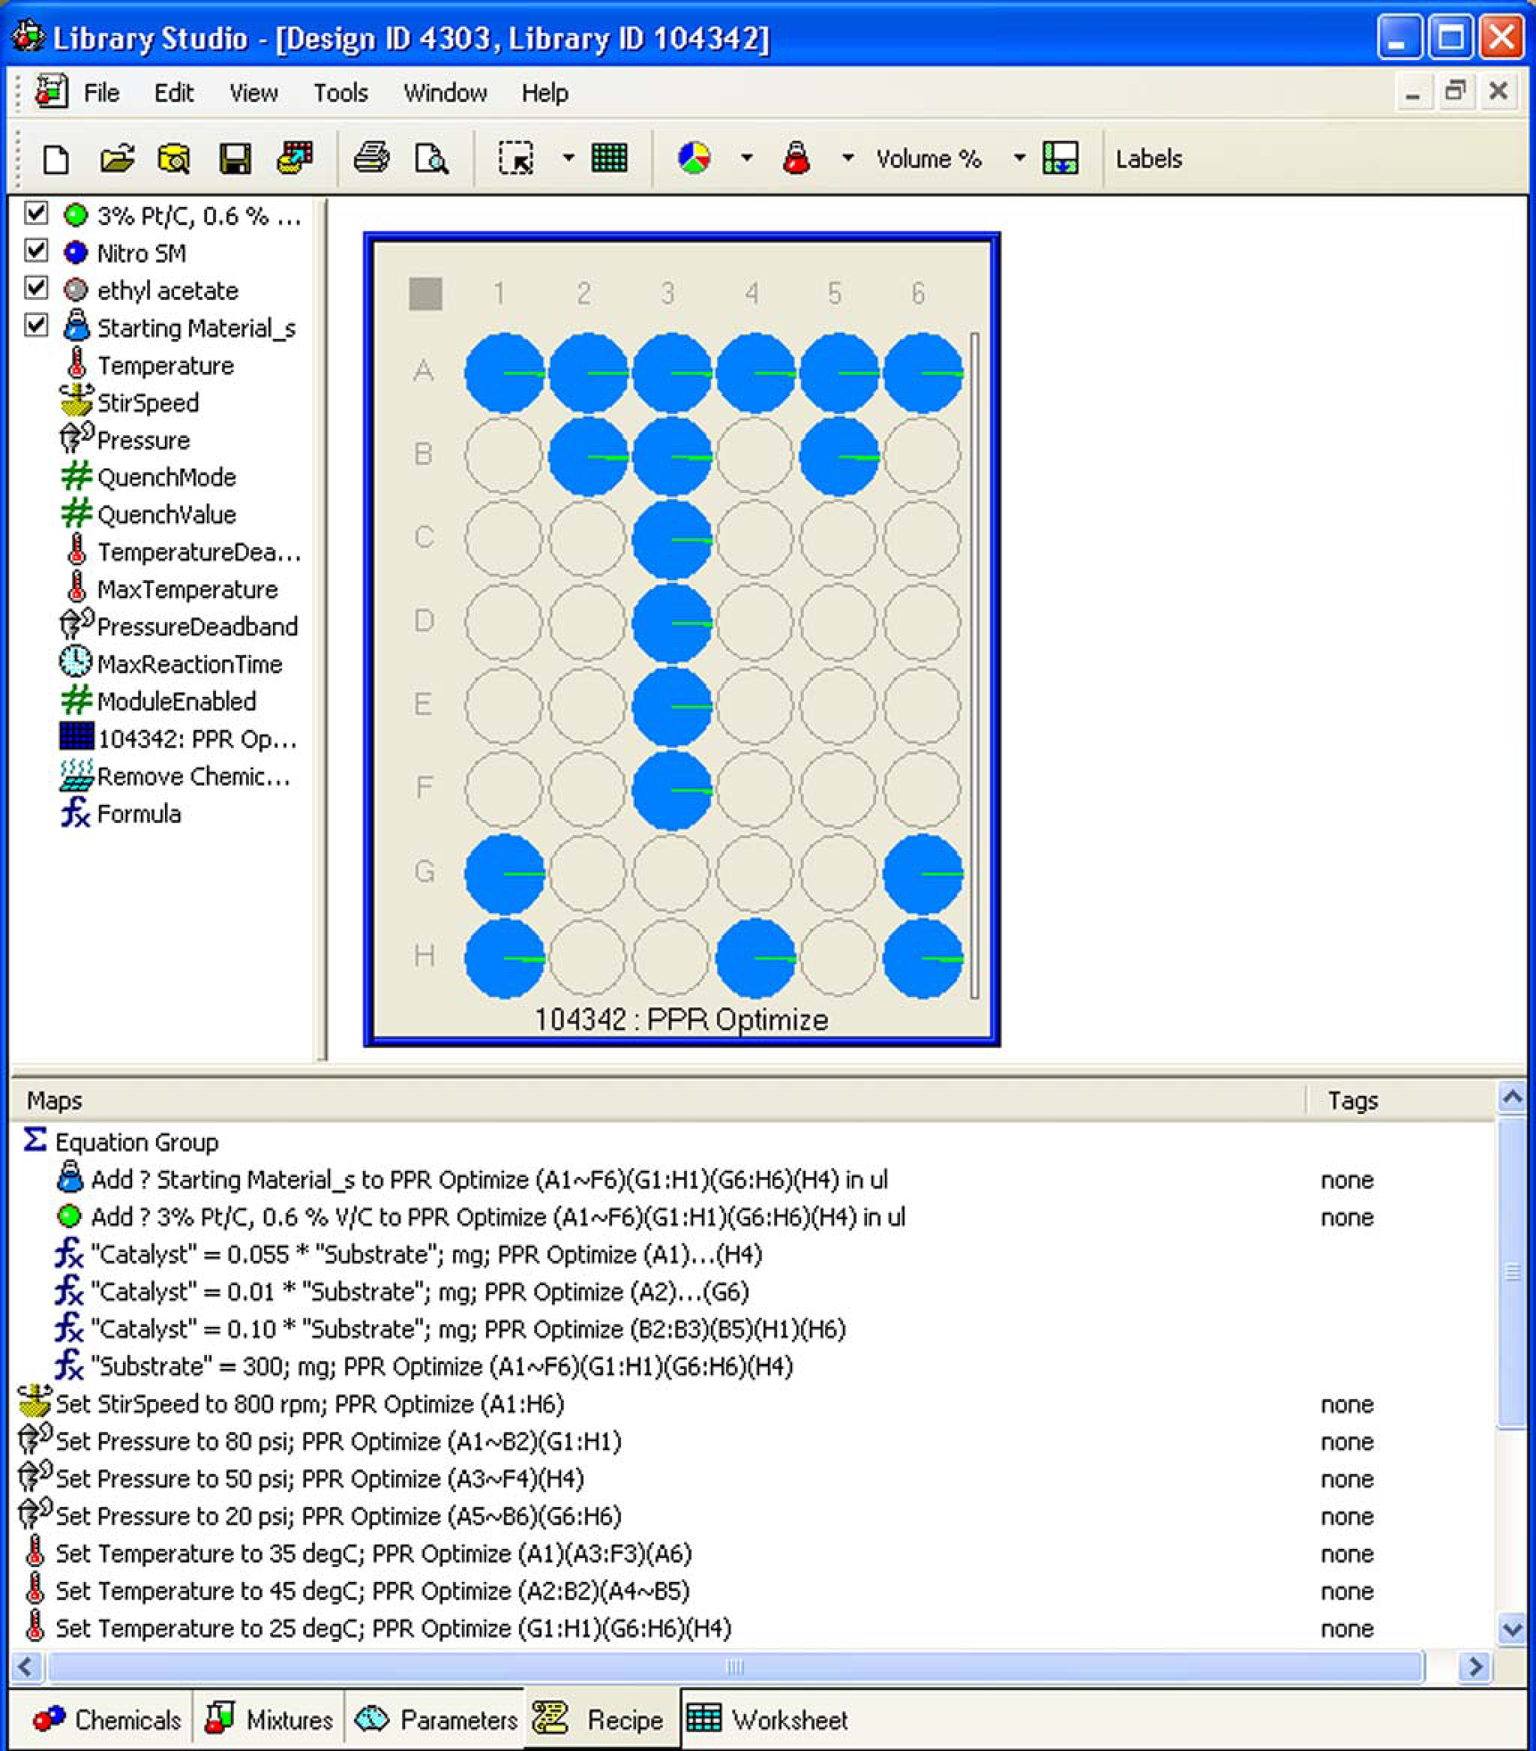
These same software tools are used in conjunction with a 48-well Parallel Pressure Reactor (PPR) (Symyx Technologies, Inc.), originally designed for the polyolefins industry, as a cornerstone of our homogeneous and heterogeneous optimization efforts. The PPR consists of six independent modules of eight reactors each, housed inside a controlled atmosphere glove box (Fig. 3). The modules sit below a dual-arm liquid-handling robot, making automated reaction preparation possible. Each module is completely independent with regard to temperature (25–200 °C), pressure (to 500 psig), agitation, and reaction time. Within each module, all eight reactions are subject to the same stir rate and pressure, whereas there is the opportunity to vary reaction temperature. Each reaction well has individual pressure and gas uptake monitoring. Postreaction, preparation and processing of samples for analysis is identical to the screening system.
48 Reactor PPR system.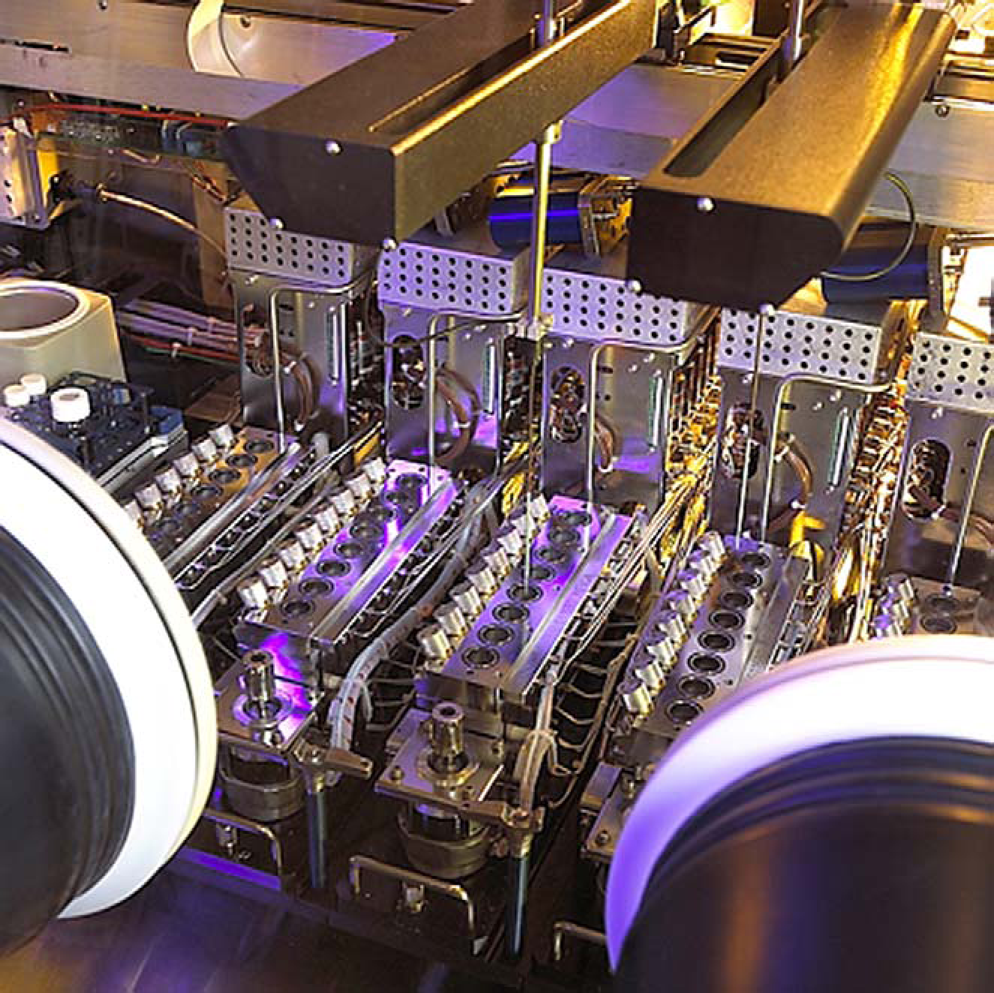
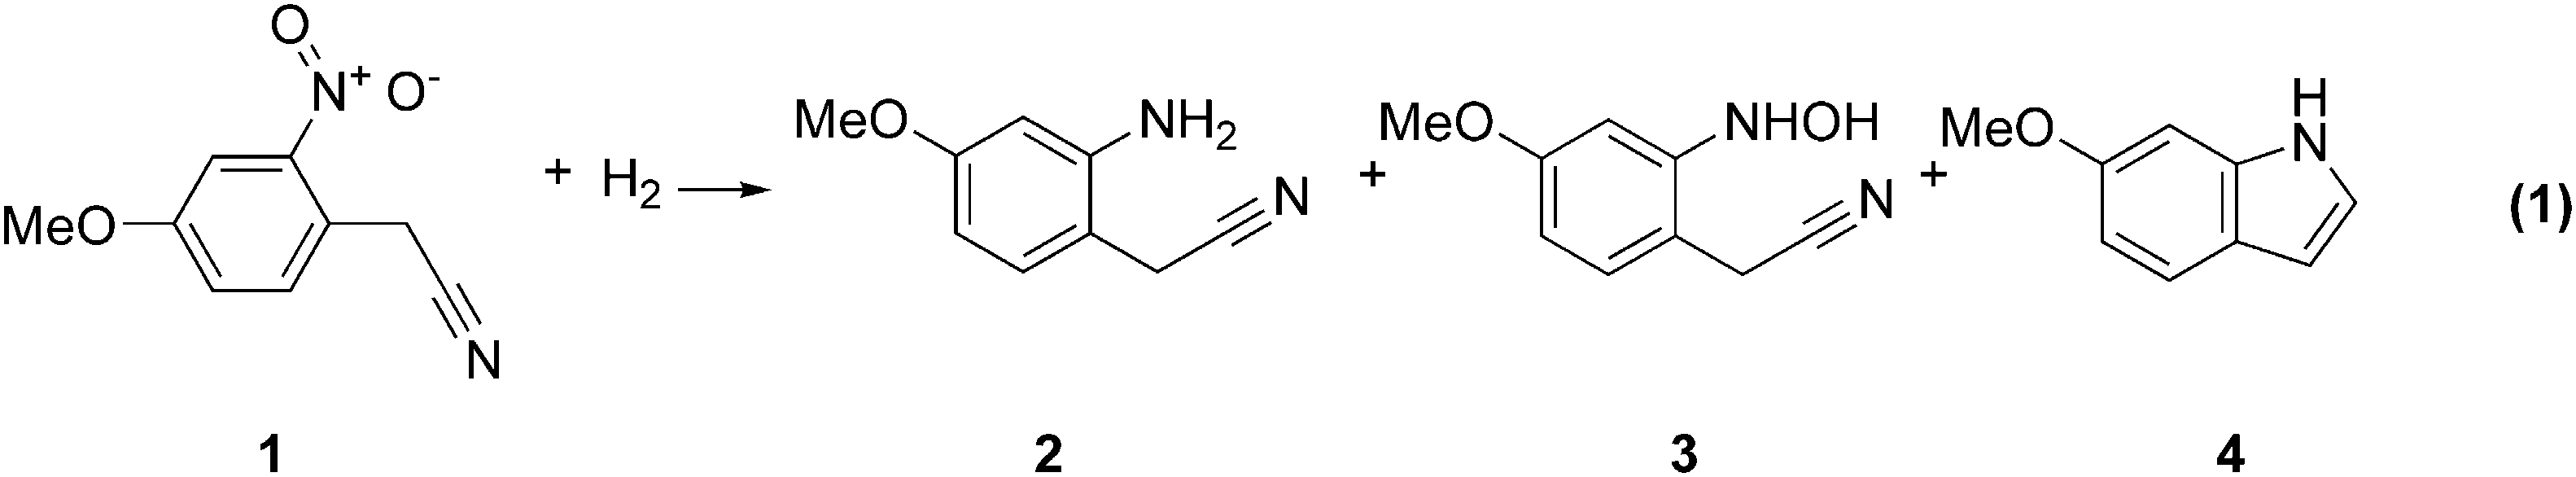
Example 1. Chemoselective Catalytic Reduction of a Nitroaromatic Nitrile
A recent project of interest to us was the selective reduction of nitro compound
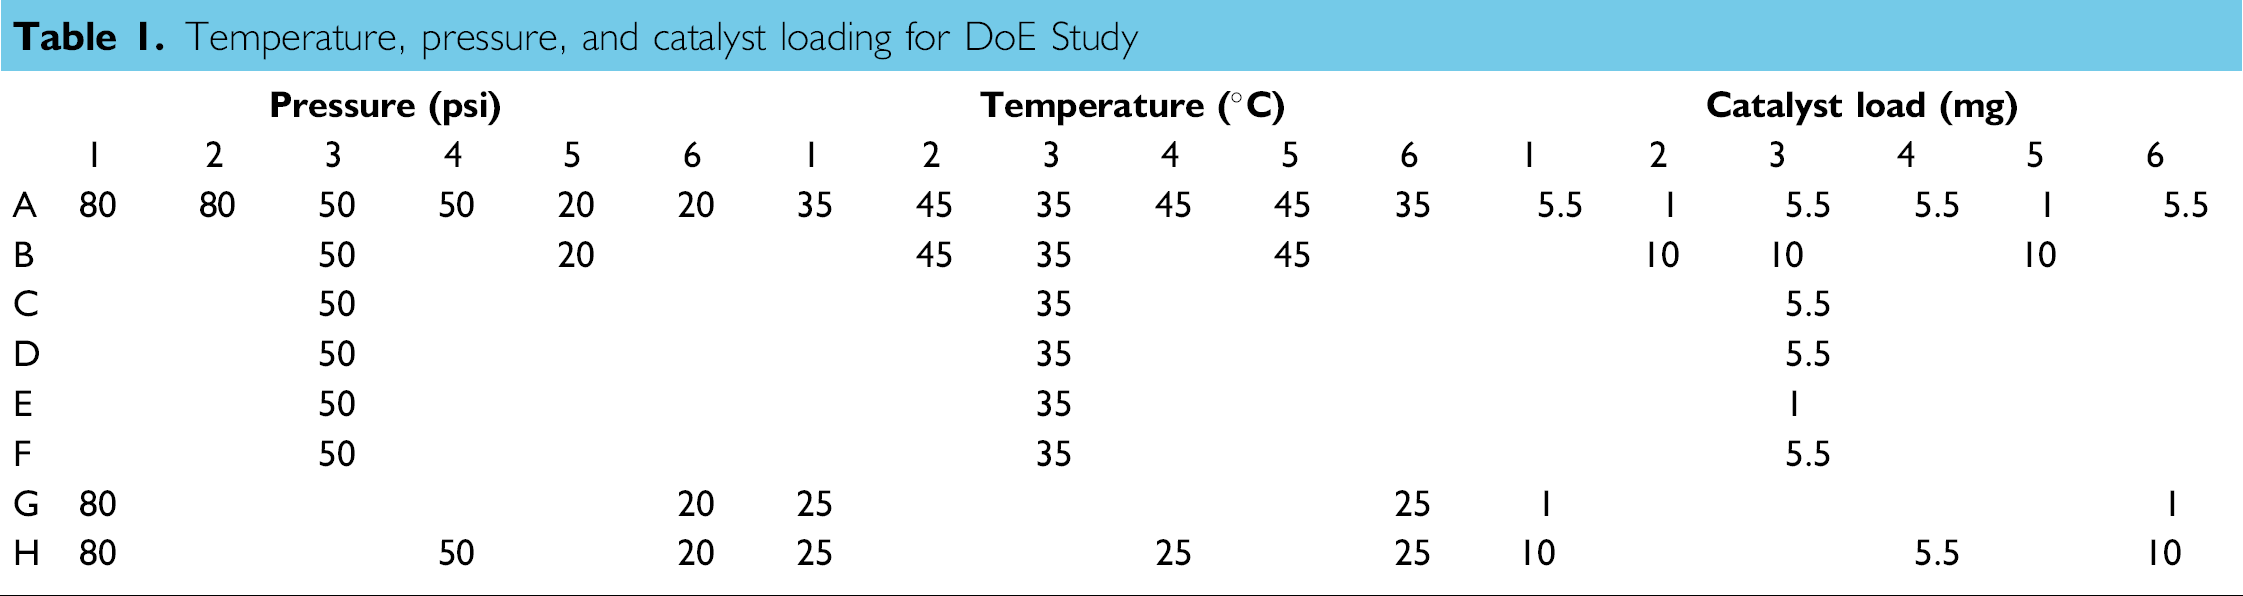
Temperature, pressure, and catalyst loading for DoE Study
Analysis of the resulting 18 experiments afforded a surface response curve for yield of the aniline product that showed a strong dependence of yield on the loading of catalysts, with minimal impact of either temperature or pressure within the range studied (Fig. 4).
Surface response for yield as a function of temperature and catalyst.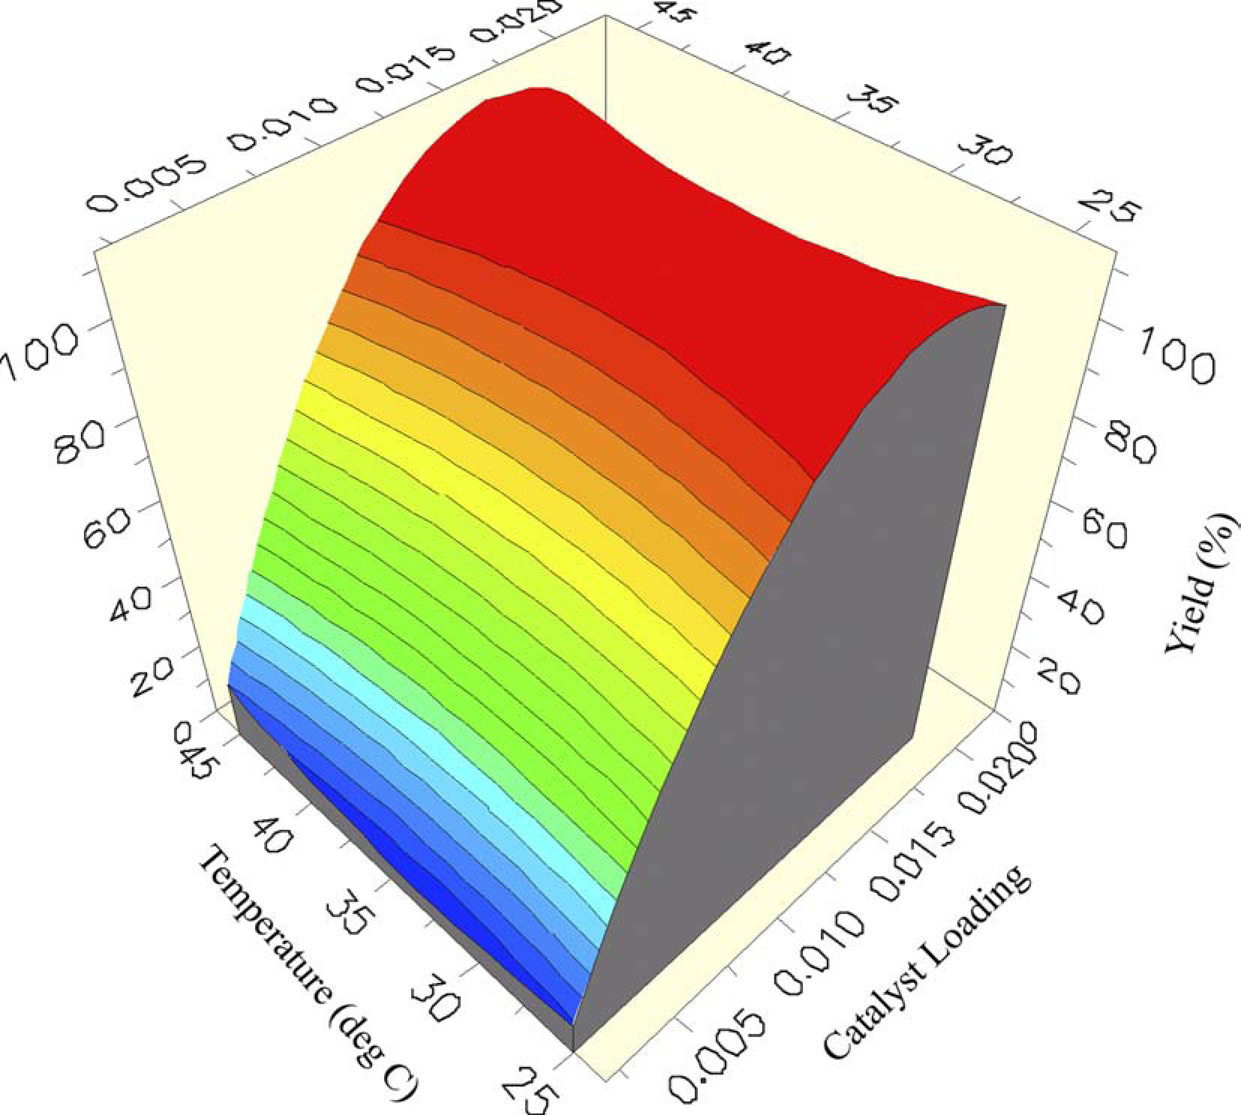
Analysis of the process model showed an F-statistic of 38.1 and P-value of 1.27E–5, indicating that the model was significant, and that there was a very small chance that the observed F-statistic could be due to noise. Likewise, the R 2 value for the significance of the process model was R 2 = 0.977, indicating that the proportion of variation in response around the response mean was explained by the process model, not attributed to random error.
A valuable feature of the PPR is the ability to view gas uptake through real-time monitoring. This feature provides a 3D bar graph of reaction progress across the entire reaction design, as well as the ability to display gas uptake graphs for individual reactions (Fig. 5). These data are useful for determining reaction rate and endpoint. At the end of the reactions, these uptake data can be output for kinetic analysis.
Real-time hydrogen uptake monitoring for each reaction.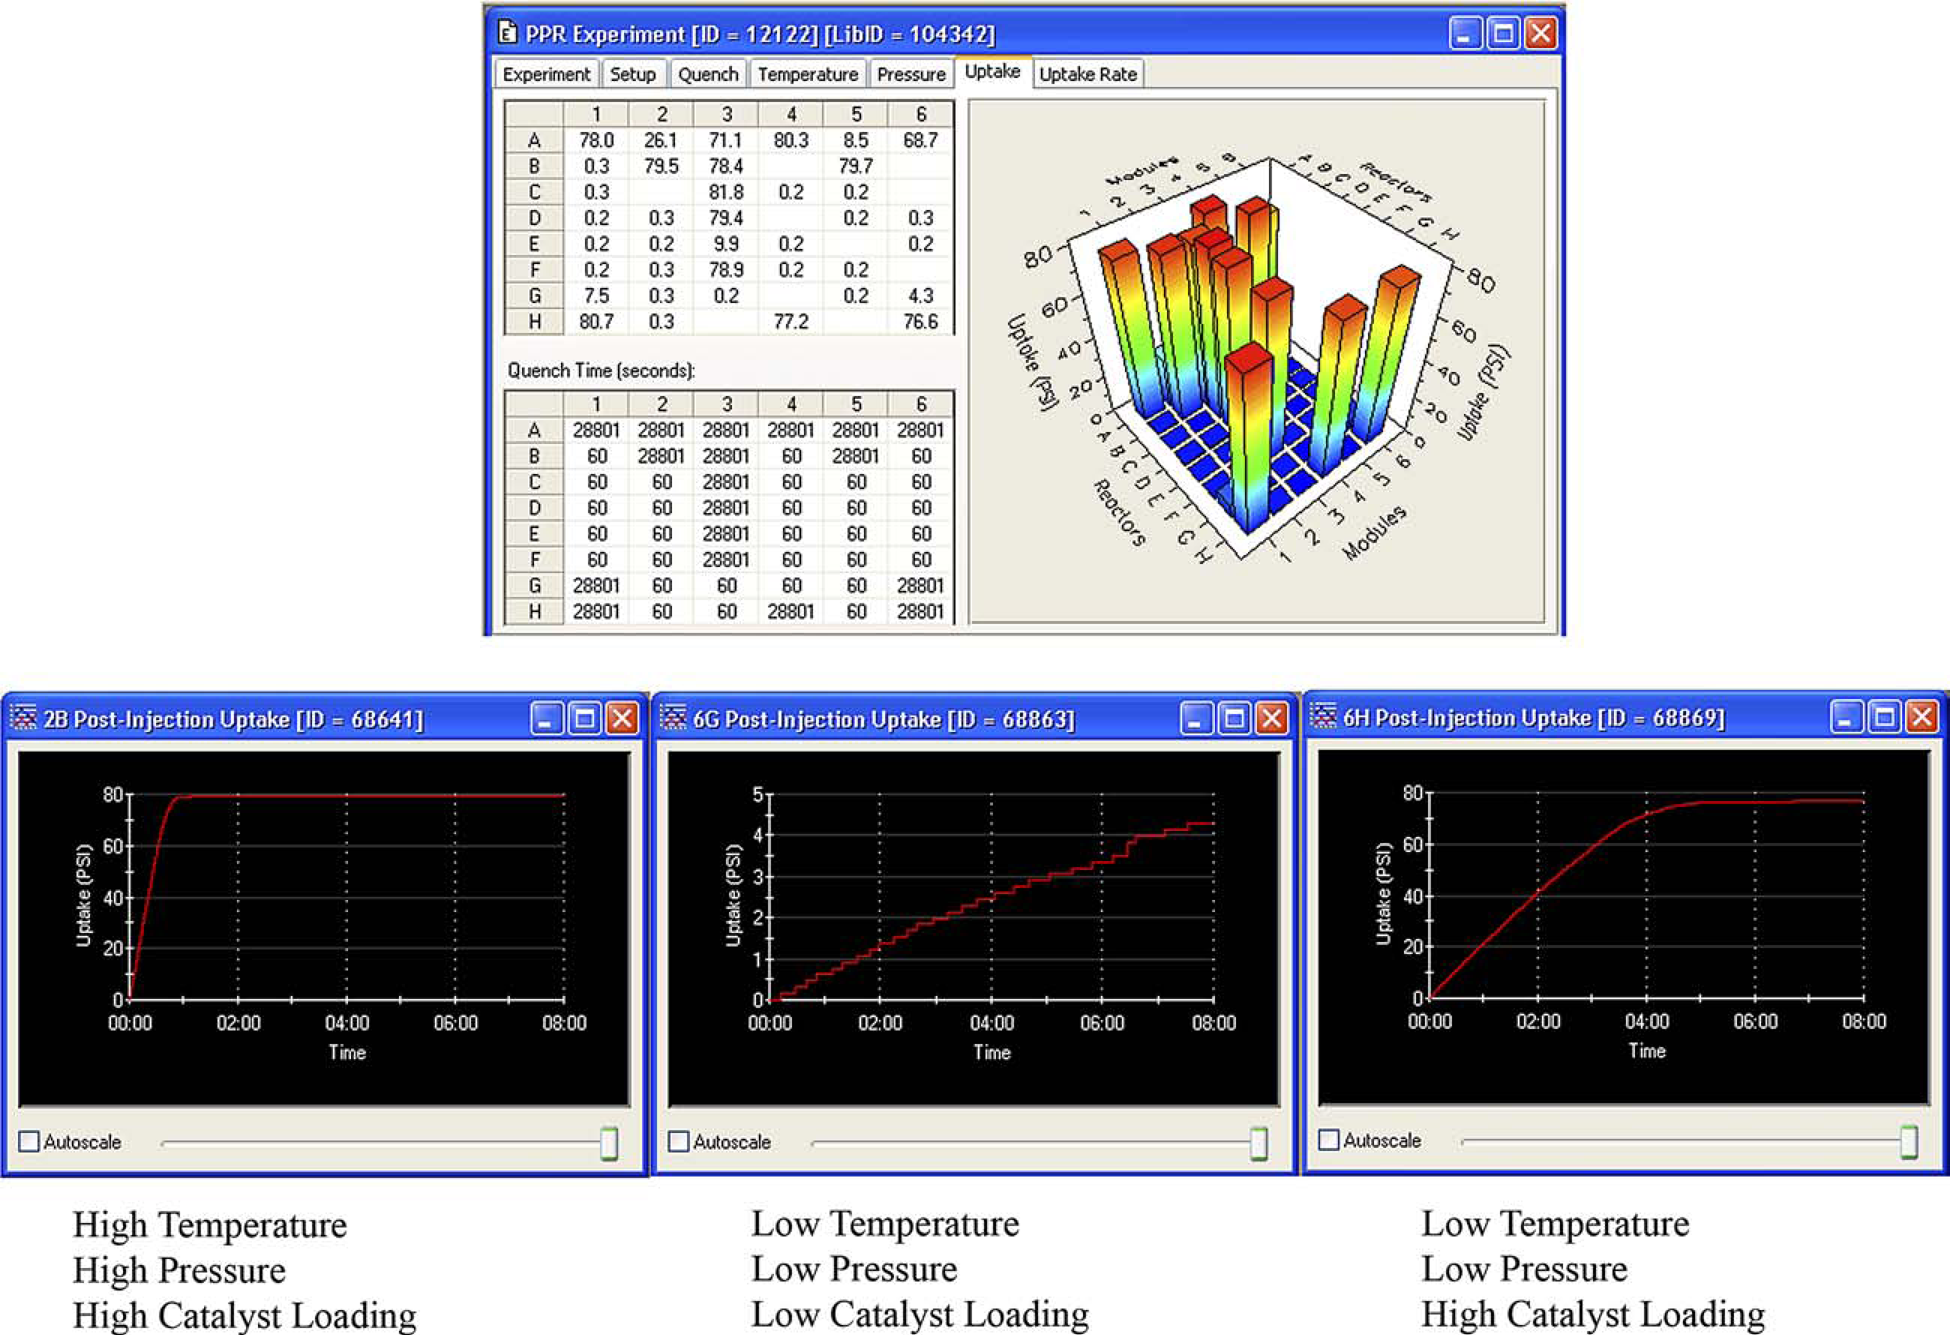
The results of this DoE experiment were obtained very rapidly, in a single PPR run, and provided critical information on the importance of accurately controlling the catalyst charge, while supporting a wide range of temperatures and pressures as operational parameters. The optimal conditions from these experiments, obtained using only a few hundred milligrams of substrate per reaction, were subsequently scaled to multikilo scale confirming the validity of these optimization results.
Example 2. Catalytic Reductive Cyclization of a Nitrostyrene to an Indole
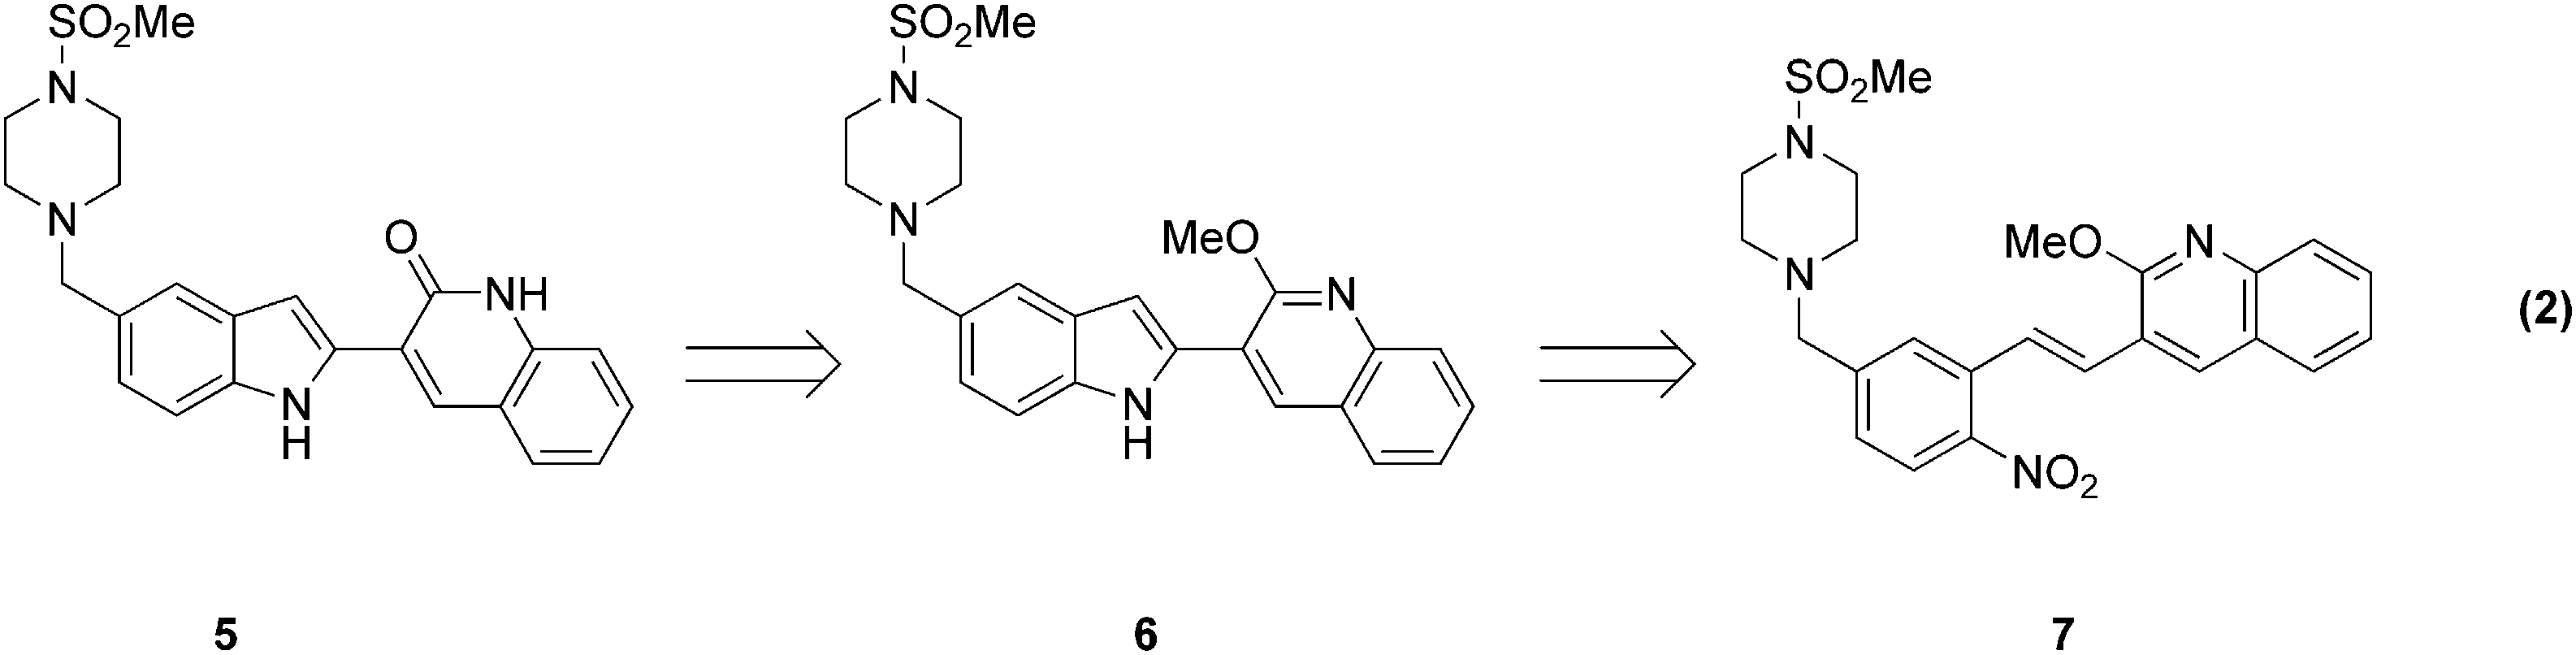
In addition to homogeneous and heterogeneous hydrogenation reactions, these tools are eminently applicable to the screening and optimization of other types of reactions. One example of this is the reductive cyclization of nitrostyrene compounds to afford 2-substituted indoles. (Eq. 2).
Literature precedence suggested that the reductive cyclization of related compounds could be accomplished, but required relatively harsh reaction conditions, typically utilizing 5–10 mol% catalyst, 300–1200 psi CO, and temperatures in excess of 125 °C.5–7
Although the catalyst loading requirements for palladium/phosphine systems reported by Söderberg and co-workers8, 9 were high, the relatively mild temperature and pressure requirements prompted us to evaluate these catalysts for the reductive cyclization of
Graph of yield as a function of catalyst type and catalyst loading.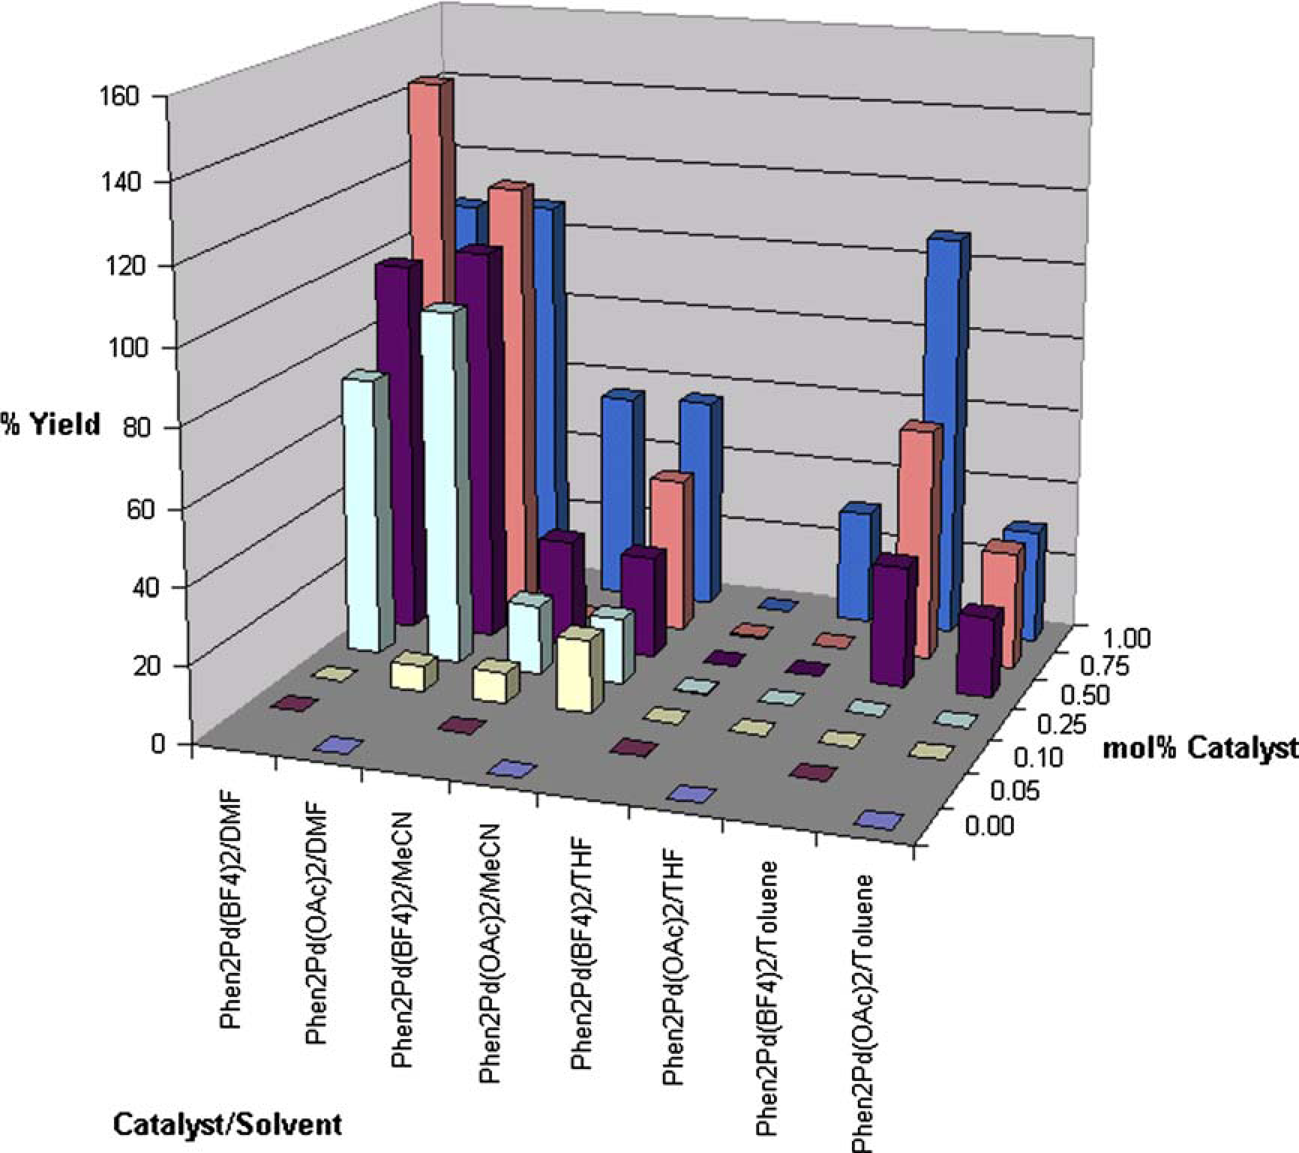
Further screening of catalyst to ligand ratio showed that a 1:7 ratio of palladium trifluoroacetate [Pd(TFA)2] to ligand 3,4,7,8-tetramethyl-1,10-phenanthroline [tm-phen] afforded the highest yield with lowest loading (Fig. 7).
Graph of yield as a function of catalyst type and ligand loading.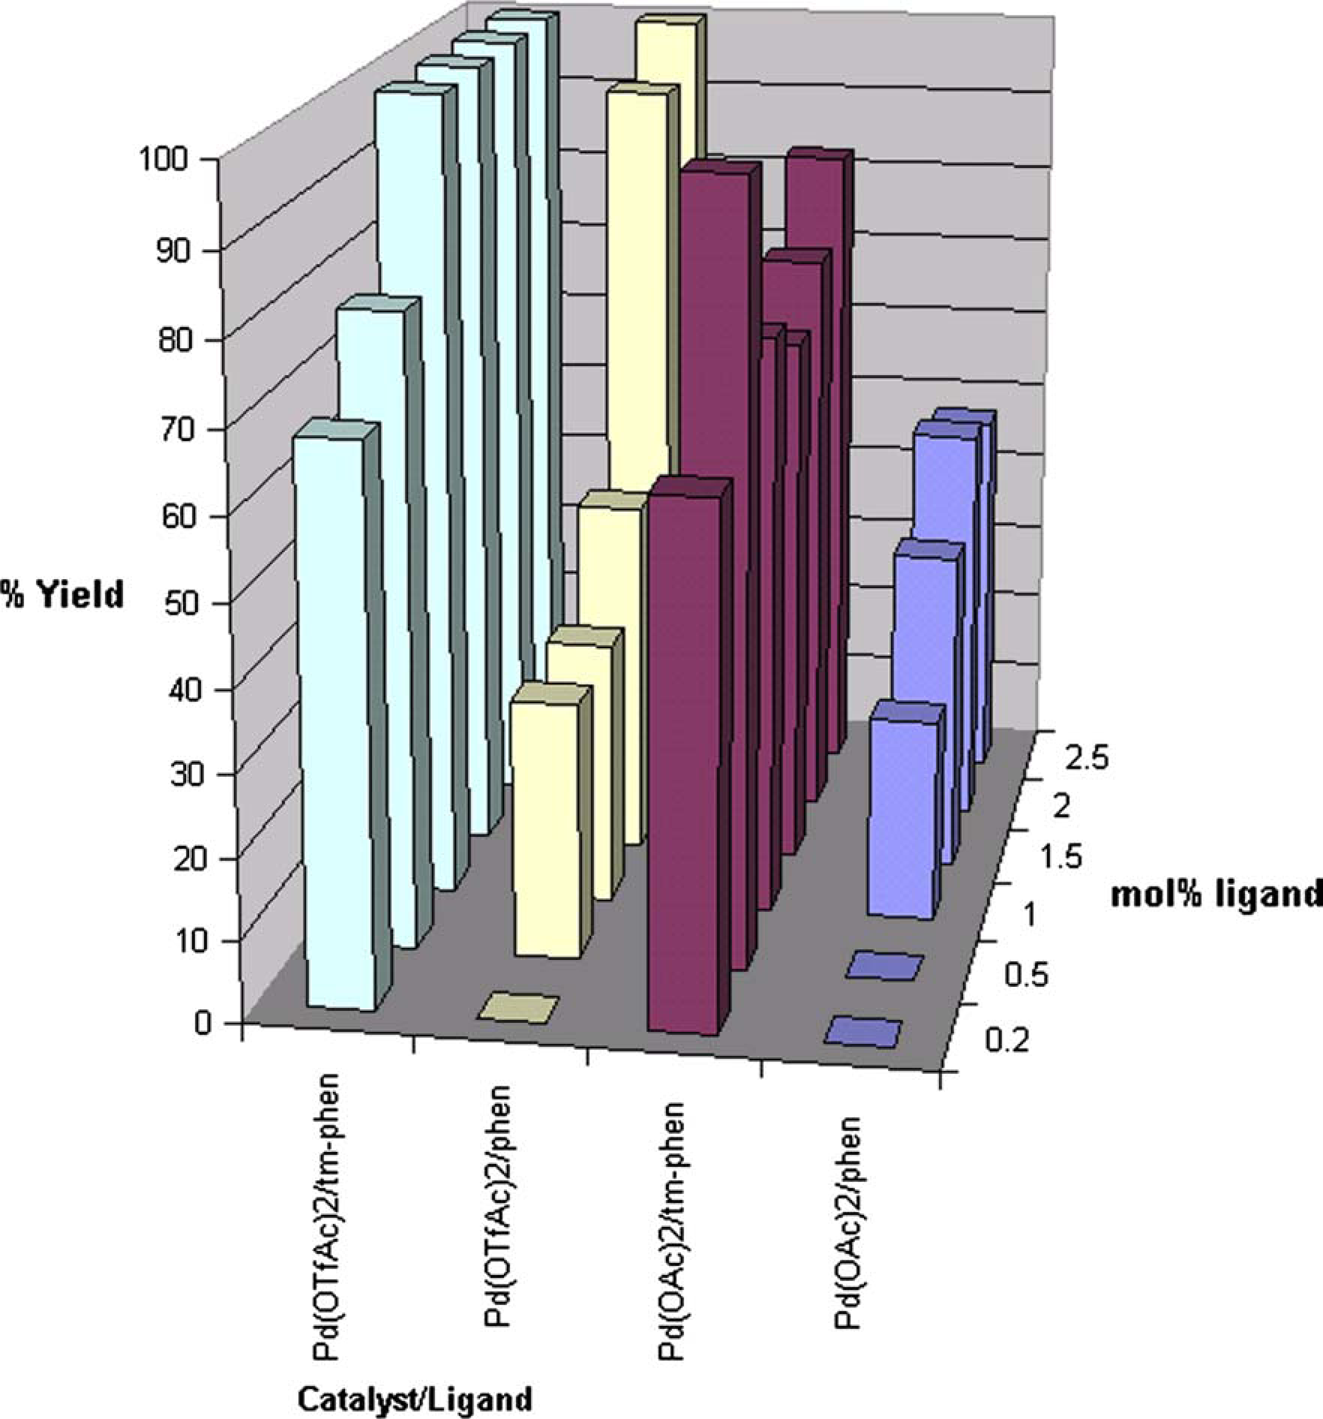
Key to obtaining reproducible yields at low catalyst loading (0.1 mol% Pd), it was imperative to prepare and charge the catalyst/ligand mixture in an air-free environment. Optimization of temperature and pressure using DoE afforded an optimum yield at 70–80 °C and 15 psi CO (DoE). The results of these experiments culminated in an efficient and environmentally friendly reductive cyclization process to prepare
Example 3. Diastereoselective Catalytic Hydrogenation of an Unsaturated Ester
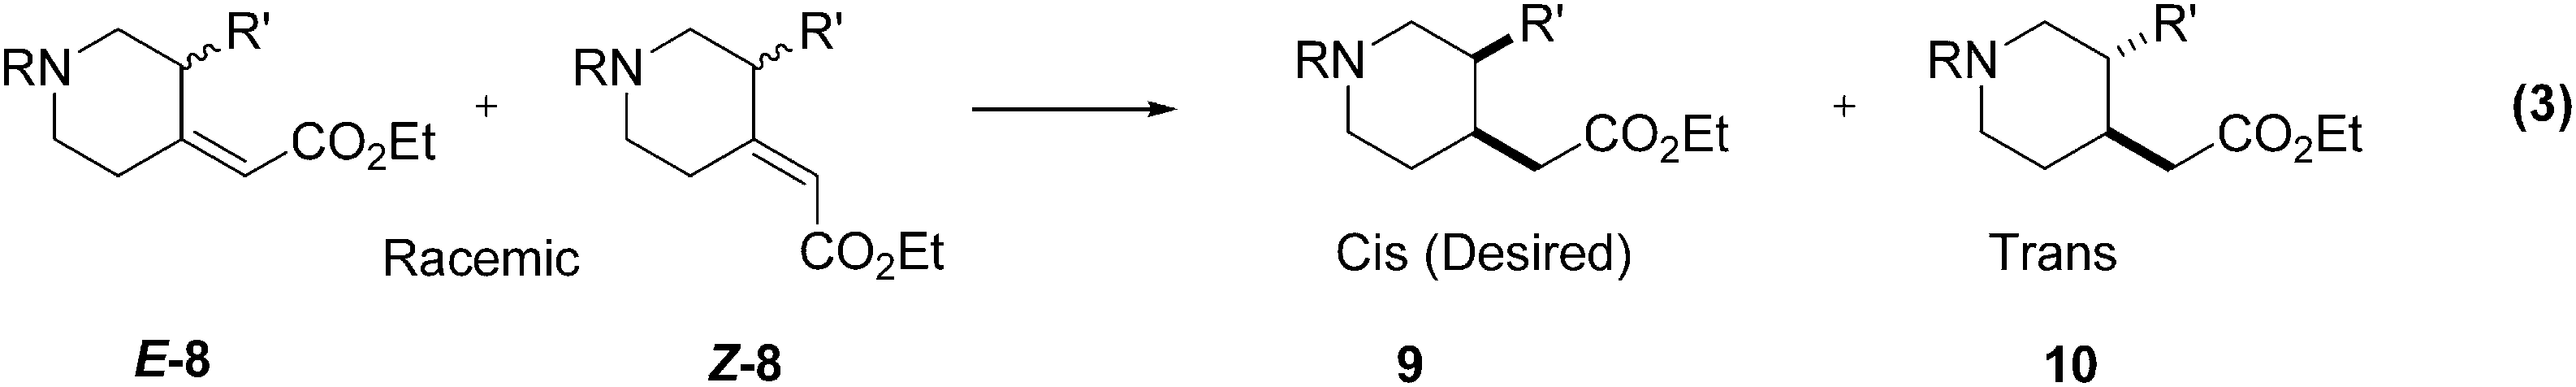
The diastereoselective unsaturated ester reduction outlined in (Eq. 3) was a key step in route to a preclinical drug candidate. The project objectives were to deliver bulk quantities of the drug candidate in the shortest time possible and with a minimum of resources. Thus, no time would be allocated towards development of new synthetic routes, and little time could be used to optimize the current route.
The cis-ester
Several heterogeneous catalysts, including Pd/C, Pt/C, Raney Ni, and Raney Co, had been examined, but all yielded inferior results.
We did not pursue an extensive screen of asymmetric homogeneous catalysts because the timeline did not allow for the usual lead times needed to acquire appropriate quantities of all but a few commercially available catalysts. In addition, the probability of success was reduced by the fact that
Results of the initial screens are shown in Table 2. The first set of screening experiments (entries 1–5) quickly identified Wilkinson's catalyst as an attractive catalyst candidate.
14
In addition, less than 3% of the uncharacterized impurity was present in any of the runs, an additional benefit of homogeneous catalyst compared to the heterogeneous catalysts studied. A second, limited solvent screen with Wilkinson's catalyst (entries 6–9) indicated several possible options with THF appearing to provide the optimal combination of conversion and selectivity.
c
Thus, within two limited screening runs, we had identified the catalyst and solvent. We conducted a final set of runs in the Fisher–Porter bottles to evaluate concentration effects. Over a 2–8 mL range of THF per gram of
The solvents were selected based upon a combination of practicality of implementation and previous internal experience with hydrogenations employing homogeneous catalysts.
Initial homogeneous catalyst and solvent screening results
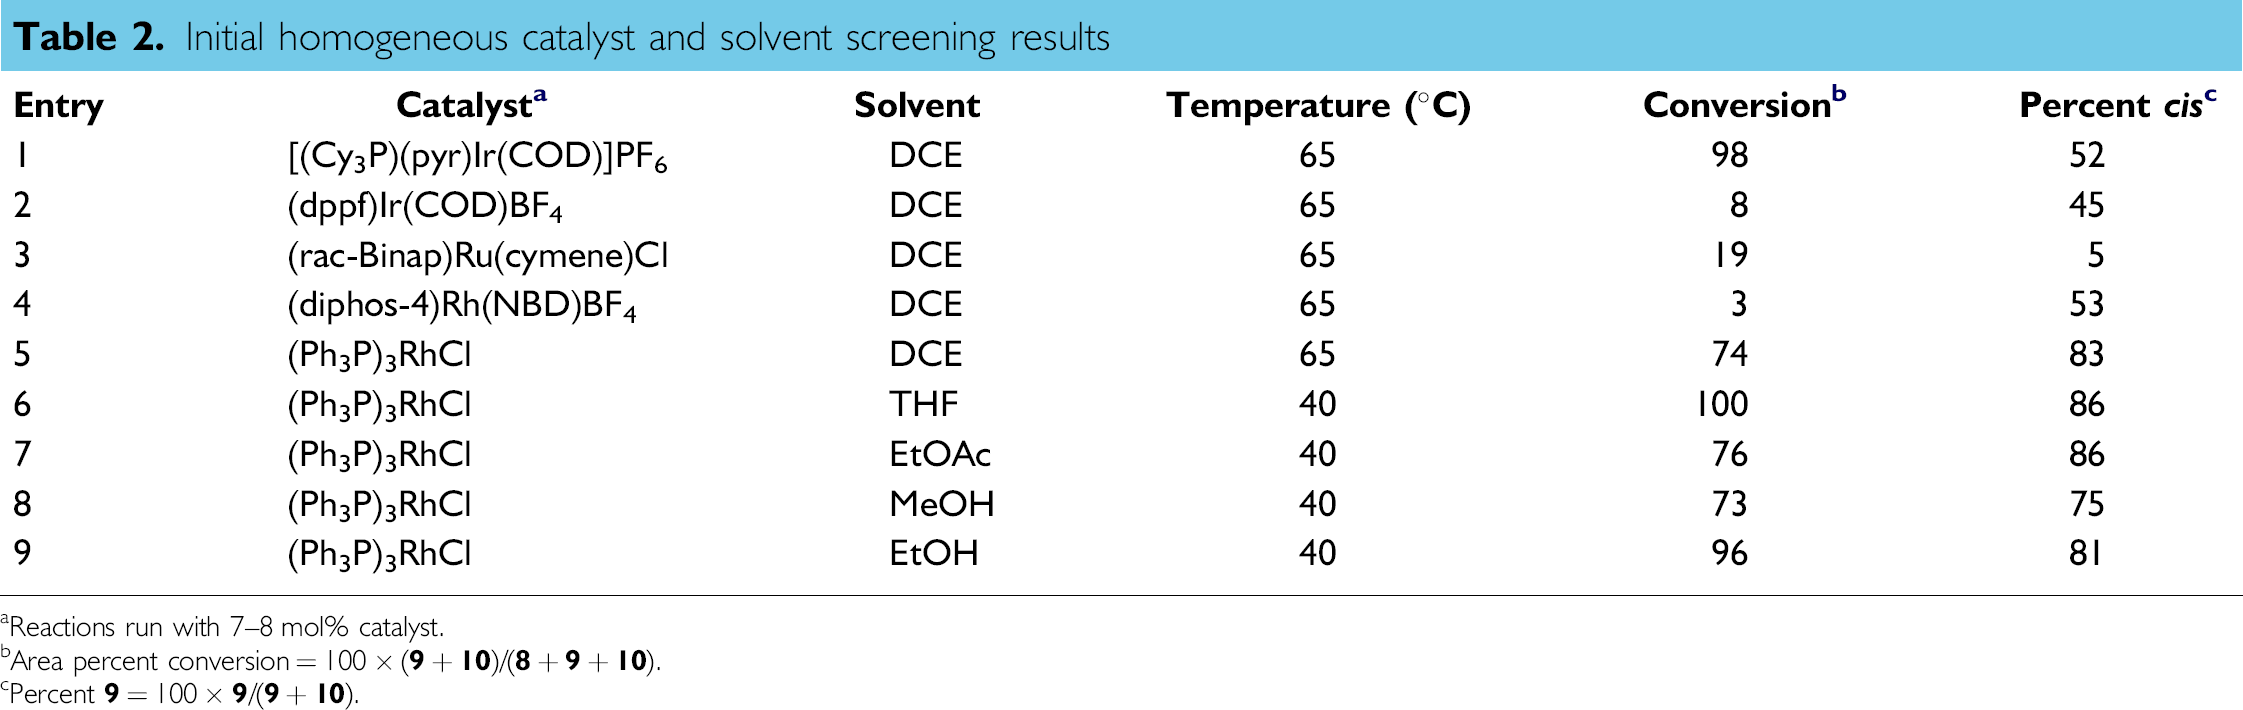
Reactions run with 7–8 mol% catalyst.
Area percent conversion = 100 – (
Percent
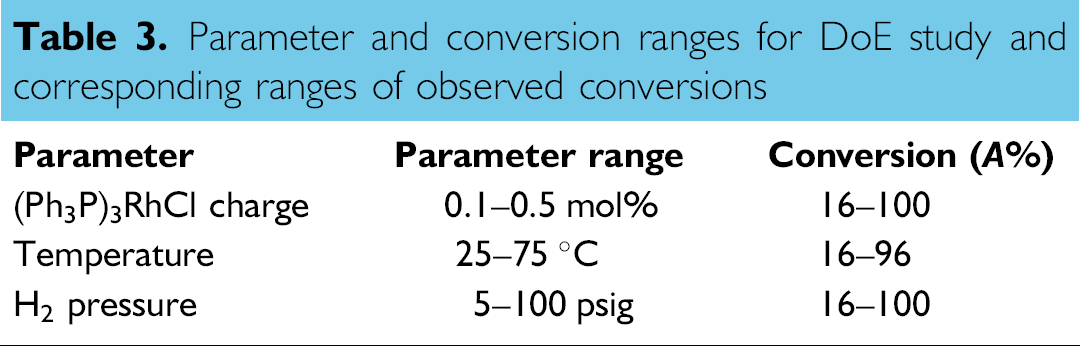
The conditions of the screening runs were not practical on scale due to the high catalyst loading employed. In addition, it was not possible to determine the range of parameters allowable to achieve maximum yield and product quality. Thus, the next phase of development was to optimize parameters such as temperature, pressure, and catalyst loading to maximize yield while minimizing catalyst charge. Traditionally, process chemists would use a stepwise approach (i.e., one-factor-at-a-time) to optimization. However, these parameters are well suited for a DoE strategy, and the resultant experimental designs can be completed in a single run as a set of PPR experiments. Accordingly, the DoE experimental design was formulated in Library Studio (Central Composite – face centered design, with four center point replicates for a total of 18 experiments), and the reactions were conducted in the Symyx PPR system. The conversions ranged from low to high for each parameter, indicating that each has a significant impact on the reaction in the ranges examined. All reactions at the lowest temperature examined, 25 °C, resulted in incomplete conversion, even at the highest catalyst loading and pressure examined (Table 3).
Parameter and conversion ranges for DoE study and corresponding ranges of observed conversions
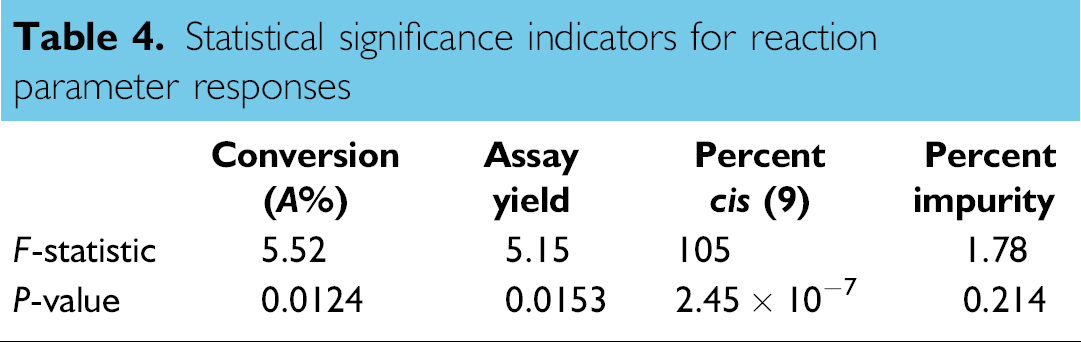
We used the F-statistic and P-value to evaluate the statistical significance of each parameter response (Table 4). The values for the percent cis-ester (
Statistical significance indicators for reaction parameter responses
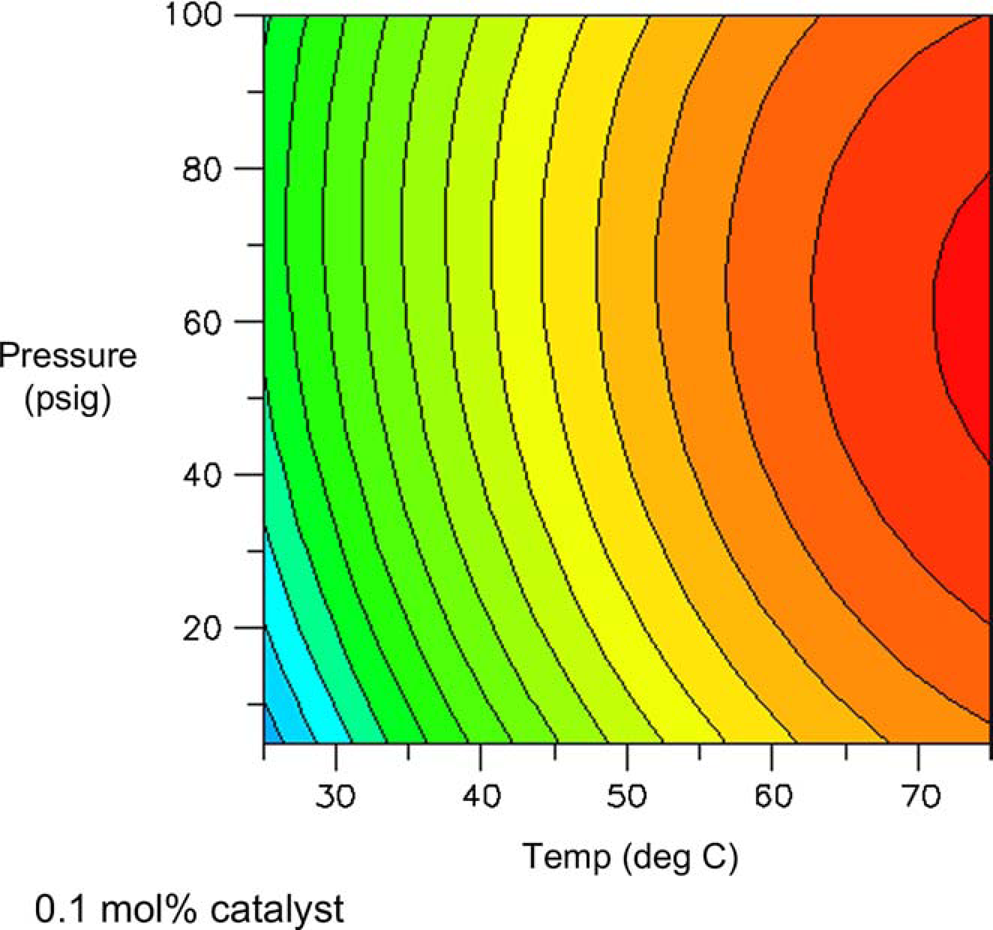
One might expect total conversion (i.e., conversion of all starting materials to all products) to increase proportionally with temperature and pressure. Figures 8 and 9 are surface and contour plots of the total conversion as a function of temperature and pressure at the lower catalyst charge limit of 0.1 mol%. For the most part, one observes the expected trend, with the conversion having a larger response to temperature compared to pressure. However, the maximum yield is not found at the confluence of the highest pressures and temperatures. At the upper limit of catalyst charge (0.5 mol%), a similar trend is observed. Under these conditions, the highest conversion occurs over a broad range of temperatures and pressures, but still excludes the area wherein the highest pressure and temperature meet. This important result allows the process chemist to set limits, both on the lower and upper ranges of these parameters.
Surface plot of conversion as a function of temperature and pressure at 0.1 mol% catalyst. Contour plot of conversion as a function of temperature and pressure at 0.1% catalyst.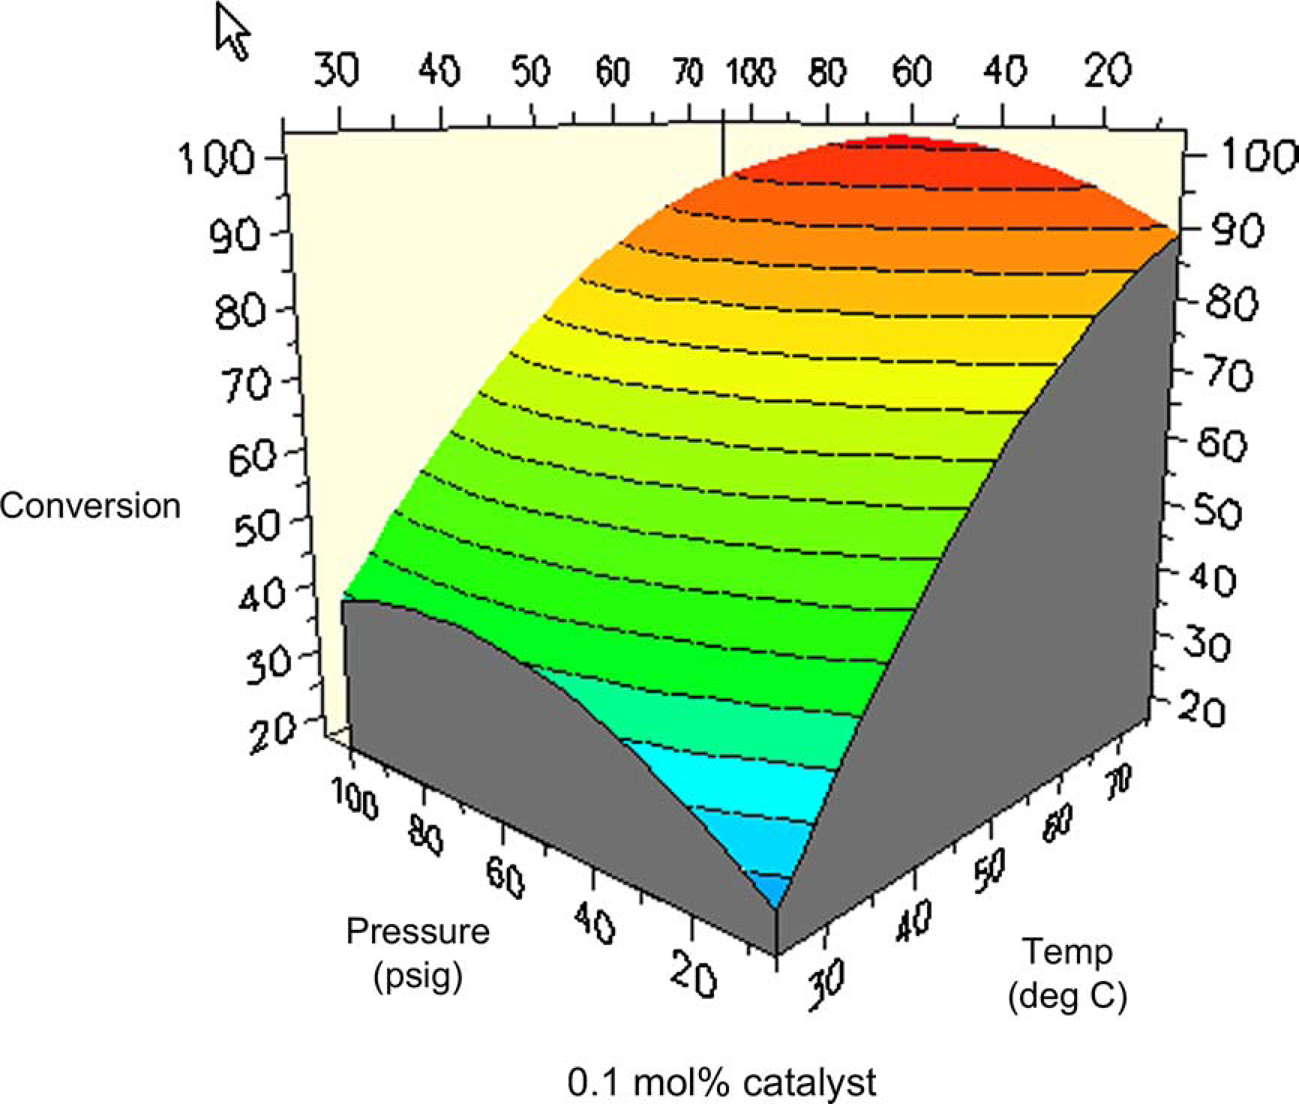
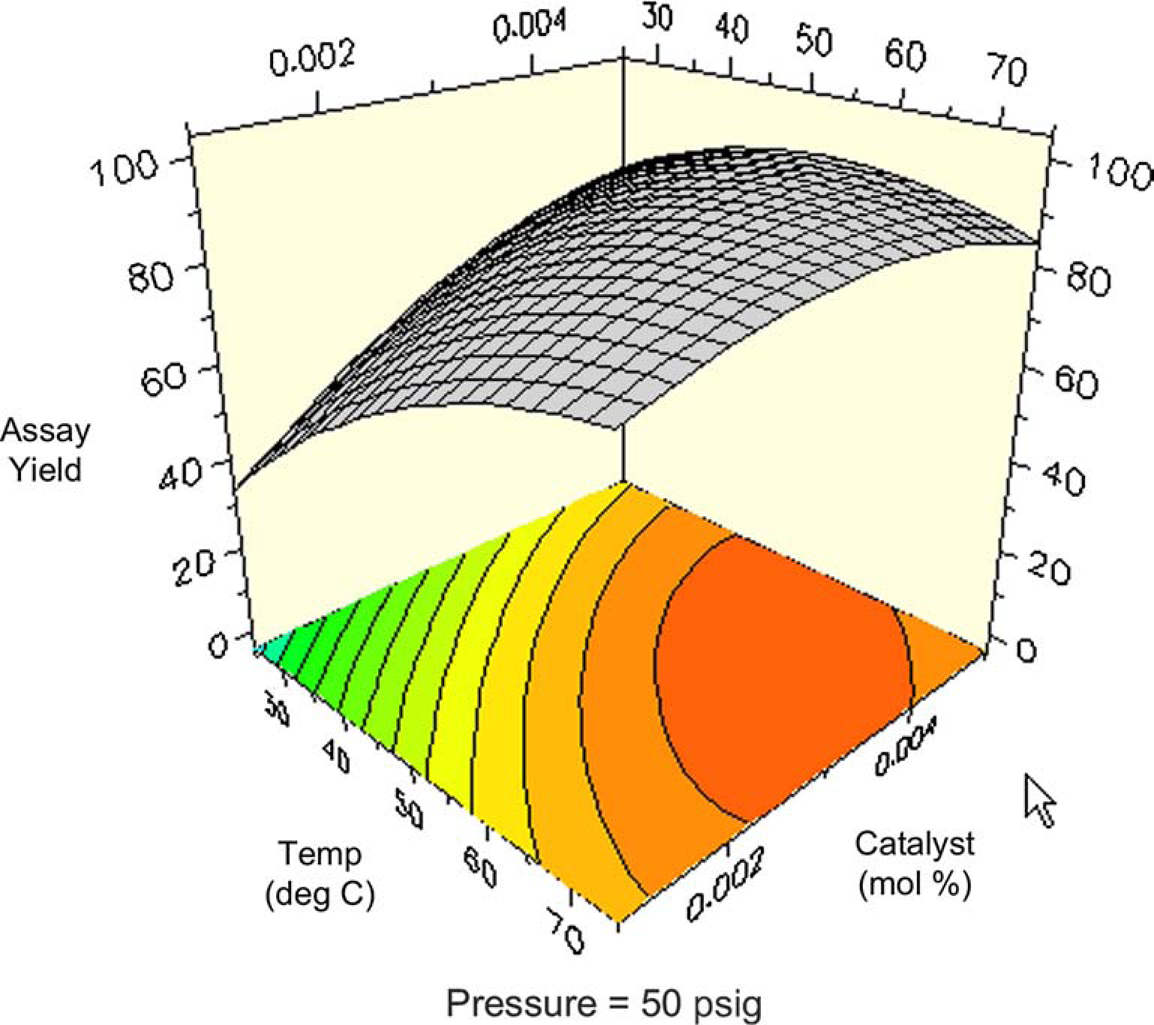
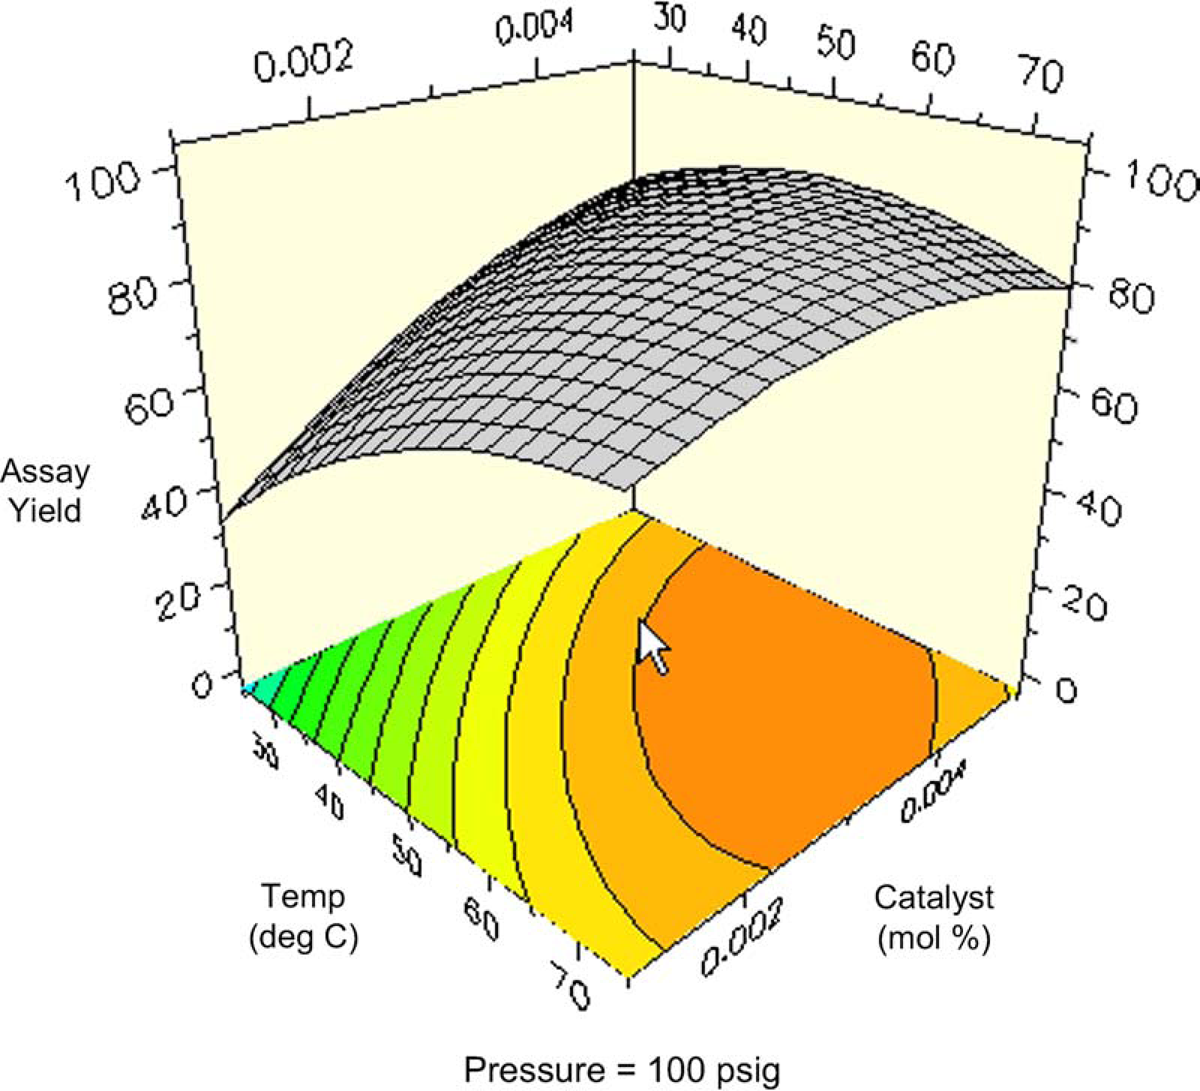
Figures 10 and 11 are contour plots of the assay yield of
Contour plot of assay yield of Contour plot of assay yield of 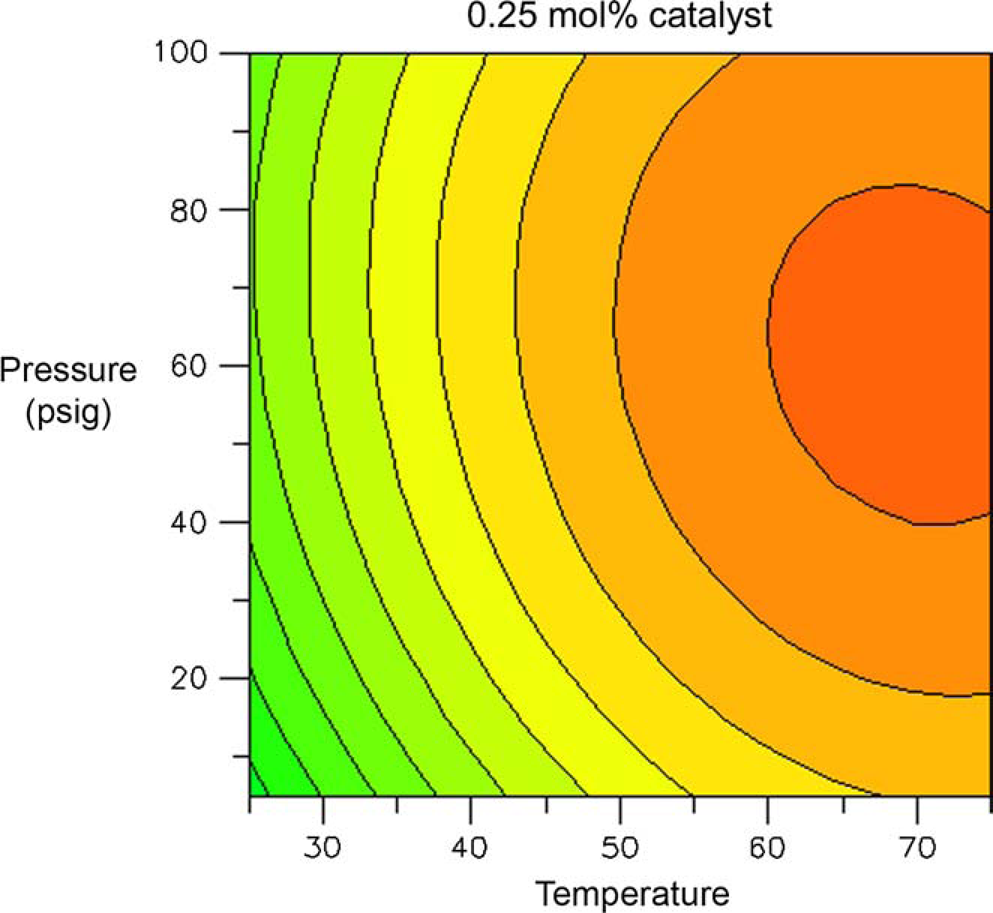
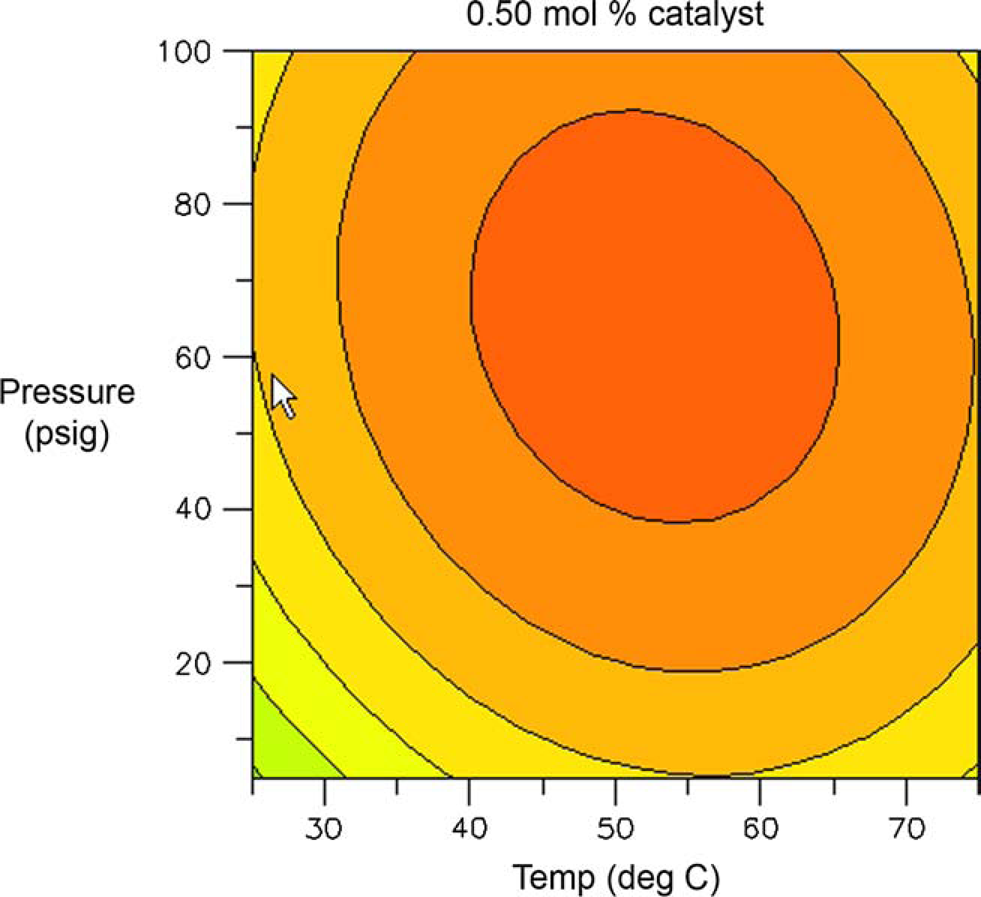
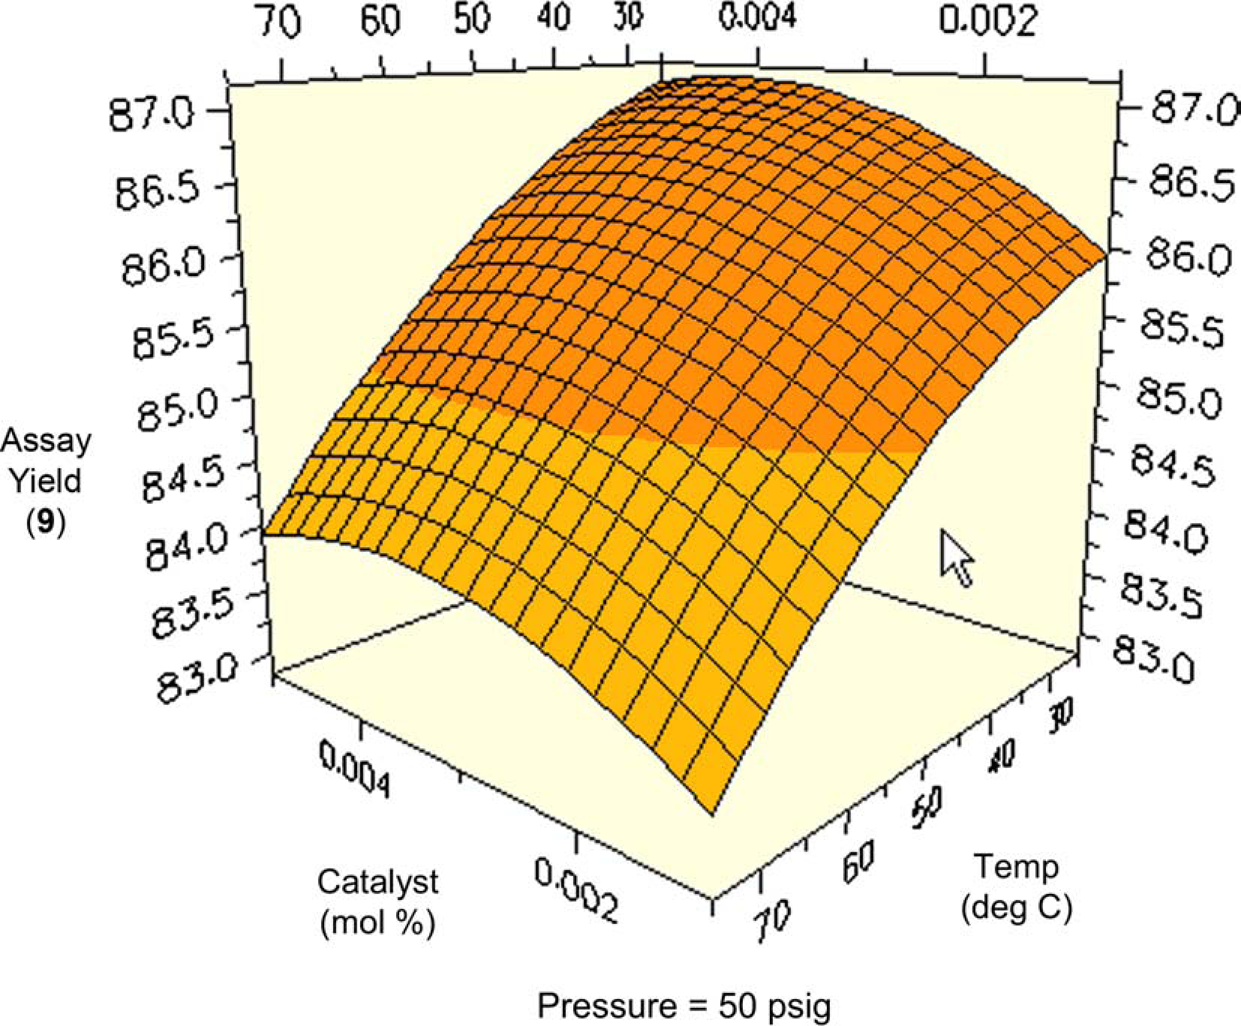
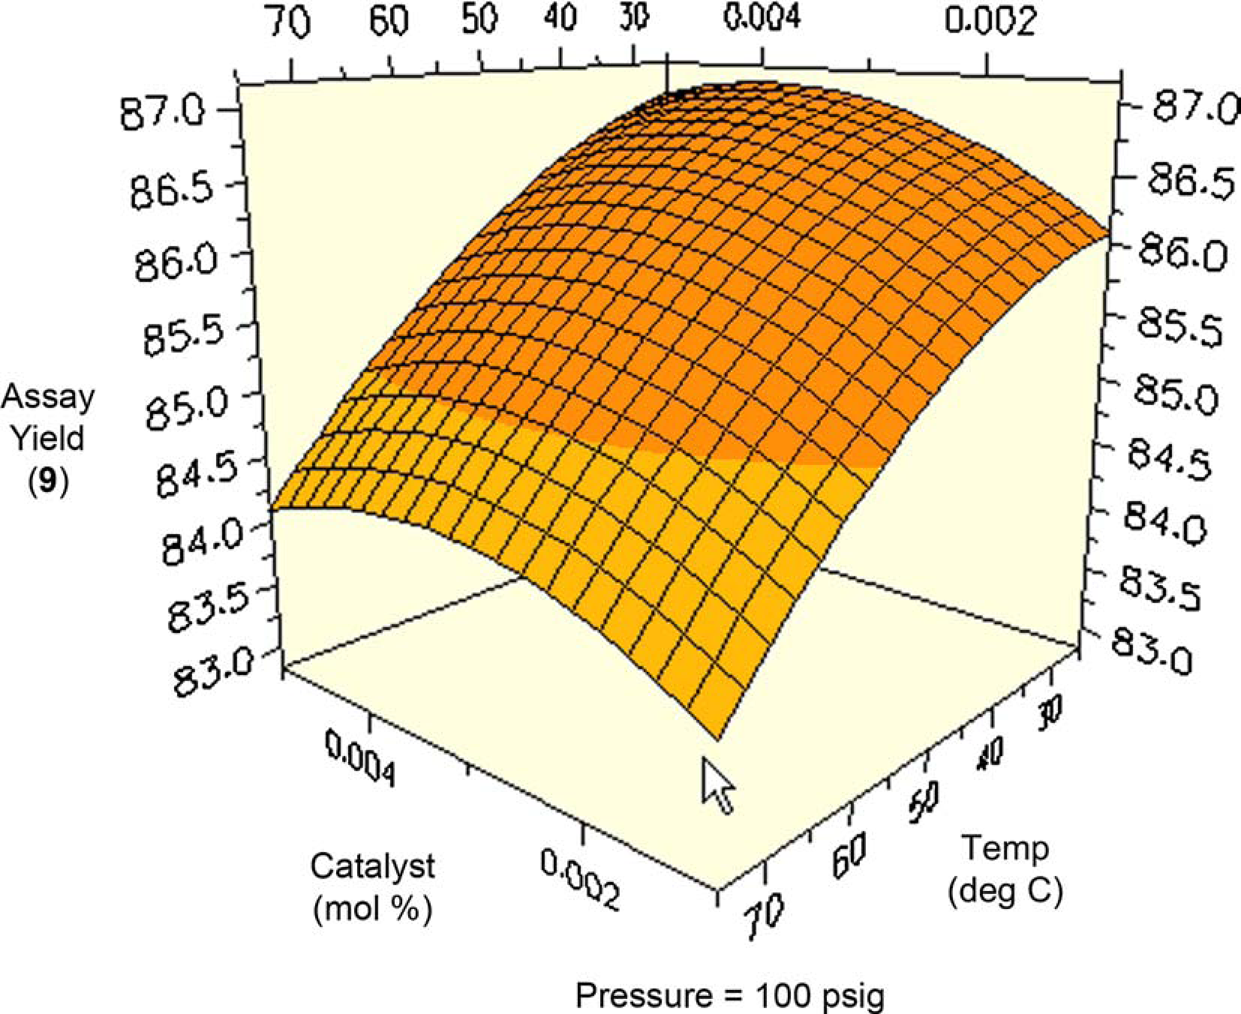
The stereoselectivity in the reduction ranged from 83% to 87% cis over the entire range of the study (Figs. 12–14). Surface plots indicate that stereoselectivity is essentially independent of pressure, while decreasing with increasing temperature. All the surface plots in Figures. 12–14 have roughly the same shape, with the optimal catalyst charge at neither highest nor lowest ranges. The lowest selectivity occurs at low pressure, low catalyst charge, and high temperature.
Percent cis-ester Percent cis-ester Percent cis-ester 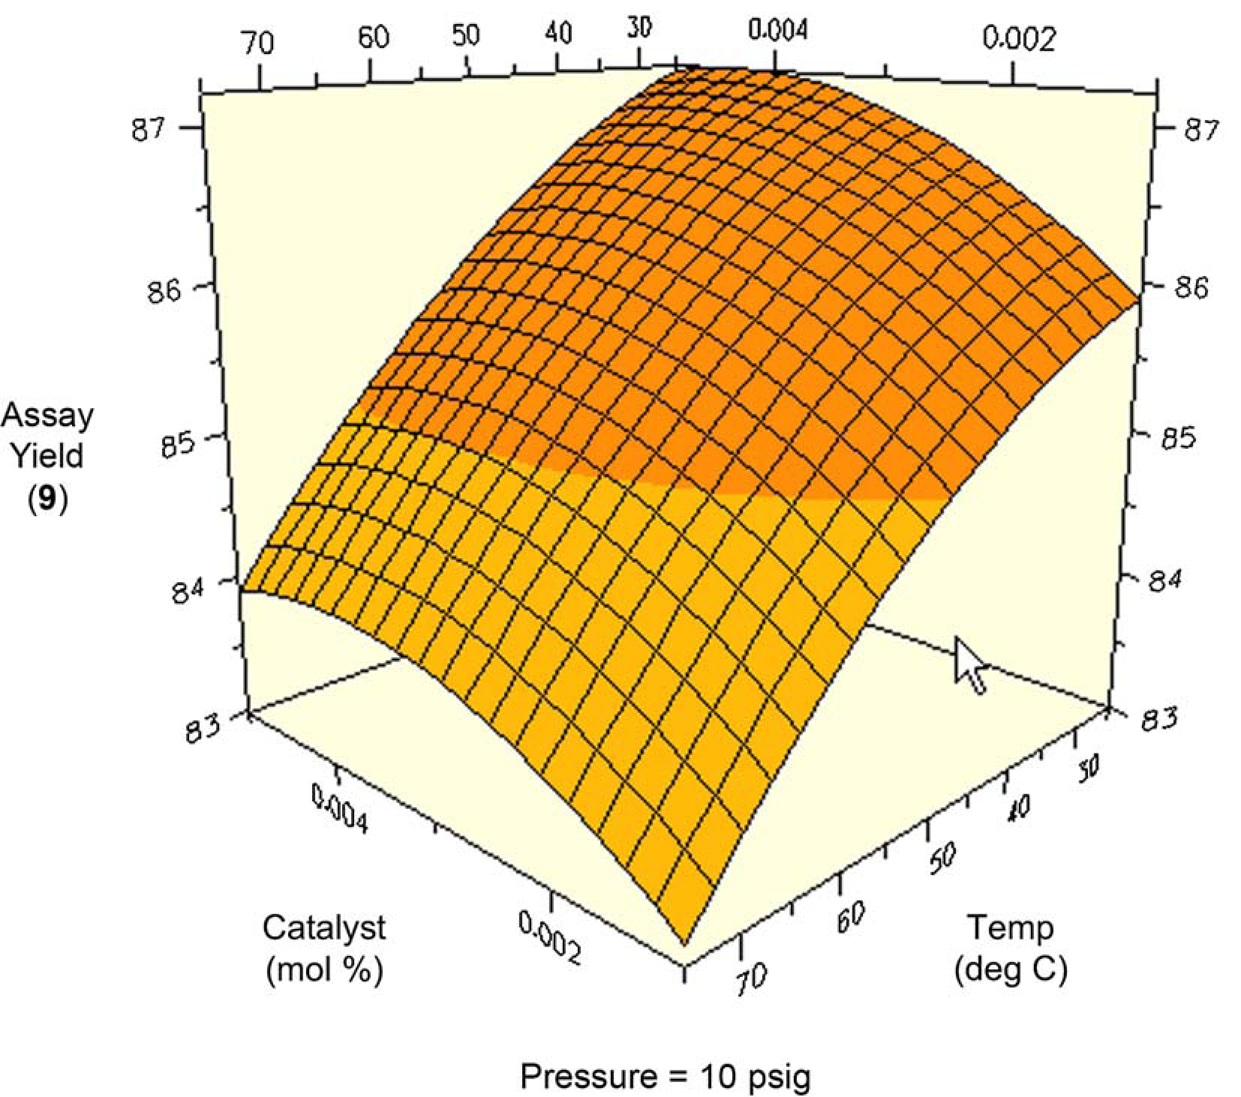
Although the F-statistic and P-factor indicate a large amount of error in the calculated model for the impurity formed in the reaction, the experiment still provides a stress test of varying conditions from which we would detect any extreme change in impurity profile. An examination of the surface plot generated at 0.5 mol% catalyst loading indicates that the formation of the impurity follows a straightforward trend (Fig. 15). The amount of impurity increases as temperature and pressure increase, and one should expect less than 2% under all conditions. Since the overall variance is very small, one would not anticipate an unexpectedly high value over a broad range of conditions. This is a considerable improvement over the reaction profiles arising from the heterogeneous catalyst reductions, which were yielding 5–10% of the impurity.
Impurity profile as a function of temperature and pressure (0.5 mol% catalyst).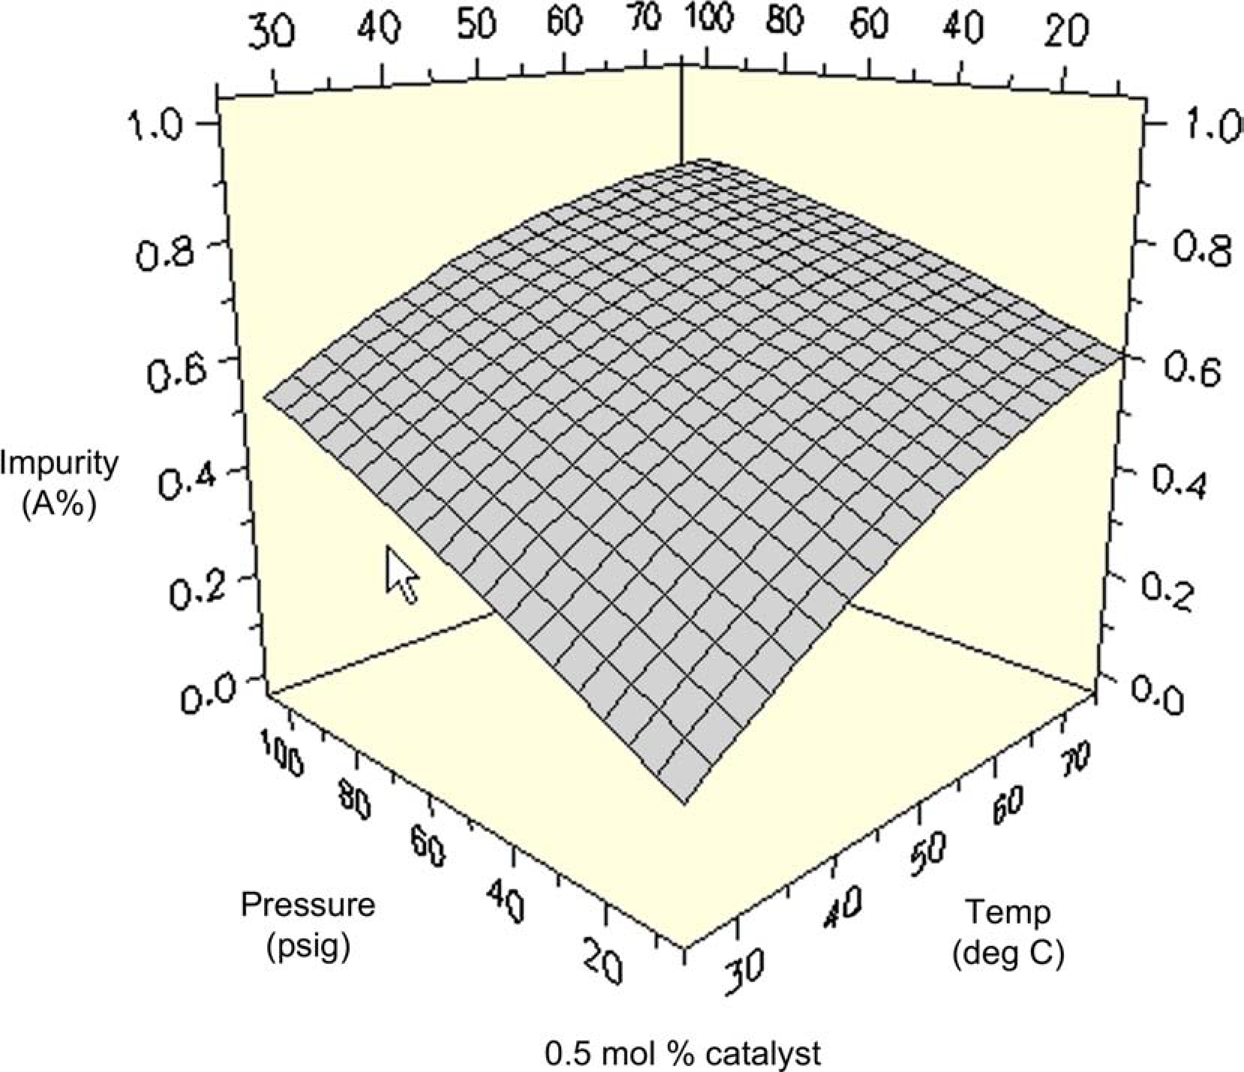
Although it is often not possible to draw definitive mechanistic conclusions about the cause of the observed effects, a single DoE experiment consisting of 18 reactions completed in a single PPR experiment can provide a large amount of empirical data to draw from. These data guide the process chemist in setting limits on the reaction parameters depending on the key issues of the processing objectives. For example, whereas conducting the chemistry at 0.1 mol% appears to be feasible, the conversion, assay yield of
The next phase of the project was to use this collection of data to decide upon the final conditions for bulk processing. Because the optimal region for all factors did not overlap for each response, one must prioritize the factors according to the project needs and objectives. In this case, the critical issue was maximizing yield while minimizing the amount of the major impurity formed. Figure 15 indicates that the amount of the major impurity would vary from 1 to 2% under all conditions examined. Because we considered this a reasonable level to accept at risk in downstream processing, the impurity response was eliminated as a decisive factor. Thus, assay yield of
Assay yield of Assay yield of Assay yield of 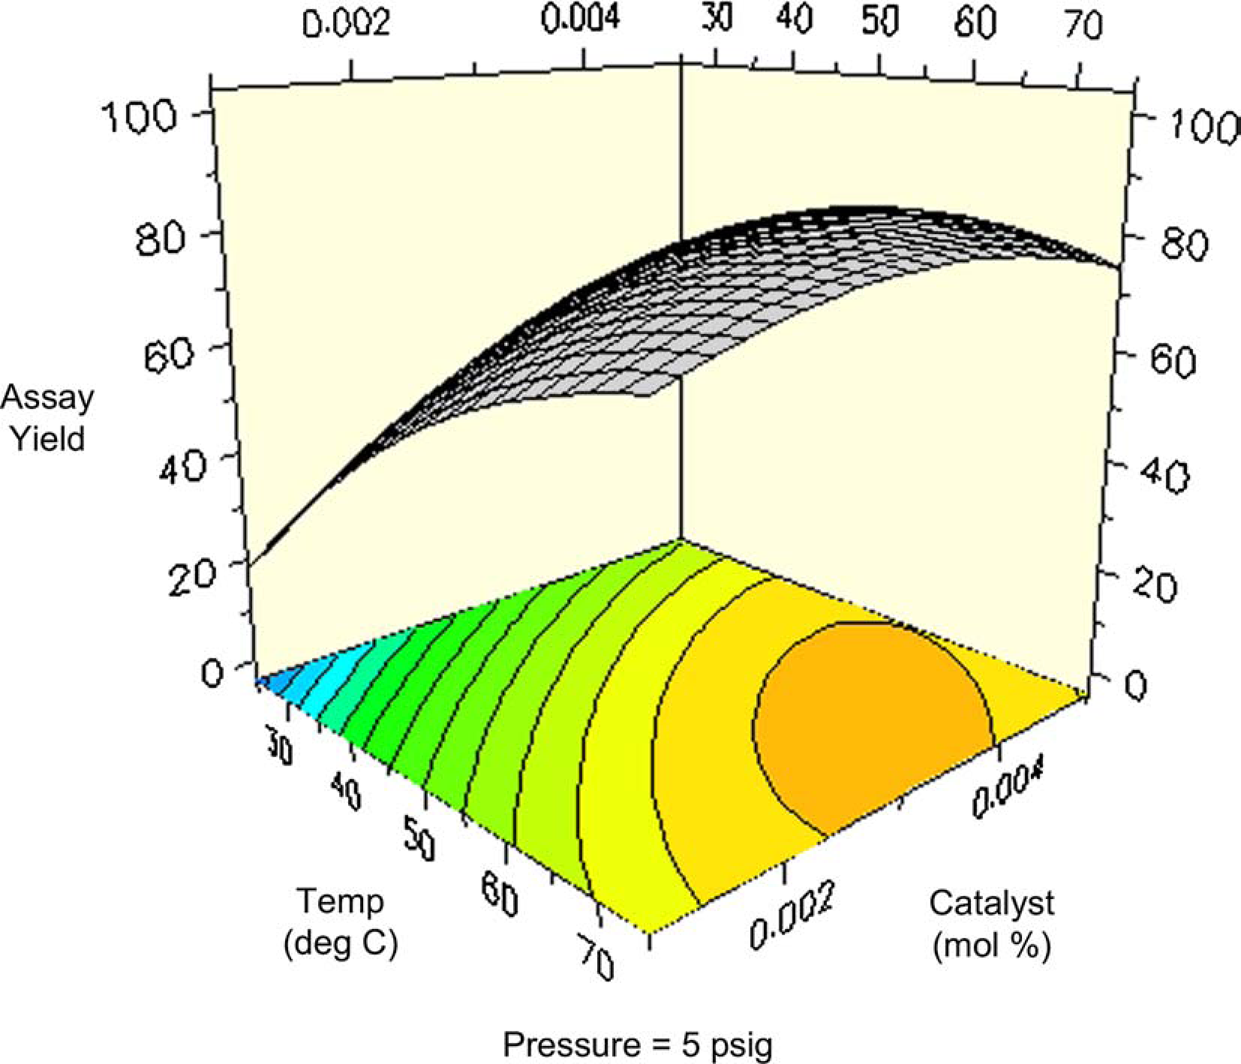
Results of GMP scale-up hydrogenation of
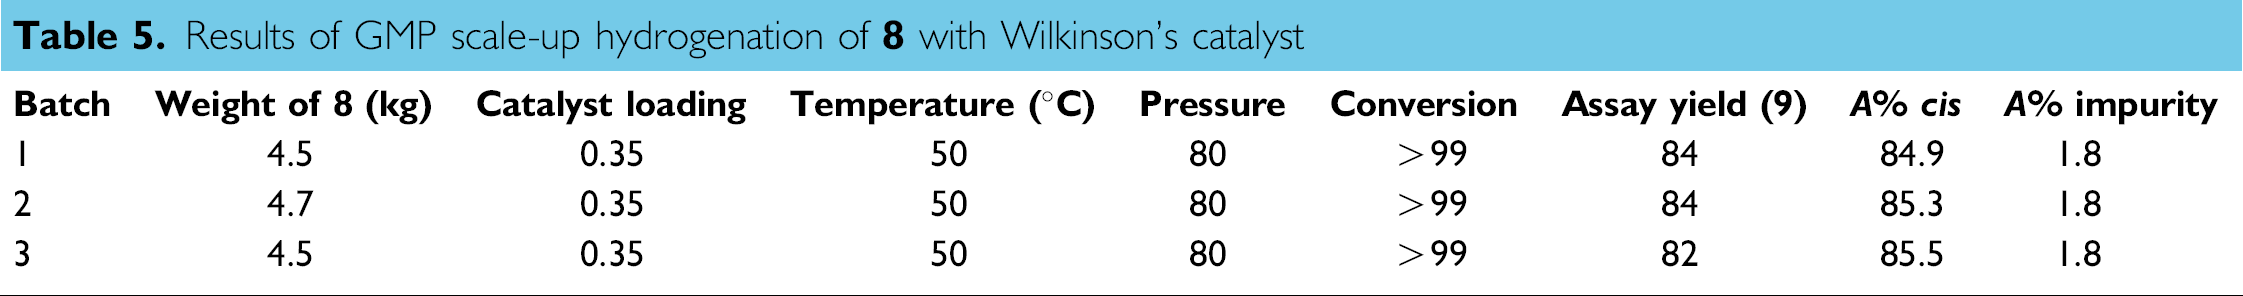
In summary, a completely new catalyst system was discovered, the optimal range of parameters identified, and the final scale-up batches completed in less than 1 month's time using the commitment of less than one full time employee. The new catalyst and optimized conditions provided consistently higher yields of desired product and lower amounts of impurities compared to the heterogeneous catalyst conditions initially prescribed for the transformation. Critical to achieving rapid implementation was the large amount of data provided from a single DoE set of experiments, which was completed as a single set of reactions within one automated instrument.
Conclusions
The three case studies described herein show the usage of automated screening equipment and application of DoE designs to accelerate the practical development of scalable metal-catalyzed reactions in process research. In doing so we have demonstrated how both phases of discovery and optimization can be accelerated. In the discovery phase, we screened and identified leads for discrete variables, such as solvents and catalysts. In the second example, the reductive cyclization of the nitrostyrene, we demonstrated the use of the PPR as a means of both screening for discrete solvents and catalysts, while simultaneously gathering additional information about relative reactivity without the need for additional experimentation. In the first and third examples, we demonstrated the coordination of DoE with automation to optimize and stress test the key variables in a highly efficient manner. In these examples, we found that one to two sets of DoE studies conducted within the PPR were sufficient to provide all the information necessary to proceed from identification of lead catalysts and solvents to implementation of reliable, predictable, and scaleable processes. In contrast to typical applications of automation-assisted DoE, these studies highlight the successful application in the early phases of process research development and implementation.