
Abstract
The social investment theory (SIT) proposes that personality maturation is triggered by transitions into age–graded roles and psychological commitment to these roles. The present study examines the predictions of SIT by focusing on the transition from student life to working life. We analysed three–wave longitudinal data and compared participants who made the transition into working life (N = 226), participants who combined education with work (N = 387), and participants who did not make the transition at all (N = 287). In contrast to the predictions of SIT, we found no differences in personality maturation between individuals who made the transition into working life and those who did this only partly or not at all. Psychological commitment to work did not explain individual differences in personality maturation for those who made the transition (partly) into working life after controlling for multiple testing. Therefore, the present study did not support the predictions of SIT. © 2019 The Authors European Journal of Personality published by John Wiley & Sons Ltd on behalf of European Association of Personality Psychology
Introduction
Finishing education and moving into working life is considered a key transition in the process of reaching adulthood. However, this transition is challenging, as 40% of the European graduates reported having problems entering into the labour market (Eurostat, 2012). The transition from student life to working life tends to happen in a life phase in which clear personality maturation is observed: individuals tend to become more agreeable, emotional stable, and conscientious (Bleidorn et al., 2013; Caspi, Roberts, & Shiner, 2005; Lodi–Smith & Roberts, 2007; Roberts, Walton, & Viechtbauer, 2006). The social investment theory (SIT) explains why most people show these personality changes in this period of life by suggesting that the transition into age–graded social roles, combined with a psychological commitment to these roles, is crucial for personality maturation (Roberts, Wood, & Smith, 2005). In the current study, we aimed to examine the predictions of SIT and in particular the associations of psychological commitment with personality maturation during the transition into working life.
Personality traits and social investment
Getting a first job after graduation usually comes with new behavioural demands, such as organizing daily life in a more structured way, getting up early on a regular basis, interacting in a professional way with colleagues, and carrying the responsibilities belonging to the job. Individuals who are psychologically committed to the job are more likely to live up to these new behavioural demands (Roberts et al., 2005). The experiences during the adaptation to these new demands form a new reward structure that could (re)shape personality traits related to these behaviours, such as conscientiousness, agreeableness, and emotional stability (Lodi–Smith & Roberts, 2007). For example, when taking up a job, individuals might experience that they need to work in an organized way to fulfil the job's targets. If they are psychologically committed to their job, they are likely to invest the necessary resources to become more organized. Positive reactions to this new behaviour could then stimulate them to internalize this behaviour, which could in turn lead to the development of a more conscientious personality (Hennecke, Bleidorn, Denissen, & Wood, 2014).
Transitions into age–graded social roles of adult life have been shown to exert some effects on personality maturation. For example, Bleidorn et al. (2013) found support for the predictions of SIT in a cross–cultural study that systematically investigated life transitions. Specifically, cultures with an earlier transition to adult social roles were marked by earlier personality maturation. For the specific transition from student life to working life, Specht, Egloff, and Schmukle (2011) found that individuals who started their first job became more conscientious compared with individuals who did not. Denissen, Luhmann, Chung, and Bleidorn (2018) provided evidence that individuals anticipating the transition into paid employment became more conscientious and open to experiences and, after the transition, they became more emotionally stable. However, the results of the studies mentioned earlier showed mixed evidence for the predictions of SIT, as transitions to adult social roles have only been shown to predict maturation of some personality traits. In addition, studies examining another life transition that is relevant to SIT, the transition into parenthood, suggested that personality maturation was unrelated to the transition into parenthood (van Scheppingen et al., 2016) or even predicted decreases in conscientiousness (Denissen, Bleidorn, et al., 2018).
Although most studies examining SIT have mainly focused on the main effects of life transitions on personality maturation, SIT also specified that the transition to an age–graded social role needs to be accompanied by psychological commitment to these roles to trigger personality development (Lodi–Smith & Roberts, 2007; Roberts & Robins, 2004). Until now, however, studies on SIT have tended to overlook the role of psychological commitment.
Psychological commitment is rooted in the process of identity formation. In his foundational work, Erikson (1950) described identity as the conscious sense of self that develops through social interactions during different developmental phases in life but especially during adolescence and young adulthood. One frequently used contemporary model of identity formation has been introduced by Crocetti, Rubini, and Meeus (2008). The three dimensions of this model are commitment, reconsideration, and in–depth exploration. Within this model, commitment refers to the process in which an individual psychologically invests in a life domain, as being committed into that life domain is giving confidence and guidance for future directions. Reconsideration refers to a process in which individuals reevaluate their current commitment and compare them with alternatives. The third dimension, in–depth exploration, refers to a process in which an individual reflects and gathers more information on their current commitments (Crocetti et al., 2008; Meeus, 1996). In–depth exploration is defined as evaluating the merits of one's current commitments and could therefore either strengthen or weaken these commitments (Crocetti et al., 2008; Meeus, 1996). Overall, the model assumes that existing identities are maintained through in–depth exploration of current commitments and that existing identities are revised by abandoning commitments and evaluating alternatives. In the current study, we were only interested in commitment because of this variable's central place in SIT. Therefore, we only examined the associations of commitment and the process potentially undermining commitment (i.e. reconsideration).
Linking psychological commitment to personality maturation
A number of longitudinal studies have examined the interplay between personality maturation and commitment. The results showed that relative changes in commitment (i.e. changes in the rank ordering of individuals on the commitment dimensions) were associated with relative changes in personality dimensions (Hatano, Sugimura, & Klimstra, 2017; Klimstra, Luyckx, Germeijs, Meeus, & Goossens, 2012; Luyckx, Soenens, & Goossens, 2006; Luyckx, Teppers, Klimstra, & Rassart, 2014). Thus, individuals who moved in the rank order on commitment also moved in the rank order of personality dimensions. However, the aforementioned studies on commitment and personality development did not cover transition to age–graded social roles. Such a transition was studied by Klimstra et al. (2013), who demonstrated in a sample of female college students that commitment to romantic relationships was a positive predictor of conscientiousness. In another community sample of late adolescent boys and girls, they further demonstrated that this type of commitment was a significant positive predictor of agreeableness. Two related studies that focused on the vocational domain found similar results as Klimstra et al. (2013), demonstrating in a sample of working individuals that changes in work commitment predicted changes in agreeableness and conscientiousness (Hudson & Roberts, 2016; Hudson, Roberts, & Lodi–Smith, 2012).
Some limitations of past research should be acknowledged, however. For example, some of these studies did not measure identity commitments directly (i.e. psychological commitment) but used indirect measures that focused on behavioural correlates of commitment (e.g. high job involvement, organizational citizenship behaviour, and counterproductive behaviours at work). Moreover, the studies by Hudson and colleagues were highly heterogeneous in age (ranging from 18 to 101 years old), so they were not able to zoom in on the role of commitment during the transition into working life. Some of the studies that examined the interplay between personality maturation and commitment have also focused on rather global identity dimensions (e.g. general sense of sameness and future orientation). This makes it unclear whether the reported associations between identity commitments and personality dimensions are actually triggered by commitment development in the vocational domain or another life domain, as previous research demonstrated a low degree of convergence across identity domains (Crocetti et al., 2008; Fadjukoff, Pulkkinen, & Kokko, 2005; Goossens, 2001; Kroger, 2002, 2007; Luyckx, Goossens, & Soenens, 2006). In order to attain greater insight into the predictions of SIT and the mechanisms by which individuals differ in personality maturation, it is therefore important to conduct studies that cover a life transition into adult social roles and to include psychological commitment to the domain in which the transition takes place.
The current study
The current study provided a first longitudinal examination of SIT during the transition from student life to working life that also accounted for psychological commitment to work. First, we examined whether personality maturation differs between individuals who fully made the transition into working life, compared with individuals who did this partly (i.e. they combine a job with education) and those who did not make this transition at all. We hypothesized that making the full transition into working life would lead to greater personality maturation compared with the group who did this partly or not at all. Second, we tested the associations of psychological commitments with personality maturation during the transition from student life to working life. In line with previous work, we expected that greater psychological commitment would be associated with more personality maturation (i.e. changes in the rank ordering of individuals on the personality dimensions). The hypotheses in this paper were not preregistered.
Method
Participants
Data for the current study were collected as part of the longitudinal research project Conflict and Management of Relationships (Meeus, 2016). Participants were students from 12 participating high schools located in the province of Utrecht, the Netherlands. For the current study, data collected in 2004, 2005, and 2010 were used. In the context of this study, these measurement occasions will be named Time 1, Time 2, and Time 3, respectively. The data used in the current study were collected in two cohorts (i.e. Cohort 1 and Cohort 2). The mean age in Cohort 1 was 16.34 (SD 0.517) at Time 1 and 46.1% were men. The mean age in Cohort 2 was 20.59 (SD 0.811) at Time 1 and 41.3% were men. We examined differences between the cohorts and reported on these in the Supporting Information. As there were cohort differences, we included cohort as a covariate in our analyses. Measures tapping into the Big Five personality traits, vocational identity, and life transitions were included in all waves. The data for this study are available upon request.
Participants were classified into a transition group, a semi–transition group, or a non–transition group. Only participants who could be unambiguously assigned to one of the transition groups and who completed the data on personality traits and vocational identity on at least two out of three waves were included in the analysis (N = 900), excluding 442 participants from the total sample.
Assignment to the different transition groups was based on information from three data sources. First, we used a number of questions from the life history calendar (LHC;(Caspi et al., 1996) to assess life transitions. Previous research has shown that the LHC is valid and reliable (Caspi et al., 1996; Larsen & Berenbaum, 2014). Second, we used an additional question on participants’ attendance in educational programmes at Time 3 to make sure that participants who would be assigned to the transition group based on the LHC were not combing work with education. Third, we used participants’ completed work identity assessment at Time 3. To form our three transition groups, the information from these three sources was combined in the following way.
The transition group (N = 226) consisted of participants who reported (on the LHC) to attend a full–time education programme at Time 1 and Time 2 and to work at Time 3, reported not to attend an educational programme at Time 3, and filled out the questionnaire on work identity at Time 3. The semi–transition group (N = 387) consisted of participants who reported (on the LHC and the additional question) to attend a full–time education programme at Time 1 and Time 2 and reported to combine work and school at Time 3 and who filled out the questionnaire on work identity at Time 3. The non–transition group (N = 287) consisted of participants who reported (on the LHC and the additional question) to attend an educational programme at Time 1, Time 2, and Time 3 and did not fill out the questionnaire about work identity at Time 3. The sampling procedure in this paper was not preregistered. More information on the sampling procedure is provided in the Supporting Information.
In the transition group, the mean age was 17.9 years (SD = 2.2) at Time 1, 42% originated from Cohort 1, and 40.7% were men. In the semi–transition group, the mean age was 16.1 years (SD = 1.7) at Time 1, 81.2% originated from Cohort 1, and 46.7% were men. In the non–transition group, the mean age was 16.0 years (SD = 1.6) at Time 1, 84.5% originated from Cohort 1, and 45.4% were men. We selected cohort, age, sex, ethnicity, religion, and the education level of the participant, their fathers, and their mothers as possible confounding variables. Preliminary analyses (provided in the Supporting Information) showed that there were significant differences between the transition groups when considering cohort, age, education level of the participant, and education level of the participant's father and mother. Therefore, we included these variables into the analysis as covariates.
Table 1 shows the type of highest completed education of the transition group and the type of attended education at Time 3 of the semi–transition group and the non–transition group. Preliminary analyses showed significant education level differences between the groups (χ2 = 150.880, df = 8, p < .001). Standardized residuals indicated a pattern in which higher levels of education were overrepresented in the non–transition group and lower levels of education were overrepresented in the transition group.
Highest level of education at Time 3
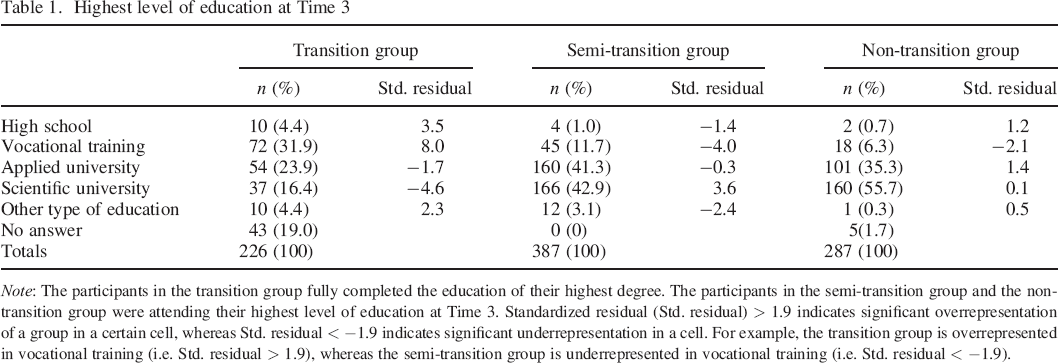
Note: The participants in the transition group fully completed the education of their highest degree. The participants in the semi–transition group and the non–transition group were attending their highest level of education at Time 3. Standardized residual (Std. residual) > 1.9 indicates significant overrepresentation of a group in a certain cell, whereas Std. residual < −1.9 indicates significant underrepresentation in a cell. For example, the transition group is overrepresented in vocational training (i.e. Std. residual > 1.9), whereas the semi–transition group is underrepresented in vocational training (i.e. Std. residual < −1.9).
For the included participants, 8% of the data were missing. Little's (1988) missing completely at random test was used to compare the participants with and without missing data. The missing completely at random test was significant (χ2 = 634.713, df = 443, p < .001), but the χ2/df ratio was 1.43, which suggested a good fit between data of those with and without missing data (Bollen, 1989). Therefore, data were likely missing at random.
Procedure
Twenty randomly selected schools in the province of Utrecht, the Netherlands, were approached for the recruitment of participants. Twelve of these schools (60%) decided to participate. Students and their parents received an invitation letter explaining the research project and goals. Participants were informed that they could refuse or discontinue participation at any time. Confidentiality of responses was guaranteed. Participants and their parents signed a standard informed consent before participating. More than 99% of the approached students decided to participate. The questionnaires were completed at the participants’ schools or homes. Verbal and written instructions were offered. The participants received €10 for every wave they participated in.
Measures
Personality
Personality was measured with a shortened Dutch version of Goldberg's Big Five questionnaire (Gerris et al., 1998; Goldberg, 1992). This instrument assesses the Big Five personality dimensions of extraversion, agreeableness, conscientiousness, emotional stability, and openness to experience. The dimensions were measured with six items each, such as ‘talkative’ (extraversion), ‘sympathetic’ (agreeableness), ‘systematic’ (conscientiousness), ‘worried’ (emotional stability, reverse scored), and ‘creative’ (openness). Participants indicated the degree to which the adjectives described their personality. They completed the 30 items of this instrument using a 7–point Likert scale, with a response ranging from 1 (completely untrue) to 7 (completely true). Previous research has shown that this instrument provides reliable and valid Big Five personality data on adolescents (Branje, van Lieshout, & van Aken, 2004). In the current study, Cronbach's alphas across all personality dimensions and measurement waves ranged from .77 to .91 and were thus good to excellent.
Identity
Work commitment was measured at Time 3 in the transition group and the semi–transition group with the commitment and reconsideration scale of the Utrecht–Management of Identity Commitments Scale by Crocetti et al. (2008). This instrument assesses commitment with five items and reconsideration with three items. Each item is answered with a 5–point Likert scale, with response options ranging from 1 (completely untrue) to 5 (completely true). Sample items are ‘my work gives me certainty in life’ (commitment) and ‘I often think it would be better to try and find different work’ (reconsideration). Previous research has shown that this instrument is valid and reliable to assess work commitment in adolescents (Crocetti et al., 2008). In the current study, internal consistency was excellent for Utrecht–Management of Identity Commitments Scale work (Cronbach's alphas ranged from .90 to .91).
Strategy of analysis
First, the shape of growth trajectory was investigated for all personality dimensions based on the entire sample and for each group separately without controlling for covariates. For this purpose, we used univariate latent growth curve modelling(LGCM; Duncan, Duncan, Stryker, Li, & Alpert, 1999) in Mplus 7 (Muthén & Muthén, 2012). The slope loadings were 0 for Time 1, 1 for Time 2, and 6 for Time 3 (i.e. Time 1 and Time 2 were one year apart, and Time 2 and Time 3 were five years apart). Robust maximum likelihood estimation was used because preliminary analyses revealed that the distribution of some of the scale scores was skewed or heavy tailed (i.e. kurtosis). Model fit was evaluated by assessing root–mean–square errors of approximation (RMSEAs), standardized root–mean–square residuals (SRMRs), comparative fit indices (CFIs), and Tucker–Lewis indices (TLIs). RMSEAs and SRMRs smaller than 0.08 and CFIs and TLIs larger than 0.90 indicate an acceptable model fit (Hu & Bentler, 1999). The fit indices of these models were compared with a perfect model fit (i.e. χ2 = 0, CFI = 1.000, and RMSEA = 0.000). Fulfilment of two out of the three following conditions would indicate that a linear growth trajectory does not provide an optimal fit: χ2 is significantly >0, ∆CFI > 0.010, and ∆RMSEA > 0.015. In such cases, latent difference score models (LDSMs) were used to assess mean levels (i.e. intercepts) and change herein from one time point to another based on individual growth trajectories between two measurement occasions (McArdle, 2001). In order to cover all measurement occasions of this study, two models per personality dimension were necessary in that case (i.e. a model for change between Time 1 and Time 2 and a model between Time 2 and Time 3). The combination of these two models allowed for capturing a non–linear growth trajectory (e.g. the slope between Time 1 and Time 2 can be steeper than the slope between Time 2 and Time 3 or even be in a different direction). Model fit was evaluated by assessing RMSEAs, SRMRs, CFIs, and TLIs. RMSEAs and SRMRs smaller than 0.08 and CFIs and TLIs larger than 0.90 indicate an acceptable model fit (Hu & Bentler, 1999). Table 2 provides means for all personality dimensions for the entire sample and for each group. Table 3 provides correlations between personality dimensions and identity dimensions.
Descriptive statistics of personality dimensions on T1, T2, and T3
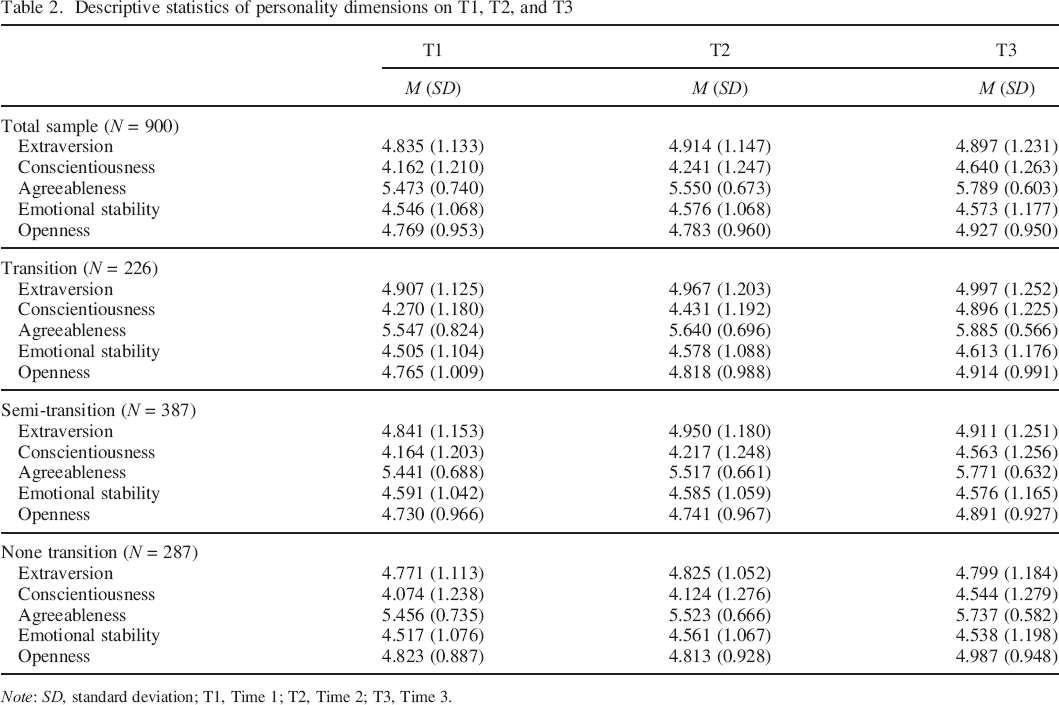
Note: SD, standard deviation; T1, Time 1; T2, Time 2; T3, Time 3.
Correlations of personality dimensions and commitment dimensions
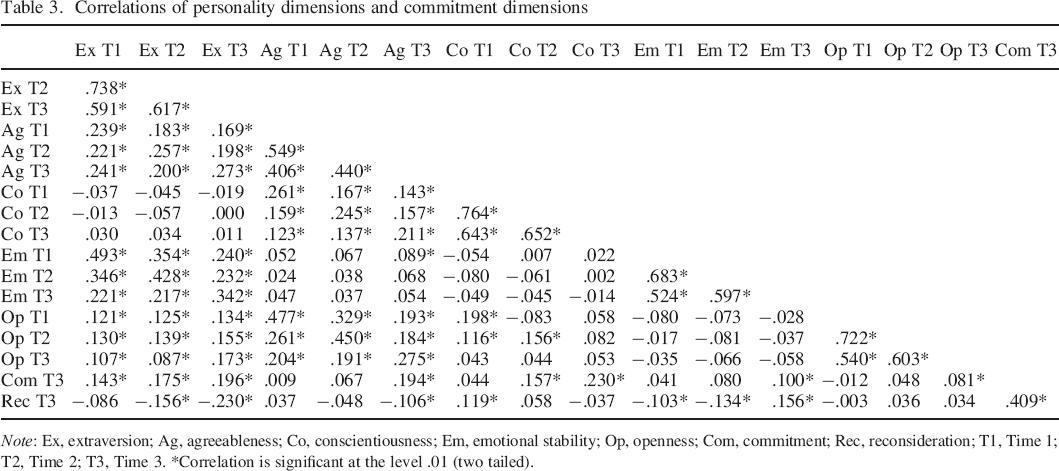
Note: Ex, extraversion; Ag, agreeableness; Co, conscientiousness; Em, emotional stability; Op, openness; Com, commitment; Rec, reconsideration; T1, Time 1; T2, Time 2; T3, Time 3.
Correlation is significant at the level .01 (two tailed).
For those personality dimensions for which change took a linear shape, we ran unconstrained multigroup latent growth curve modelling (MLGCM; Duncan et al., 1999) in Mplus 7 (Muthén & Muthén, 2012) to examine differences of personality mean–level changes between the three groups (i.e. non–transition group, semi–transition group, and transition group). These models were controlled for covariates (cohort, age, level of education, and education of parents). To test whether there were significant differences between the three groups, we ran models in which the intercepts and slopes were constrained to be equal for all groups as a second step. These models were again estimated separately for all personality dimensions. These constrained models were compared with the unconstrained models using scaled chi–square model comparisons (Satorra & Bentler, 2001), and ∆CFI is >0.010 and ∆RMSEA > 0.015. If the constrained models did not have a poorer fit than the unconstrained models, this would suggest that the personality growth trajectories and the initial level of a personality dimension did not differ between the groups. Figure 1 shows an example of a constrained MLGCM for conscientiousness.
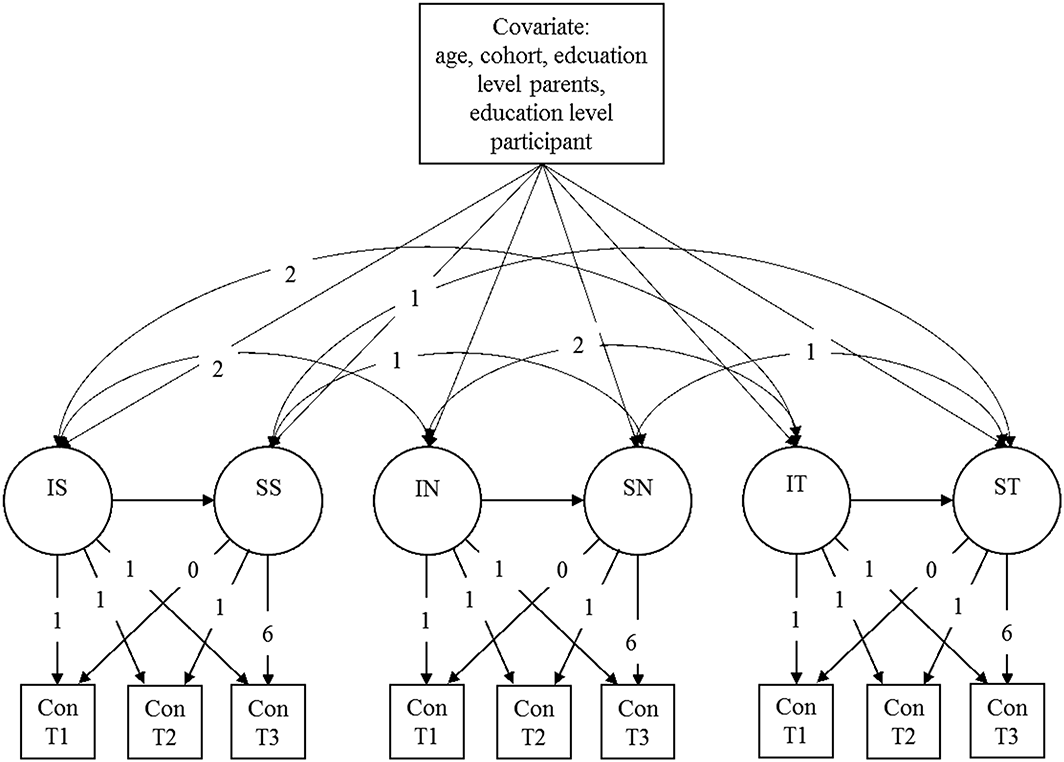
Constrained multigroup latent growth curve model for conscientiousness (Con T1–Con T3). IS is intercept for the semi–transition group, SS is slope for the semi–transition group, IN is intercept for the non–transition group, SN is slope for the non–transition group, IT is intercept for the transition group, ST is slope for the transition group. The intercepts and the slopes of the different transitions groups are constrained to be equal. Model is corrected for cohort, age, education level participant, and education level parents.
To estimate associations for work commitment and work reconsideration with the personality growth trajectories, we first used LGCMs to assess whether the slope variance was significantly different from zero (i.e. test whether there were significant individual differences in personality change). The transition and semi–transition groups will be combined if the results of the first research question reveal that there are no differences between these groups. We predicted the personality slope with work commitment at Time 3 in a first series of LGCMs. In a second series of these models, we used work reconsideration at Time 3 as a predictor.
Results
Our first main goal was to investigate whether personality mean–level change differs between individuals who have made the transition into working life compared with individuals who did this only partly (i.e. semi–transition group) and those who did not made the transition into working life at all. We started by determining the shape of the growth trajectory of the personality dimensions based on the entire sample by examining the fit indices for the LGCMs. Table 4 summarizes these model fit indices. This was also done for each transition group, separately. These results are provided in the Supporting Information. These models suggested that change for all personality dimensions was approximately linear, except for extraversion. Therefore, the dimension of extraversion was further analysed with LDSMs. Table 5 shows the growth parameters of LGCMs and LDSMs based on the entire sample. In these models, we did not adjust for cohort, age, education level of the participant, and education level of the participant's parents.
Fit indices for latent growth curve models (N = 900)
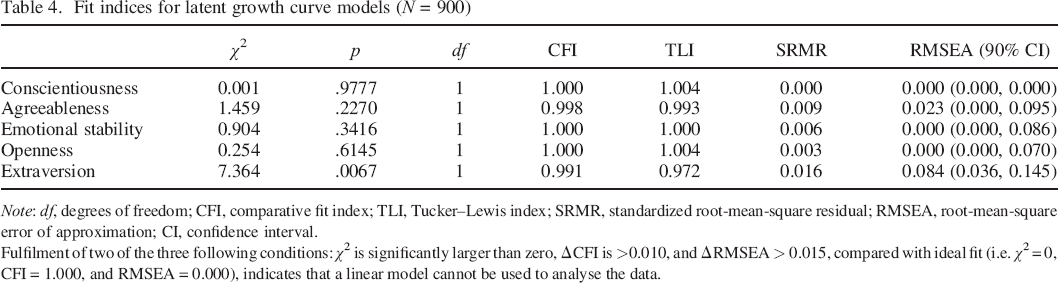
Note: df, degrees of freedom; CFI, comparative fit index; TLI, Tucker–Lewis index; SRMR, standardized root–mean–square residual; RMSEA, root–mean–square error of approximation; CI, confidence interval.
Fulfilment of two of the three following conditions: χ2 is significantly larger than zero, ∆CFI is >0.010, and ∆RMSEA > 0.015, compared with ideal fit (i.e. χ2 = 0, CFI = 1.000, and RMSEA = 0.000), indicates that a linear model cannot be used to analyse the data.
Growth parameters for latent growth curve models and latent difference score models (N = 900)
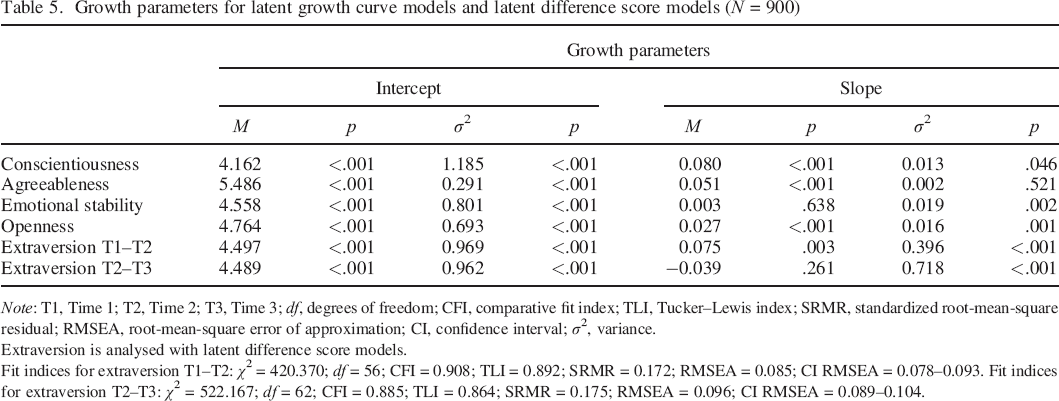
Note: T1, Time 1; T2, Time 2; T3, Time 3; df, degrees of freedom; CFI, comparative fit index; TLI, Tucker–Lewis index; SRMR, standardized root–mean–square residual; RMSEA, root–mean–square error of approximation; CI, confidence interval; σ2, variance.
Extraversion is analysed with latent difference score models.
Fit indices for extraversion T1–T2: χ2 = 420.370; df = 56; CFI = 0.908; TLI = 0.892; SRMR = 0.172; RMSEA = 0.085; CI RMSEA = 0.078–0.093. Fit indices for extraversion T2–T3: χ2 = 522.167; df = 62; CFI = 0.885; TLI = 0.864; SRMR = 0.175; RMSEA = 0.096; CI RMSEA = 0.089–0.104.
Second, the fit indices from the constrained and unconstrained models were compared with each other to estimate whether there were differences between the three transition groups. Table 6 shows the fit indices for the constrained and unconstrained MLGCMs and multigroup latent difference score models (MLDSMs). In these models, we corrected for cohort, age, and education level of the participants and their parents. The fit indices generally suggested that there were no significant group differences, as the differences in the fit of constrained and unconstrained models were small (ΔCFI was smaller than 0.010 for all personality dimensions, and ΔRMSEA was smaller than 0.015 for all personality dimensions). Table 7 shows the results of the chi–square difference tests. These tests indicated group differences for extraversion between Time 2 and Time 3. However, ΔCFI was <0.010 and ΔRMSEA was <0.015, indicating no group difference for extraversion between Time 2 and Time 3. Therefore, we concluded that there were no notable differences between the three different transition groups.
Fit indices for multigroup latent growth curve models and multigroup latent difference score models (N = 900)
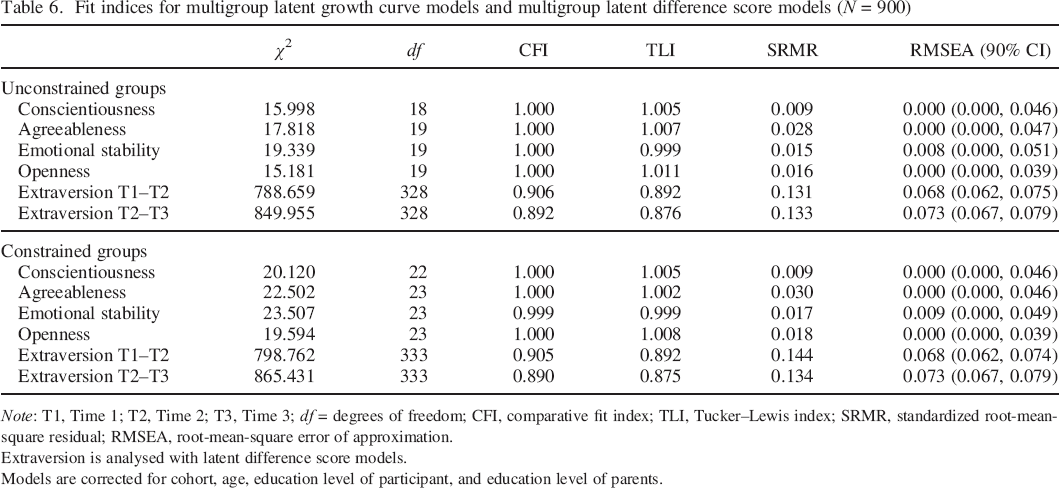
Note: T1, Time 1; T2, Time 2; T3, Time 3; df = degrees of freedom; CFI, comparative fit index; TLI, Tucker–Lewis index; SRMR, standardized root–mean–square residual; RMSEA, root–mean–square error of approximation.
Extraversion is analysed with latent difference score models.
Models are corrected for cohort, age, education level of participant, and education level of parents.
Scaled chi–square difference tests
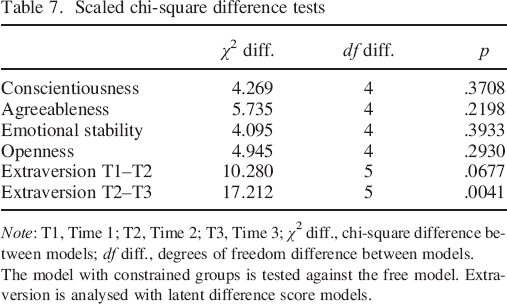
Note: T1, Time 1; T2, Time 2; T3, Time 3; χ2 diff., chi–square difference between models; df diff., degrees of freedom difference between models.
The model with constrained groups is tested against the free model. Extraversion is analysed with latent difference score models.
Table 8 shows the growth parameters for the constrained MLGCM and MLDSM. The results indicated that participants in all groups became more agreeable and extraverted after controlling for cohort, age, participants’ education level, and parents’ education level. To avoid modelling issues, the slope variance of agreeableness and emotional stability had to be fixed at 0.001. Therefore, the p–value could not be estimated. The growth parameters for the unconstrained MLGCM and MLDSM are provided in the Supporting Information.
Growth parameters for constrained multigroup latent growth curve models and multigroup latent difference score models (N = 900)
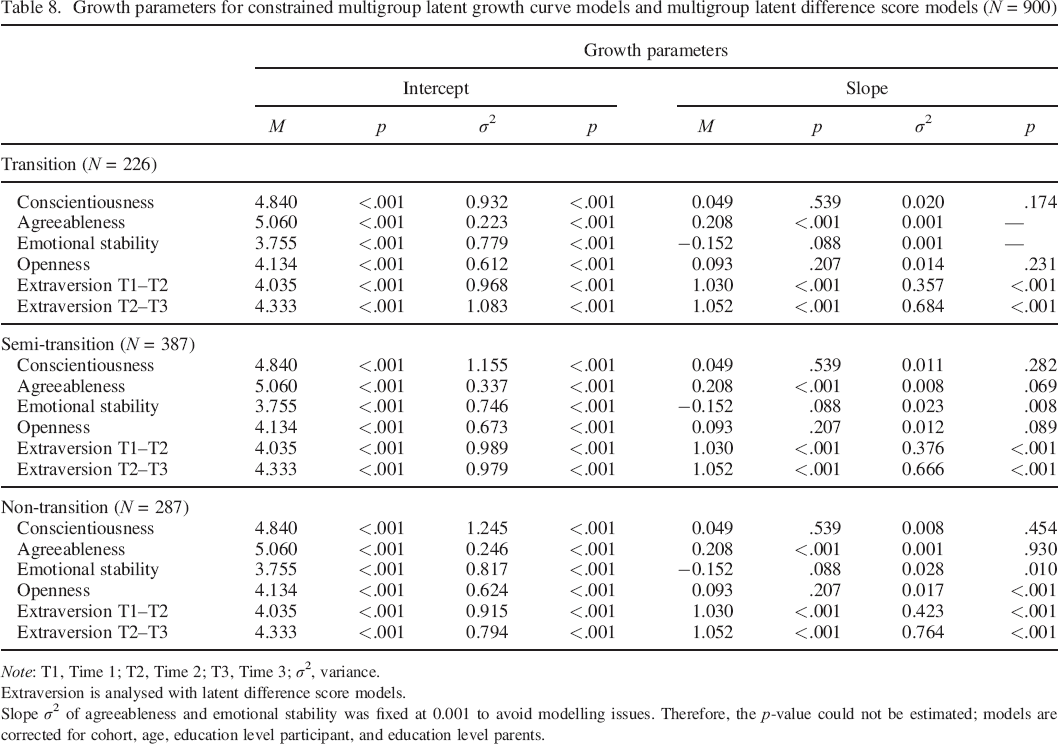
Note: T1, Time 1; T2, Time 2; T3, Time 3; σ2, variance.
Extraversion is analysed with latent difference score models.
Slope σ2 of agreeableness and emotional stability was fixed at 0.001 to avoid modelling issues. Therefore, the p–value could not be estimated; models are corrected for cohort, age, education level participant, and education level parents.
The second goal of the paper was to investigate whether work commitment and/or work reconsideration were associated with personality maturation after (partly) making the transition into working life. For these analyses, we combined the transition and semi–transition groups, as the results of the first research question revealed no differences between these groups. In these analyses, we controlled for cohort, age, participants’ education level, and parents’ education level differences. Extraversion was again analysed with LDSMs. The fit indices and the growth parameters for all models in which the transition and semi–transition groups are combined are provided in the Supporting Information. The slope variance estimate of agreeableness initially was negative and had to be fixed at 0.001 to avoid modelling issues. Therefore, its p–value could not be estimated. The LGCMs and LDSMs revealed that there was only significant slope variance for extraversion (extraversion T1–T2: σ2 = 0.379, p < .001; and extraversion T2–T3: σ2 = 0.691, p < .001) and openness (σ2 = 0.014, p = .023). Therefore, we only analysed the role of psychological commitment in these two dimensions with LGCMs of LDSMs. Each model included one Big Five personality dimension (i.e. extraversion or openness) and one identity dimension (i.e. commitment or reconsideration).
Table 9 shows the fit indices and the regression paths indicating the effects of the identity dimensions on the personality dimensions. These results indicate that individuals who made the transition into working life showed larger increases in openness if they were more committed to their work. They also showed larger decreases in extraversion between Time 2 and Time 3 if they were having more doubts about their work. However, after correcting for possible Type I errors due to multiple testing (a p–value of .008 was used, i.e. 0.05 divided by six hypotheses), these effects were no longer significant. The Mplus output files of these analyses are provided in the Supporting Information.
Fit indices and standardized effects of models in which psychological commitment was used to predict personality slopes
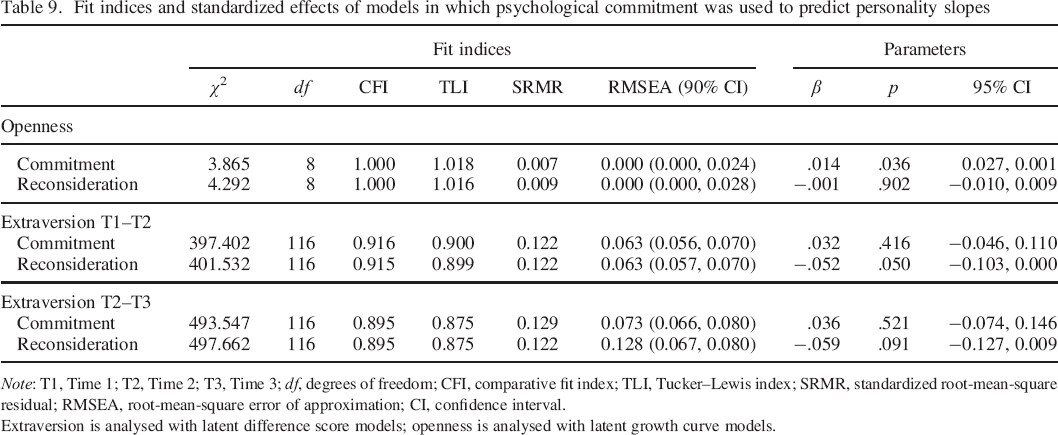
Note: T1, Time 1; T2, Time 2; T3, Time 3; df, degrees of freedom; CFI, comparative fit index; TLI, Tucker–Lewis index; SRMR, standardized root–mean–square residual; RMSEA, root–mean–square error of approximation; CI, confidence interval.
Extraversion is analysed with latent difference score models; openness is analysed with latent growth curve models.
Discussion
The current study is among the first to provide a longitudinal examination of the predictions of SIT regarding the transition from student life to working life and the associations between personality growth and psychological commitment herein. We found no differences in personality maturation between individuals who made the transition into working life compared with individuals who did this partly or not at all. Psychological commitment to work did not explain individual differences in personality maturation for those who made the (partial) transition into working life after controlling for multiple testing. Therefore, the present study did not find support for the predictions of SIT. We will discuss implementations for SIT.
Personality maturation and the role of the transition
For the first main goal of the study, we investigated whether personality developed differently in individuals who made the transition into working life compared with individuals who did not, or only partly, make this transition. We did not find significant differences between these three groups. Therefore, our findings did not support the assumption of SIT that transitioning into an age–graded social role affects developmental trajectories of personality (Roberts et al., 2005). This is not comparable with results by Specht et al. (2011) and Denissen, Luhmann, et al. (2018), who demonstrated that individuals became more conscientious and emotionally stable after starting their first job compared with individuals who did not start working. However, both studies demonstrated differences in personality development only in one personality trait and could not replicate the results of each other. In addition, they only focused on main effects of transitions while ignoring the role of commitment, which is a central variable in SIT. This is why the second goal of the study focused on this variable.
Associations of psychological commitment with personality maturation
For the second goal of the study, we found that individuals who made the transition into working life became more open if they were more committed to their work and less extraverted if they were reconsidering their work more. However, these results were no longer significant after controlling for multiple testing. Our results are therefore not in line with the predictions of SIT and two studies on the role of social investment and personality maturation in working individuals. These studies demonstrated that changes in social investment predicted changes in conscientiousness and agreeableness (Hudson et al., 2012; Hudson & Roberts, 2016). However, these studies did not directly measure psychological commitment as operationalized in identity research but focused more on indirect behavioural correlates of commitment. These previous studies also covered a larger age range as well as longer intervals between the transition into working life and subsequent personality maturation. This could have resulted in more individual differences in personality change than there were in our study, as our study suggested that individuals who just made the transition into working life mature in very similar ways. Because these individual differences were not substantial in our study, there was little to be explained by psychological commitment. Generally, however, the hypothesized role of psychological commitment on top of the main effect of transitions themselves in personality maturation as proposed by SIT was not supported by our results.
Implications for social investment theory
Our findings suggest that the processes underlying personality maturation were not triggered by the transition into age–graded roles. Although the transition into working life may appear to be a very clear–cut moment in life, this transition could actually be more gradual and personality maturation might already happen in anticipation of the upcoming transition. Denissen, Luhmann, et al. (2018) provided evidence that individuals anticipating the transition into paid employment became more conscientious and open to experiences. Such anticipation effects were not observed in the current study, however.
Another explanation could be that other contextual factors, like social relationships and the accumulation of daily experiences and environments interacting with biological factors, could instead be responsible for personality maturation (Back et al., 2011; Roberts, 2018; Wrzus & Roberts, 2017). For example, according to SIT, the transition into a new age–graded social role might elicit behavioural changes, and positive feedback on this new behaviour could lead to the internalization of this behaviour, which is assumed to result in personality maturation (Lodi–Smith & Roberts, 2007). However, the amount of newly elicited behaviour might additionally depend on the explicit and implicit feedback that an employee may get from their environment and on the person–environment fit. A greater person–environment fit is associated with personality consistency, and further adaptation to the environment might become less necessary (Roberts & Robins, 2004). For example, if someone with an already extraverted personality would start working in a job that requires an extraverted personality (e.g. a sales person), their personality might not need to change a lot in order to do well in this job (Denissen, Bleidorn, et al., 2018). Because of such effects, future studies should test the received behavioural feedback and the fit between the person and their new age–graded role. On a general level, this implies that future studies on the process of personality maturation should employ more complex designs that incorporate the developmental context of participants.
Limitations
Our study had several limitations. First, normative life transitions, such as the transition from student life to working life, can be associated with emotional distress (Marcia, 2010). Resolving the emotional distress caused by the transition might be associated with personal growth (Marcia, 2010; Waterman, 2007), whereas experiencing more negative effects has been shown to predict increases in neuroticism (Borghuis et al., 2019). If the transition tasks are not yet mastered, and thus still causing emotional distress, the transition might also initially suppress personality growth (Denissen, Aken, Penke, & Wood, 2013; Hutteman, Hennecke, Orth, Reitz, & Specht, 2014). Therefore, multi–wave longitudinal data from before and after the transition into working life are needed to test for personality maturation as a result of life transitions (Luhmann, Orth, Specht, Kandler, & Lucas, 2014).
Second, a study on the predictions of SIT should focus on a life transition and include a measure of psychological commitment for the domain in which the transition takes place. The transition itself complicates the measurement of psychological commitment, however, because of shifts in the content domain to which someone can commit to (i.e. school commitment changes into work commitment for the transition into working life). Therefore, commitment cannot be assessed in the same way across the transition. This phenomenon, which is known as heterotypic continuity (Moss & Susman, 1980), forms a challenge when testing predictions on the role of psychological commitment in line with SIT. This challenge might be solved by measuring psychological commitment in a specific domain but with a more general term. For example, psychological commitment to a career path could be measured during education and in working life.
Third, we relied fully on self–reports. Identity formation concerns one's own sense of commitment and exploration and is therefore best assessed by self–reports (Erikson, 1968), but personality dimensions could also be assessed by other measures such as peer reports and parent reports. Such measures could provide a useful supplement to the instruments used in this study, as including information from more informants will increase the validity of the measures (Hofstee, 1994).
Fourth, the current study focused only on identity formation dimensions but did not examine other aspects of identity, such as how individuals make sense of the self and their experiences. Including narrative or survey–based approaches that would assess identity more comprehensively might have provided a more nuanced and complete picture on the associations of psychological commitment with personality maturation during the transition into working life (Pasupathi, 2014).
Fifth, this study only investigated personality maturation at the domain level and did not investigate lower–order personality levels. Personality maturation based on lower–order personality levels could perhaps uncover additional differences between individuals. That said, a study on the differential development of facets showed very few differences between facets belonging to the same domain (Klimstra, Noftle, Luyckx, Goossens, & Robins, 2018).
Sixth, we did not assess the characteristics (e.g. level, work field, and type of contract) of the job and/or the major of educational programmes. A mismatch between the characteristics of the educational programme and the characteristics of the job could be associated with low psychological commitment to the job, since individuals who perceived their job to be in line with their skills have been found to be more likely to have a strong work identity (Luyckx, Duriez, Klimstra, & de Witte, 2010).
A final limitation concerns the sample, which is drawn from one particular country (i.e. the Netherlands). The cultural context is relevant in personality development and identity formation, as cultural differences may determine when and if individuals go through certain life transitions (Bleidorn et al., 2013). In the Netherlands, over 60% of students combine their studies with work (OECD, 2012). These students usually hold jobs for which they are overqualified, such as working in grocery stores or bars and restaurants. These early work experiences make the transition into working life rather gradual for many Dutch students. Our results are therefore only applicable to western societies with an educational system similar to the one in the Netherlands.
Conclusion
The findings of our study provide no evidence for the predictions of the SIT because the transition to work was not associated with personality maturation. In addition, evidence for the hypothesized associations of psychological commitment with personality maturation disappeared after controlling for multiple testing. Longitudinal research on personality and identity formation with multiple measurements before and after the transition including multiple other potential contextual and individual factors may shed more light on the complex question as to why some individuals tend to show more personality maturation over time than others do.
Supporting info item
Supporting info item, per2218-sup-0001-st1-st5 - Personality Maturation during the Transition to Working Life: Associations with Commitment as A Possible Indicator of Social Investment
Supporting info item, per2218-sup-0001-st1-st5 for Personality Maturation during the Transition to Working Life: Associations with Commitment as A Possible Indicator of Social Investment by den Boer Liselotte, Klimstra Theo A., Branje Susan J.T., Meeus Wim H.J., Denissen Jaap J.A. and Mõttus René in European Journal of Personality
Supporting info item
Supporting info item, per2218-sup-0002-Open_Practices_Disclosure_Form - Personality Maturation during the Transition to Working Life: Associations with Commitment as A Possible Indicator of Social Investment
Supporting info item, per2218-sup-0002-Open_Practices_Disclosure_Form for Personality Maturation during the Transition to Working Life: Associations with Commitment as A Possible Indicator of Social Investment by den Boer Liselotte, Klimstra Theo A., Branje Susan J.T., Meeus Wim H.J., Denissen Jaap J.A. and Mõttus René in European Journal of Personality
Open Practices Disclosure
References
Supplementary Material
Please find the following supplemental material available below.
For Open Access articles published under a Creative Commons License, all supplemental material carries the same license as the article it is associated with.
For non-Open Access articles published, all supplemental material carries a non-exclusive license, and permission requests for re-use of supplemental material or any part of supplemental material shall be sent directly to the copyright owner as specified in the copyright notice associated with the article.