
Abstract
In this paper, we applied the Taguchi method to evaluate the maximum swimming speed of a robotic fish under the limitation of the output of the motor. Four factors were considered in the optimization: the caudal-fin aspect ratio, the caudal fin stiffness, the oscillating frequency and the stiffness of the spring that transmits forces from the actuators to the foil. Because of the power limitations, the parameter's space was irregular. Since the Taguchi method requires a regular parameter space, we divided the parameter space into a regular space and the remaining irregular spaces. Within only 25 trials, the frequency and the spring stiffness were determined as the main factors in the regular space by the orthogonal design. Six more trials were carried out in the remaining irregular space with a higher frequency and spring stiffness. The fastest swimming speed of 870 mm/s, approximately 2.6 BL (Body Lengths)/s, was acquired, when the frequency reached 12Hz and with infinite spring stiffness. This method is efficient for exploring the maximum locomotor capabilities of robotic fish and may also be useful for other robots as no modelling is required.
1. Introduction
After millions of years of evolution, fish are endowed with amazing locomotor capabilities in aquatic environments [1]. According to the classification and nomenclature proposed by Breder, fish swimming types are divided into two parts: body and/or caudal fin (BCF) propulsion and median and/or paired fin (MPF) movements. Most fish swim in the BCF mode to achieve a high efficiency, a high speed and to realize quick turns while cruising [2–5]. Recently, along with the development of mechanics, material, electronics and control, an increasing number of bio-inspired robotic fish have been developed and assigned to various underwater tasks [6–12].
As some tasks require excellent locomotor capabilities, it is meaningful to determine the maximum locomotor capabilities whenever a robot is developed. Analysis by modelling is especially useful for these issues. Due to the complexity of the fluid-structure interactions and the specific mechanical structures of robots, it is still challenging to develop a general hydrodynamic model to evaluate the swimming capabilities of each robot [13–15]. One solution is to find and analyse the main factors that are responsible for the considered capability. However, the locomotor capabilities may be determined by different main factors for different robotic fish [16]. Taking the swimming speed capability as an example, researchers have found a series of factors affecting the locomotor capability of each prototype, such as the frequency [17, 18], amplitude [18], elasticity [17] and stiffness of the spring that connects actuators and tail [19], and the phase difference between two links [20]. Therefore, it will be useful to develop an easy and general way to find the main factors that affect the considered locomotor's capability.
On the other hand, maximum swimming capabilities can be evaluated by evolutionary algorithms and considering all of the potential factors. The parameter set will be found after setting up some structure parameters of the algorithm and updating the control parameter according to the results of the last iteration. For instance, Jeong et al. optimized the control parameters to find the most fish-like locomotion by Particle Swarm Optimization (PSO) [21]. To find the fastest swimming speed of the robot, Vo et al. first applied a Genetic Algorithm (GA) to find the suboptimal set and further optimized Hill's Climbing Algorithm (HCA) to find the global optimal set, [22]. Yu et al. also applied Particle Swarm Optimization (PSO) to find the highest backward swimming speed. Therefore, it will improve the efficiency if we can find the maximum locomotor capabilities with a few experiments [23].

Schematic of the plan to apply the Taguchi method to evaluate the maximum locomotor capability under some restrictions. The cure entails a constraint in the parameter space. The parameter space was divided into two parts: a regular space shown in the rectangular area and the rest is the irregular space. The colour represents the Probabilities of Finding the Optimal (PFO). Further exploration is along parameter A as it is the main factor of the PFO.
The Taguchi method is a useful tool to optimize designs for high performance and quality with limited trials [24, 25]. As this method is based on statistics instead of modelling, it is prevalent in engineering [24, 25], including the field of robotics [18]. Here, we applied the Taguchi method to find the maximum swimming speed of a robotic fish with a couple of experiments [24]. Considering some constraint limitations such as the power limitation of the motor, the parameter space was divided into a regular space and the rest, which is the irregular space (as shown in Fig. 1). The main factors were determined through analysis of variance (ANOVA) in the regular space [25]. Swimming speed was further explored along the main factor's direction in the remaining parameter spaces. The maximum swimming speed was determined by a comparison of the two optimal values in the regular and the irregular parameter space. The main contribution of this paper is our exploration of an efficiency method to evaluate the maximum swimming speed of robotic fish based on the Taguchi method. Moreover, this method can be extended to find the locomotor capabilities of various other robotic fish because it does not require modelling.
The remainder of the paper is organized as follows. In Section II, we present the prototype of the robotic fish and its driving system. Section III introduces the design of how to apply the Taguchi method to explore the maximum swimming speed of the robot. The factor analyses of the experimental results are given in Section IV. The discussion and conclusion of our work are presented in Section V.
2. The Prototype of the Robotic Fish
In this chapter, we introduce the prototype of the robotic fish. To date, many prototypes of robotic fish have been made to replicate the performances of live animals [6–12]. Beyond the similar bioinspired locomotions and shapes, robotic fish are proved to have a relationship between swimming speed and body kinematics, similar to that of the real ones [16]. As mentioned in [16], the relationship also depends on the mechanical design and operating conditions. Here, our robotic fish has a different mechanical design and operating conditions. The propulsion is generated using a scotch yoke system and a direct current (DC) motor. The operating conditions include the caudal-fin aspect ratio, the caudal-fin stiffness, the oscillating frequency and the stiffness of the spring that transmits forces from the actuators to the foil.
2.1. The prototype robotic fish
A robotic fish equipped with a scotch yoke was made and shown as in Fig. 3, which is smaller and easier to control than our previous scotch yoke system [26, 27]. The scotch yoke system transforms the continuous rotation of the DC motor into a periodic oscillation. In the system, whenever the energy is input to the DC motor, the eccentric wheel will rotate with the motor, the follow-up frame will then move periodically, following the eccentric wheel and, finally, the caudal fin will be driven to undulate in order to generate the forward propulsion. The oscillating frequency corresponds to the rotating speed of the DC motor; that is to say, the frequency of the beating tail can be deduced through the periods of the power supply to DC motor. The size of the output stem determines the flapping amplitude. Thus the amplitude is adjusted by modifying the length of the stem. Fig. 2 depicts the structure of the scotch yoke system with a caudal fin. Tab.1 shows the detail parameters of our robotic fish. Moreover, as a rigid oscillating output will not only enhance the resistance of water but also reduce the Degree of Freedom (DOF) of the undulatory part, a passive joint is added and connected to the first joint by a spring. With the connection of the spring, the undulation of the caudal fin and the output torque of the DC motor can be smoothed because of the energy storage of the spring.
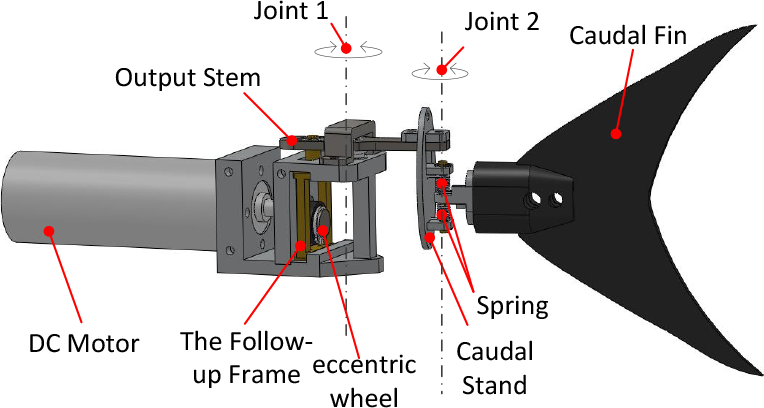
Structure of the scotch yoke designed for the robotic fish's oscillation

Snapshot of the robotic fish propelled by the scotch yoke system made at the Intelligent Control Laboratory of Peking University
Parameters of the scotch yoke system and the robotic fish

2.2. Sine-like oscillation
The undulation of the caudal fin is determined by the mechanical structure. To verify that the output of our scotch yoke system can generate the sine-like oscillation, we built a Cartesian coordinate system with an x axis along the fish's body, from the head to tail (as shown in Fig. 4). In the case of the eccentric wheel, we can find the basic rule between the eccentric distance e (see Fig. 4(c)) and rotation speed of the DC motor ω,

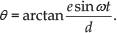
where h is the offset between the centre of the follow-up frame and the origin of the coordinates in the y axis (see Fig. 4(b)); t is time. The relationship between the output angle and the mechanical structure is

where d is the distance between the centre of the follow-up frame and the origin of coordinates in the x axis (see Fig. 4(b)); θ is the output angle of the caudal fin. Therefore, we can deduce the output angle by
angle of undulation is

where the angle of undulation in the system is determined by parameters e and d. Once the mechanical structure is fixed, these two parameters are also defined and, hence, the amplitude is also determined.

Introduction of the Cartesian coordinate (a) location of the partially enlarged drawing, (b) coordinate system defined to describe the scotch yoke system and (c) the eccentric distance in the system

(a) Simulation of the output of the scotch yoke system, (b) the error of the outputs to the sine cure
In order to estimate the error between our scotch yoke system sine-like outputs and the real sine cure outputs, we simulated these systems and the error was smaller than 1 %. The eccentric distance e and the distance between the eccentric wheel and the follow-up frame d were acquired from the design. In the simulation, the rotation speed of the DC motor was set as 120
3. Experimental Set-up
Guided by the Taguchi method, we first designed an orthogonal experiment. Through signal-to-noise (S/N) ratio analysis, we found the maximum swimming speed in the regular parameter space. Subsequently, a statistical analysis of variance (ANOVA) was carried out to find the critical parameters that determine the swimming speed. Then, we applied the rule in the irregular parameter space to find the maximum swimming speed. Thus, we acquired the maximum speed in the whole parameter space.
3.1. The experiment platform
The experiments were carried out in a 2 m × 3 m × 0.3 m tank. An overview global camera was fixed to record the traces of the robotic fish, helping us to analyse the speed of the robotic fish offline. The robotic fish was powered by a DC power supply, and the rotation speed of the DC motor was controlled by the voltage level. The power varied with the resistance force of water as the robotic fish swam in the water. Thus, we recorded the maximum and minimum voltage of the DC power supply, and used the average value of them to estimate the power consumption of the swimming. The experimental schematic is shown in Fig. 6.

Experimental platform schematics for the optimization of the swimming speed of a robotic fish

Snapshots of a robotic fish swimming in a tank in one second
The swimming speed was detected based on the videos, and the frequency was controlled based on the frequency analysis of the power cost. The speed of the robotic fish was calculated via the video analyses. Fig. 7 shows the snapshot of the robotic fish swimming in the tank during 1 s. The speed was estimated by the comparison between the first figure and the last one. As the frame rate of the video was too low to analyse, we used the frequency of the undulation of the caudal fin. We used the oscilloscope to check the frequency of the voltage in order to detect the swimming frequency, as the voltage of the input varied with the flapping during the one-second period. Specifically, the frequency of the voltage is twice that of the flapping frequency, because the undulation of the tail is symmetrical.
3.2. A brief introduction of the Taguchi method
The Taguchi method was proposed by Taguchi based on statistical principles and utilization of engineering knowledge [24, 28]. Because this method is a useful tool to implement a high-quality system at low cost, it has been widely used in the field of quality engineering [24], industrial metal-cutting processes [29] and parameters’ optimization [30].
Generally, to implement the Taguchi method, four main steps should be applied [30]. 1).
3.3. Selection of parameters and their levels
We considered four main factors that may determine the speed of our robotic fish: the shape of the caudal fin indicated by the aspect ratio
a. The aspect ratio of the caudal fin.
The aspect ratio of the caudal fin is defined as the ratio of the square of the span b and the area of the caudal fin Sc,

Considering that most quick-swimming fish are endowed with an aspect ratio of the caudal fin around 4.5 ~ 7.2, we enlarged the threshold of the aspect ratio to 2.4 ~ 8.1 Although we tried our best to make the aspect ratio of the caudal fin of our robotic fish evenly distributed in the optimization threshold, the real aspect ratio may have varied a little from the theoretical values. Detailed information regarding the aspect ratio is shown in Tab. 2.
Aspect ratios of different tail fins

b. The stiffness of the caudal fin
The caudal fin here is made from a carbon rod and plastic paper (made from polyethylene). The carbon rod is similar to the bone of the real fish's fin, while the soft plastic paper is like the soft skin of the fish. Since the stiffness of the caudal fin is proportional to that of the carbon rod and, hence, the diameter of the carbon rod, we can adjust the diameter to modify the stiffness of the caudal fin. Three kinds of carbon rods with the diameters of 0.5 mm, 1 mm and 2 mm were considered in our experiments, and thus, in total, we had 15 kinds of caudal fins for our robotic fish.
c. The flexibility of the spring
Springs with different elastic stiffness values were chosen to test the effect of the swimming speed. The stiffness of the spring was defined as the rotational stiffness,
d. The oscillating frequency
As can be seen from the above analyses, the frequency can be altered by the voltage input to the DC motor. However, the maximum frequencies of different caudal fins are also different for the same driven DC motor, because the maximum output power of the DC motor is constant. Therefore, compared to a traditional regular optional parameter space, the parameter space of our speed optimization was irregular.
The levels of four factors

3.4. Design of experiment
According to the oscillating frequency of the caudal fin, the parameter space was divided into two parts: a regular space and the remaining irregular spaces. The parameters of the regular space are shown in Tab. 3, where the robot can run any set of parameters in the space under the maximum power output of the motor. However, under some specific parameter spaces, the frequency of the beating tail can be set at over 8 Hz. We first analysed the main factors affecting the swimming speed for the orthogonal design in the regular space. Then we applied the rule found in the regular space to the irregular space to maximize the swimming speed.
3.5. Taguchi method design
a. Orthogonal Array Design
The total number of experiments from all possible combinations of the levels is 5×4×3×3=180. Using the orthogonal design, we needed only 25 experiments. The SPSS procedure ORTHOPLAN (SPSS-20.0) was engaged to generate this orthogonal array, which resulted in 25 randomly arranged experiments (as shown in Tab. 4). In this table, each column of the parameter covers all the levels, and the number denotes the corresponding level described in Tab. 3. For example, the number 2 in a parameter frequency means a frequency of 4 Hz.
Experimental layout using an orthogonal array

b. Analysis method
Taguchi proposed using the signal-to-noise (S/N) ratio to measure the quality characteristics that deviated from the designed parameters. Generally, three main categories of characteristics are considered: the-lower-the-better, the higher-the-better and the nominal-the-better. Here, as we wanted to acquire the maximum swimming speed of the robotic fish, the higher-the-better analysis method was chosen in this experiment. Further, we applied a statistical analysis of variance (ANOVA) to determine which parameter is critical for the swimming speed. Therefore, we can optimize the swimming speed in the residual irregular space.
4. Factor Analysis
In this chapter, we analysed the results of our experiments in both the regular parameter space and the irregular parameter space. The effects of all four factors designed in our optimization are illustrated and analysed in detail. We found that the frequency and the stiffness of the spring played the most important roles in the velocity of our robot. This main factor analysis would guide further searching in the irregular parameter space.
4.1. Analysis of the S/N ratio
Compared to previous works based on average values of the trial results, Taguchi used Mean Square Deviation (MSD) to analyse the experimental results in order to derive more information from the data. For the signal-to-noise (S/N) ratio, the term “signal” represents the desirable value (the average value of the data) of the trial data and the term “noise” represents the undesirable value (the standard deviation, or s.d.) of the data [25]. Therefore, the S/N ratio means that the ratio of the average value to the s.d. and the ratio η is defined as

where MSD is the mean-square deviation for trial results.
The MSD is defined differently according to the quality characteristic, i.e., the-lower-the-better, the nominal-the-better or the-higher-the-better. In our experiments, we wanted the swimming speed to be the-higher-the-better; thus MSD was
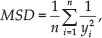
where n is the test number and yi is the trial result of the i th test.
Experimental results for the swimming speed and S/N ratio*

Because the caudal fins were handmade, their aspect ratios varied around the values we set in the orthogonal design.
Tab. 5 shows the experimental results for the swimming speed and the corresponding S/N ratio values. The S/N response for the swimming speed is illustrated in Tab. 6, which shows that frequency variations led to a large variation in the swimming speed. In order to clearly show the effect of each parameter with the S/N ratio, we further calculated the mean S/N ratio with different parameters and levels, and the results are shown in Fig. 8.

S/N average graph for swimming speed
S/N response for swimming speed

4.2. Analysis of variance
The analysis of variance (ANOVA) method is powerful for determining which parameter critically affects the swimming speed.
The sum of the squares for the j th factor can be calculated as
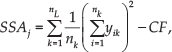
where nL is the number of levels for each factor. nk is the number of trials for each level of factor.

where n is the number of all of the trials. The total sum of squared deviations from the total mean

The error sum of squares and can be obtained from
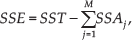
where M is the number of the factors. The mean square deviation is the ratio of the sum of squares to the degrees of freedom (DOF):

where the DOF of the j th factor equals the levels nL minus 1. The mean square deviation of error is calculated as

The F test is a statistical method to determine which factor is more significant, and the value F is calculated as

4.3. Experiments and conclusions of the optimization in the regular space
The results of the ANOVA analyses are shown in Tab. 7. As a value in the range of
Results of ANOVA for swimming speed


Factor analyses of the experimental results. (a) The average swimming speed of our robotic fish with various stiffnesses of the spring, at different undulation frequencies. (b) The average swimming speed of our robotic fish equipped with diverse shapes of caudal fins at different undulation frequencies. (c) The influence of the stiffness of the spring on the swimming speed. The shadow area indicates the standard error for the swimming velocity with the same stiffness of the spring but different other factors. (d) The correlation between the undulation frequency and the swimming speed. The shadow area depicts the standard error for the swimming velocity at the same frequency but different other factors.
a. The effects of the spring's flexibility
Fig. 9(c) shows the relationship between the spring's flexibility and the swimming speed of the robotic fish. With the enhancement of the stiffness of the spring, the swimming speed increases remarkably. We further studied how the stiffness of the spring affects the speed, with various frequencies (see Fig. 9 (a)). When the undulation frequency is lower (around 2 Hz), the robotic fish with lower stiffness swims faster. Different spring flexibilities of the caudal fins have little effect on the speed of the robot. The speed of the robotic fish improved greatly with a higher frequency when the caudal fin was driven without a connection to a spring. This corresponds to the analysis of the ANOVA, in which both spring flexibility and frequency are important, but where frequency is more important than flexibility. The likely reason is that with the increasing frequency of the caudal fin, the angle of the caudal fin's undulation will decrease under the connection of spring, thus limiting the swimming speed. Moreover, as the spring was located in the middle of the fish, the locomotion of the caudal fin depended more on the spring than on the DC motor. Therefore, the wave speed of the swinging fins was almost constant once the spring flexibility was fixed.
b. The effects of the body-undulation frequency
Frequency is one of the most important factors affecting the speed of the robotic fish. Fig. 9 (d) shows the relationship between the frequency and the swimming speed. Through the positive correlation between them, we can deduce that swimming speed can be improved by increasing the frequency. Fig. 9 (b) shows the importance of the frequency and AR; we can easily find that the frequency is more important than the AR. It seems that the higher the frequency, the lower the speed reached, resembling an exponential relationship.
5. Experiments in the Irregular Space
Although (a) a rigid connection between the caudal fin and the body and (b) a higher oscillating frequency are the critical factors for improving swimming speed, the highest frequency is limited by the maximum power output of the DC motor. Therefore, we made the frequency as large as possible within the power support of the motor and with infinite spring stiffness. By considering the coupling of the frequency and other factors, we determined the maximum frequency for each caudal fin. To summarize, the maximum speed of our robotic fish was 870 mm/s (about 2.6 BL/s), which was achieved at the highest frequency of 12Hz, with the aspect ratio being 5.1 and the diameter of the carbon rod being 1 mm. Despite a minor effect of the aspect ratio and stiffness of fin in the regular space, we also analysed these two factors in the irregular space.
We found that the maximum speed was achieved at the frequency of 12 Hz with a moderate aspect ratio of (AR=5.1), as shown in Fig. 10,. This can be explained with reference to two aspects: propulsion and efficiency. Under the same undulating frequency, the caudal fin with a smaller AR will generate more thrust due to its larger contact area with the water. Meanwhile, this caudal fin also needs a larger power input, which increases the burden on the DC motor. Therefore, a suitable caudal fin should be chosen in the case of a limited power input to the system.
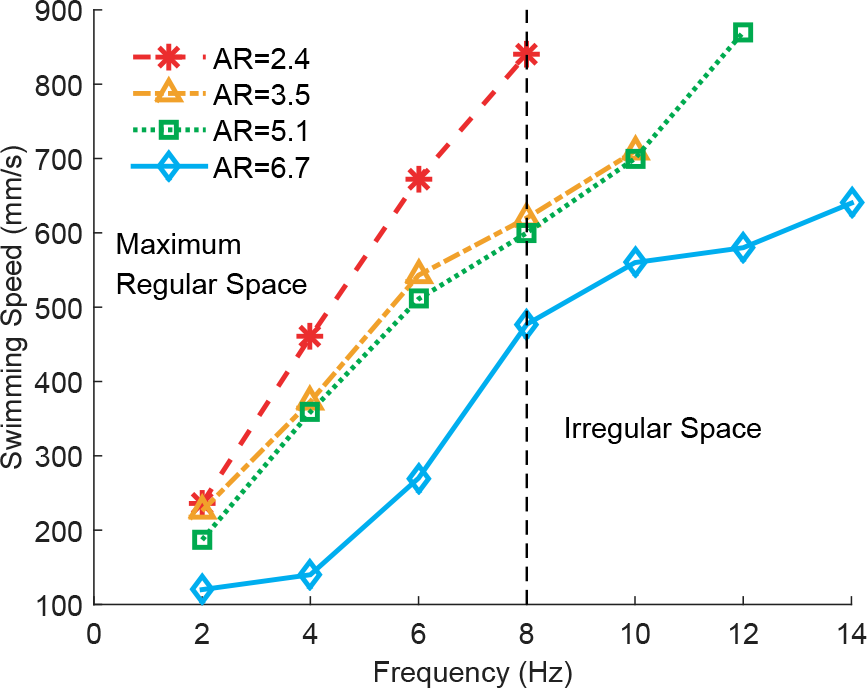
The effects of AR on the swimming speed. D=1mm, k=∞.
The relationship between the stiffness of the caudal fin and the swimming speed is non-linear (as shown in Fig. 11). As described above, we modified the stiffness of the caudal fin by altering the diameter of the carbon rod in the fins. Most previous research on the relationship between the stiffness of the caudal fin and the swimming speed concluded that swimming speed will benefit by using a moderate stiffness of the caudal fin [33, 34]. Compared to this research, we found a more complex result: a non-linear relationship between speed and stiffness. When the oscillating frequency is low (around 2 Hz), the stiffness has less of an effect on the swimming speed. Whenever the frequency is higher, the rigid caudal fin will limit the swimming speed of the robot. Moreover, the complex relationship between the stiffness of the caudal fin and swimming speed corresponds to the natural situation, in which fish modify their fins’ stiffness by adjusting the muscles around them to adapt to the environment [35].

The effects of D on the swimming speed. AR=5.1, k=∞.
6. Discussion and Conclusion
In this article, we applied the Taguchi method to evaluate the maximum locomotor capabilities of a robotic fish. The robotic fish was driven by a DC motor and a scotch yoke mechanism. Four factors were considered in the optimization: the tail's flapping frequency, the Aspect Ratio (AR), the diameter of the carbon rod (representing the stiffness of the caudal fin) and the flexibility of the joint connection spring. Due to the limitation of the output power of the motor, the parameter space was an irregular space. We divided this space into a regular space and the remaining irregular spaces. In the regular space, we found the frequency and the stiffness to be the main factors of the orthogonal design, and explored the rest of the irregular space with a higher frequency and stiffness. After the tests on the robotic fish, we found that the robotic fish achieved its maximum swimming speed of 870 mm/s when AR= 5.1, D= 1 mm, k=∞ and f= 12 Hz.
The efficiency of this method is very high, as the analyses were only based on 25 trials in the regular parameter space. A total of 180 trials is required if we traverse all the factors and levels. Six more trials were carried out to find the maximum swimming speed in the irregular space. It requires fewer trials to evaluate the maximum swimming speed than the evolutionary algorithm [21–23].
This method is a general one because it does not require any special information of the robot, such as weight, height and length. Therefore, we can also apply this method to explore other locomotors’ capabilities and other robots, if the factors are not strongly coupled, such as manoeuvrability or power consumption. With a power detection model onboard, we can even explore the most efficient gait by evaluating the swimming speed and power cost using a suitable orthogonal design. Further, we can also apply this method to robotic fish propelled by pectoral fins, where the hydrodynamics are more complex than the ones we studied here.
There are several aspects for future work. Guided by the analyses of the experiments of the speed optimization, we can further build faster swimming robots which mimic carangiform fish. Up to now, the robotic fish has been powered by a line, which may limit its swimming ability when it achieves a higher speed. Therefore, a high-beating frequency robotic fish without a power line will enhance the underwater locomotion capability of the robotic fish.