
Abstract
Ultrafine pure and Mn-doped SnO2 nanoparticles (NPs) were synthesized via the microwave technique. They were produced using tin chloride and hexamethylenetetramine at the molar ratio of 1:20. The concentrations of Mn in the SnO2 matrix were in the range of 0.1–5 mol%. These nanomaterials were characterized using different techniques. SEM and TEM results show ultrafine NPs with sizes around 10 nm in both pure and Mn-doped samples. A single-phase rutile-type tetragonal structure was observed in pure and Mn-doped samples, as revealed by XRD analysis, while PL emission spectra of these samples showed the broad band peaking at 365 nm. The intensity of this band was observed to increase by increasing the concentration of Mn up to 0.3 mol%, and then to decrease at higher values. A Raman spectrum of the pure sample shows two bands at 630 and 780 cm−1, which are the regular A1g and B2g vibrations of SnO2, while an extra band is observed at 210 cm−1 in the doped samples. The resistivity of Mn-doped SnO2 NPs was observed to decrease by increasing the temperature, but it drastically increased by increasing the Mn content. The activation energy of Mn-doped SnO2 NPs was also calculated, and was found to increase from 0.53 to 1.21 eV by varying the Mn dopant from 0.1 to 5 mol%. These results show that the microwave technique is a powerful tool that can be used to produce a high yield of ultrafine SnO2 NPs. Moreover, Mn was found to be a proper activator for tuning the optical and electrical properties of this material, for its application as a dilute magnetic semiconductor or spintronic devices.
1. Introduction
Tin oxide (SnO2) is an n-type, wide band-gap (3.6 eV) semiconductor material, which has large exciton binding energy (130 meV) with a rutile crystalline structure and demonstrates numerous enthralling physical as well as chemical properties [1–2]. It is a key actinic material that has enamoured zest as a postulator for optoelectronic devices [3], gas sensors [4–5], transparent conducting electrodes [6–7], catalyst supports [8] and spintronics [9]. The structural and physical properties, such as particle size, morphology and crystallinity, of these oxides depend on the synthesis route. Nano-sized SnO2 were prepared via several methods such as sol-gel [10–11], chemical co-precipitation [12], chemical precipitation [13] and other methods. However, nanoparticles synthesized by the above-mentioned methods are often expensive, beside the challenges inherent in producing them on mass scales.
Recently, microwave-assisted synthesis has emerged as a novel method for producing many nanomaterials. Heat is generated internally within the material, instead of originating from external sources. Microwave heating is a promising technology, and the number of its applications to the synthesis of nano-sized materials has also been growing rapidly owing to its unique effects, such as rapid volumetric heating, increased reaction rate and a shortened reaction time, as well as the enhanced reaction selectivity and energy savings [14–15]. For example, Yoshida et al. [16] reported on size-controlled microwave synthesis of SnO2 nanocrystals for dye-sensitized solar cells. Habibzadeh et al. [17] reported on novel microwave-induced combustion synthesis of SnO2 nanoparticles for selective sensing of CO using tin chloride. Therefore, microwave processing is an alternative economical method to produce SnO2 and other metal oxide nanostructures.
Tin oxide needs to be doped with a proper activator(s) for the modification of its optical and structural properties. A considerable amount of research has been conducted (and continues) regarding doped SnO2 nanoparticles using different methods; however, a very limited number of works have reported on using the microwave technique for producing doped SnO2 nanoparticles. Mn ions could be proper candidates to replace Sn ions in an SnO2 lattice due to their larger thermal solubility, which can increase the amount of injected spins and carriers. This can make Mn-doped SnO2 a promising material for spintronics applications. Until now, most of the reported studies paid attention to the magnetic properties of Mn-doped SnO2 [18]. The optical and electrical properties of Mn-doped SnO2 nanoparticles prepared via the microwave method are still not completely understood. Detailed studies about these properties are needed to explore the potential applications of this nanomaterial. Recently, Rajeshwaran and Sivarajan [19] reported on the synthesis of Mn-doped SnO2 nanoparticles using the microwave technique. They evaluated the influence of Mn doping mainly on the gas-sensing properties of SnO2 nanoparticles. However, they did not include any surfactant to control the particle size, and therefore could not produce fine nanoparticles with sizes of less than 20 nm. Moreover, they did not study the electrical properties of this nanomaterial. Venugopal et al. [20] used the precipitation method for producing ultra-fine Mn-doped SnO2 nanoparticles. They used NH4OH as a precipitation agent. However, they neither used the microwave technique in producing this material, nor studied its electrical properties.
Hexamethylenetetramine (HMT) is a readily available and cheap heterocyclic organic compound. The molecule of this compound has a cage-like structure that is similar to adamantine and has a high solubility in water or polar organic solvents [21]. HMT was reported to be a versatile ligand that can serve as a terminal monodentate or as a bi-, tri- and tetradentate bridging ligand [22]. It has been reported to act as a precipitating agent [23], a nanoparticle stabilizer (a surfactant in an aqueous solution) [24], a morphology modifier [25], etc. For example, Li et al. [23] synthesized CeO2 nanoparticles along with other structures via the solvothermal method using hexamethylenetetramine. Anand et al. [24] reported on a low-temperature synthesis of HMT-stabilized ZnS nanoparticles. Yufanyi et al. [26] synthesized CdO nanoparticles using thermal decomposition of a cadmium-HMT complex.
Therefore, in the present study, we report on the production of ultrafine pure and Mn-doped SnO2 nanoparticles using the microwave technique. Tin chloride and hexamethylenetetramine were used as precursors at the molar ratio of 1:20. The produced pure and doped samples were analysed by X-ray diffraction (XRD), scanning electron microscopy (SEM), a transmission electron microscope (TEM), diffuse reflectance spectra, Raman spectra, Photoluminescence (PL) emission spectra and resistivity measurements. These analyses were used to study the effect of Mn ions on the structural, optical and electrical properties of Mn-doped SnO2 nanoparticles.
2. Experimental Details
2.1 Materials and method
High-purity tin chloride as a precursor (SnCl2.2H2O, 99.99%, Sigma Aldrich) and hexamethylenetetramine (C6H12N4, 99.99%, Sigma Aldrich) as a surfactant were used at a ratio of 1:20. They were used to produce SnO2 nanoparticles without further purification. The synthesis was carried out in a microwave synthesis setup (Milestone, Italy). In a typical case, an appropriate amount (6.768 gm) of SnCl2.2H2O and the corresponding twenty moles of C6H12N4 (84.12 gm) were dissolved in 200 ml of deionized water in a round-bottom flask. Microwave irradiation was proceeded at 750 W (120 °C) for 10 min. After microwave processing, the solution was cooled down to room temperature. The resulting precipitate was separated by centrifugation, then washed with deionized water and absolute ethanol several times and finally dried in an oven at 80 °C for 12 h. Prior to the characterization, the samples were annealed at 600 °C for 1h. The Mn-doped samples were produced in a similar way with the use of Mn (CH3COO)2 4H2O as a precursor for the Mn dopant. This dopant was incorporated at different concentrations ranging from 0.1 to 5 mol%. The desired concentration was initially dissolved in 50 ml of deionized water and to this solution SnCl2.2H2O and C6H12N4 were added and introduced into the microwave chamber.
3. Characterizations
The structures, crystallite sizes and phases of pure and Mn-doped SnO2 nanoparticles synthesized via the microwave technique were analysed by X-ray diffraction (Rigaku, Ultima-IV X-ray diffractometer) using Cu-Kα radiations (λ = 0.154 nm). The surface morphology for all the samples was carried out using a scanning electron microscope (SEM) (JSM-7600F, JEOL, Japan), while the microstructure was analysed by a transmission electron microscope (TEM) using ARM-200F, JEOL, Japan. The band gaps of the synthesized tin oxides were evaluated by extrapolating the curve obtained by plotting (F(R)×hv)1/2 versus hv, where F(R) is the Kubelka-Munktrans formations of the %R values in diffuse reflectance spectra. Raman spectra were recorded using a Raman microscope (DXR-Thermo scientific) with a 532 nm laser as an excitation source at a power of 8 mW. Photoluminescence (PL) emission spectra were recorded using a fluorescence spectrophotometer, model RF-5301 PC, Shimadzu. The excitation wavelength was 325 nm. The resistivity measurement of Mn-doped SnO2 samples were recorded using the LSR-3 Linseis-Seebeck Coefficient & Electric Resistivity system. The powder samples were pressed using a hydraulic press to make pellets. The diameter and thickness of these pellets were 10 and 1 mm, respectively. During the measurement, the desired pellet was positioned vertically between two electrodes. The lower electrode contained a heater, while the entire measuring arrangement was located in a furnace. Two thermocouples were also used for measuring the temperature gradient. The heating rate and temperature gradient were 5 °C/min and 50 °C, respectively.
4. Results and Discussion
4.1 X-ray diffraction
The crystallinity and phase of pure and Mn-doped SnO2 nanoparticles were examined via XRD and the results are illustrated in Fig. 1. Three prominent diffracted peaks as well as six smaller ones can be seen in pure SnO2 nanoparticles (curve a). These peaks can be associated with the hkl values (110), (101), (200), (211), (220), (002), (310), (112) and (301), which are of tetragonal structure of SnO2 [27]. A significant broadening in these peaks can be seen, indicating a formation of ultrafine crystallites. The crystallite sizes of this nanomaterial, calculated using the Scherrer's formula, are around 7 nm. In the case of Mn-doped samples (Fig. 1, curves b, c, d, e and f) no extra peaks can be observed, indicating that the Mn dopants were well incorporated at Sn sites. The data analysis showed that there is a slight decrease in the value of the lattice constant c by increasing the concentrations of Mn dopants. The value of c was decreased from 3.184 to 3.175 Å by increasing the Mn concentration from 0 to 5 mol%. This might be due to the variation in the ionic radius of Sn4+ and Mn4+. These observations were also reported by Rajeshwaran and Sivarajan [19], who produced Mn-doped SnO2 via the microwave technique. However, as mentioned above, this group did not include any surfactant to control the particle size, and therefore could not produce fine nanoparticles; instead, a low quality polycrystalline structure of SnO2 nanoparticles (poor crystallinity) was observed.
The inset shown in Fig. 1 is a typical graphical evaluation of the band gaps of pure and 5 mol% Mn-doped SnO2 nanoparticles. The evaluated band gap of ∼3.63 eV for pure SnO2 nanoparticles was in accordance with the literature values [19,28]. The obtained band gap for 5 mol% Mn-doped SnO2 nanoparticles was found to be 3.80 eV. This increase in the value of the band gap by Mn doping might be due to the formation of additional electronic levels inside the band gap of SnO2 by Mn4+ ions. These electron levels were expected to cause charge transfer transitions between the conduction/valance band of SnO2 and Mn ions. Similar results were also reported by Venugopal et al. [20], who produced Mn-doped SnO2 via the precipitation method. They attributed this shift in the band-gap value to the sp-d exchange interactions between the localized d electrons of Mn4+ ions substituting Sn4+ and the band electrons. The obtained band-gap values in this study are higher than those reported by Rajeshwaran and Sivarajan [19], which might be due to the differences in the particle size.

XRD patterns of pure and Mn-doped SnO2 nanoparticles at different concentrations. The inset shows a graphical evaluation for the band gaps of pure and 5 mol% Mn-doped samples.
4.2 SEM and TEM analysis
Fig. 2 (a and b) shows the surface morphology of pure SnO2 nanoparticles prepared via the microwave technique. It is evident from the figure that the formed particles are of almost spherical shapes and have a uniform size distribution. The Mn-doped nanoparticles are similar to the pure ones (Fig. 3, a–d). A slight decrease in the particle size by around 10% is observed by increasing the concentration of Mn from 0 to 5 mol%. The formed nanoparticles have sizes of less than 12 nm, which is the uniqueness of the microwave technique besides the use of a proper surfactant (i.e., HMT in the present study). During the synthesis of these nanomaterials, it was observed that the yield was good enough. Around 4 gm of SnO2 nanoparticles were obtained by using 6.768 gm of SnCl2.2H2O (the theoretical value is 4.521 gm). These features are the main factors that make this technique superior to the conventional sol-gel, co-precipitation and other chemical routes that are commonly used for the synthesis of metal oxide semiconductors [14–15].

SEM images of pure SnO2 nanoparticles obtained at different magnifications

Typical SEM images of Mn-doped SnO2 nanoparticles obtained at the same magnification (a: 0.3 mol%, b: lmol%, c: 3mol% and d: 5mol%)
The TEM images presented in Fig. 4 show the microstructures of pure and Mn-doped SnO2 nanoparticles obtained at the same magnification. The TEM results are similar to those of the SEM. A slight decrease in the particle size by increasing the Mn concentration can be observed in these images. These TEM results are similar to those reported earlier [19,30] with a good improvement in reducing the particle size due to the use of HMT as a surfactant. The particle size distribution histogram of 3mol% Mn-doped SnO2 nanoparticles is shown in Fig. 5(A). This figure shows that the average size of the particles is around 9 nm. Fig. 5(B) shows a high-resolution TEM image of 5mol% Mn-doped SnO2 nanoparticles. It shows a particle with a size of around 8 nm. The lattice d-spacing value is also shown, which is around 3.3 A for this doped sample. This value can be indexed as the SnO2 (110) plane (DP Card No. 00-0021-1250), which is close to that reported in the literature [31]. These TEM results could provide a confirmation for obtaining ultra-fine nanoparticles of pure and Mn-doped SnO2 with improved crystallinity using the microwave technique.

Typical TEM images for pure and Mn-doped SnO2 nanoparticles obtained at the same magnification (a: pure, b: 0.3 mol%, c: 3 mol% and d: 5mol%)
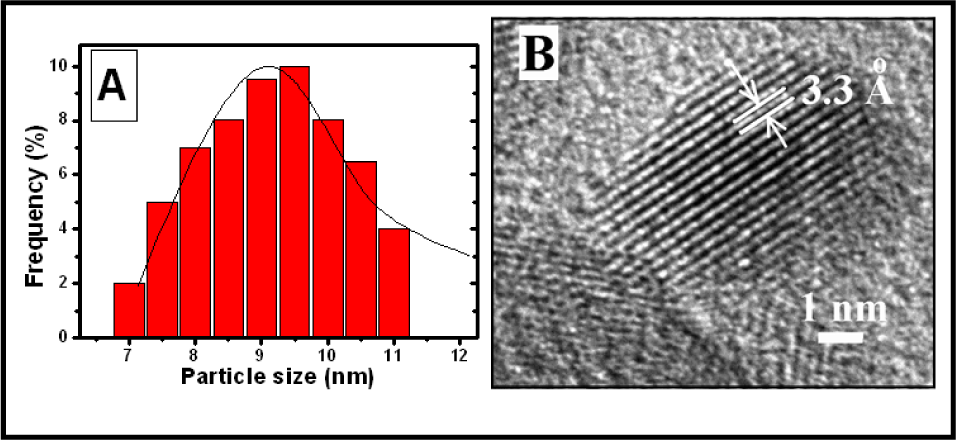
(A) A typical particle size distribution histogram of 3mol% Mn-doped SnO2 nanoparticles, (B) a high resolution TEM image of 5mol% Mn-doped sample
5. Raman and PL Spectroscopy
The Ramanq spectra of pure and Mn-doped SnO2 nanoparticles were recorded and the results are shown in Fig. 6. These spectra were recorded at room temperature in the range of 200–1000 cm−1. This technique is fairly useful to describe the possible vibration modes in any material as a reflection of its purity and phase. Under this characterization tool, a normal mode can be explained as 3n, where n is the total number of atoms existing in a unit primitive cell and the coordinates give the approximate displacements of the atoms from their respective equilibrium positions. According to the group theory, SnO2 in its rutile phase generates 18 branches for the vibration modes in the first Brillouin zone and the mechanical representation of the normal vibration modes at the centre of the Brillouin zone can be defined as [32]:


Raman spectra of pure and Mn-doped SnO2 nanoparticles at different concentrations
where, two, the single A2u and the triply degenerated Eu mode are IR active modes. The A2u mode has one optic and one acoustic mode, whereas Eu has one optic and two acoustic modes. There are four Raman active modes, three non-degenerated (A1g, B1g and B2g) modes, one doubly degenerated (Eg) mode and two silent (A2g and B1u) modes. When O atoms vibrate and Sn atoms are at rest, triggers to the Raman active modes. Meanwhile, non-degenerated (A1g, B1g and B2g) modes vibrate in the plane ⊥ to the c-axis and the doubly degenerated Eg mode vibrates in the direction of the c-axis. The spinning of O atoms throughout the c-axis, with all six O atoms of the octahedral getting involved in the vibration, gives rise to the B1g mode. In the A2g infrared active mode, Sn and O atoms vibrate in the c-axis' direction, and, in the Eu mode, both Sn and O atoms vibrate on the plane ⊥ to the c-axis. The silent modes concur with the vibrations of Sn and O atoms on the direction of the c-axis (B1u) or in the plane ⊥ to this direction (A2g). The fundamental three bands observed at 476 cm−1Eg, 632 cm−1 A1g and 778 cm−1B1g are consistent and in good agreement with earlier reported results [11], whereas additional weak Raman bands at 500 cm−1 and 690 cm−1 can be assigned as A2u (TO) and A2u (LO) modes, both of which are IR active. The band at 544 cm−1 is a Raman forbidden B1u mode.
One extra band located at 204 cm−1 can be observed in Mn-doped samples. The intensity of this band was observed to increase by increasing the Mn contents. This indicates that this band is related to some vibration modes that are induced by incorporating Mn2+ ions. It might be possible that a small part of the SnO or MnO phase is formed mainly by incorporating Mn dopants. In other words, Mn impurities could favour the formation of a small part of SnO/MnO, which could not be detected by XRD. In this case, the band at 204 cm−1 can be ascribed to the A1g mode of SnO [33]. A slight broadening in the A1g band is observed by increasing the Mn contents, which might be ascribed to the effects of oxygen deficiency and crystal distortion, caused by the introduction of Mn ions. Additionally, such a broadening of A1g mode is referred to the decrease of the grain size [34], which is consistent with the SEM and TEM results. In general, the appearance of the “classical modes” in these spectra confirms the tetragonal rutile structure of Mn-doped SnO2 nanoparticles.
Photoluminescence is a commonly used tool for probing electron-hole surface processes of semiconductor materials, the determination of band-gap energy and the identification of specific defects for radiative transitions and impurity levels in these materials [35,36]. Earlier reports showed that there are several other factors affecting the emission wavelength of the semiconductor oxide, including the particle's morphology, size and concentration of the dopant and excitation wavelength [37]. Fig. 7 shows the PL emission spectra of pure and Mn-doped SnO2 nanoparticles recorded at room temperature. The pure sample has a prominent broad band peaking at 365 nm (curve a). The doped samples (curves b, c, d, e and f) have similar peaks, but with enhanced intensity. The maximum intensity is observed at an Mn concentration of 0.3mol%; beyond this value, it decreases. It has been reported that the near band-edge emission of the SnO2 is observed at around 390 nm [24]. In the present case, it is quite possible that this peak shifted to the blue region, due to the widening in the band gap as a result of particle-size reduction, therefore showing an emission at 364 nm. This result is very close to that reported by Rajeshwaran and Sivarajan [19], who produced Mn-doped SnO2 via the microwave technique. The other emissions above the band-edge might be due to oxygen vacancies in the material [38].
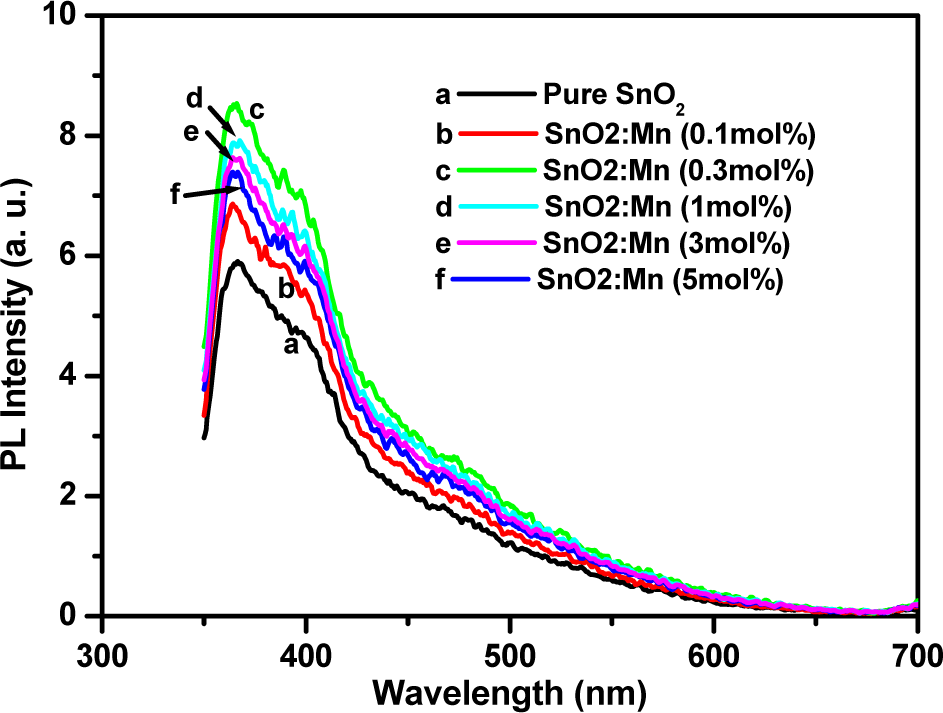
PL emission spectra of pure and Mn-doped SnO2 nanoparticles at different concentrations
The other possibility is that the band located at 364 nm can be attributed to electron transition, mediated by defect levels in the band gap. These defects might include oxygen vacancies and the luminescence centres formed by such tin interstitials or the presence of dangling bonds in SnO2 nanoparticles [20]. This UV emission is the near band-edge emission, generated by the free-exciton recombination, while the visible emission known to be a deep-level emission is caused by the impurities and structural defects in the structures. The visible emission was also attributed to the formation of luminescent centres formed by defects [19].
6. Resistivity Measurements
To understand the transport properties of pure and Mn-doped SnO2 nanoparticles synthesized via the microwave technique, resistivity measurements were performed in the temperature range of 300–400 K and the results are shown in Fig. 8(A). The resistivities of these doped samples were observed to decrease by increasing the temperature, but also to drastically increase by increasing the Mn contents. The general trend of the change in the resistivity of Mn-doped SnO2 nanoparticles with temperature is a typical behaviour of semiconductors, in the sense that their resistivity decreases with an increase in temperature. This may be due to the structural changes that occur as a result of post-annealing treatment. The increase in resistivity with an increase in Mn contents is perhaps due to the change in the band-gap values as mentioned above (Fig.1 inset). Wider band-gap materials have higher resistivities.

(A) Resistivity as a function of temperature, and (B) Plot of Log [ρ(Ω.cm)] as a function of 1000/T of Mn-doped SnO2 nanoparticles at different concentrations
The activation energy (Ea) is obtained by fitting the DC resistivity data (Fig. 8(B)) with the Arrhenius equation:
Activation Energy (eV) of Mn-doped SnO2 nanoparticles at different concentrations

The value of Ea for Mn-doped SnO NPs lies between 0.53 and 1.21 eV, which suggests that conduction in this material is due to the thermally assisted tunnelling of the charge carriers through the grain boundary barrier, and the transition from the donor level to the conduction band.
7. Conclusion
Ultrafine pure and Mn-doped SnO2 nanoparticles were synthesized via the microwave method. XRD results showed a single phase of SnO2 in pure and Mn-doped nanoparticles. SEM and TEM results showed a well-prepared consisting of almost spherical SnO2 NPs. The PL results showed a broad band peaking at 364 nm in both pure and doped samples, with a maximum intensity at Mn concentration of 0.3 mol%. The resistivities of Mn-doped SnO2 NPs were observed to decrease by increasing the temperature, but they drastically increased by increasing the Mn contents. The activation energy of Mn-doped SnO2 NPs were also calculated and found to increase with an increase in the Mn concentration. These results showed that the microwave approach is a powerful technique to produce a high yield of an ultrafine SnO2 nanomaterial. HMT was found to be a suitable surfactant for obtaining ultra-fine NPs of Mn-doped SnO2. Moreover, Mn is a proper activator for changing the optical and electrical properties of this material, for its application in a dilute magnetic semiconductor or spintronic devices.
Footnotes
8. Acknowledgements
This project was funded by the National Plan for Science, Technology and Innovation (MAARIFAH) – King Abdulaziz City for Science and Technology – the Kingdom of Saudi Arabia – award number (11-NAN2045–03). The authors also thank the Science and Technology Unit, King Abdulaziz University for its technical support.