
Abstract
In recent years, the authors studied the possibility of using low frequency in-air ultrasonic sensors in several applications of robotic interest related to the perception and the reconstruction of the external environment.
They introduced several methods based on innovative mathematical tools for solving problems, such as the position detection and orientation of a mobile robot with respect to a corridor wall, the correct reconstruction of two orthogonal panels in spite of the effect of multiple reflections affecting the data in the corner zone, and the reconstruction of the boundary walls of a room environment.
All the proposed innovative strategies were tested on a designed mechatronic scanning system consisting of ultrasonic sensors rotated by a servo modular actuator and also with the data from a scanning validated model.
In this review, the main steps and achievements will be presented so as to summarize the research work of recent years as well as reflect on the importance of appropriate and innovative techniques regarding ultrasonic data processing. The originality of the present work concerns the possibility of disposing all the developed approaches as a whole in order to use in-air ultrasonic sensors for robotic perception in several environmental situations.
Keywords
1. Introduction
An important challenge in the robotic research field is focused on the aim of perceiving the surrounding environment and recognizing the obstacles; otherwise, it is difficult for a robot to avoid collisions.
Expensive devices, such as laser sensors, infrared or camera systems, are often preferred for collecting information about the surrounding environment; although these light-based sensors are very accurate, they are not able to work in certain conditions, such as smoky rooms, or in the presence of light-absorbing or shining obstacles [1]. For this reason, the scientific community is interested in analysing the possibilities of perception using mechanical (acoustical) waves; the sensors, which are based on the acoustical wave propagation and used for navigation, are also known as sonar (SOund NAvigation and Ranging).
Although these sonar devices were firstly used for underwater measurements, they have subsequently been used for in-air measurements (i.e., in-air sonar sensors). These sensors spread mechanical waves through the air and wait for the echoes. The elapsed time between the transmission start and the reception is the Time of Flight (TOF), which is proportional to the travelled distance. Several TOF measurements are generally required to statistically estimate the distance [2]. The TOF values depend on the speed of sound, while digital signal processing techniques have proven to be a necessity for compensating the speed variations due to temperature or other atmospheric conditions [3]. Some physical phenomena pertaining to ultrasonic propagation have made the development and the use of sonar sensors for obstacle reconstruction more difficult, compared with laser or infrared sensors. In particular, the impossibility of correctly detecting an obstacle presence, when the reflecting surface is not orthogonal to the direction of wave propagation, is an important deterrent for the use of this type of device in robotic applications. This is mainly due to the wide sound beam propagated, which is responsible for unexpected TOF values owing to several factors, such as specular reflections and scattering.
The authors dealt with this problem by developing and testing algorithms for obstacle detection and reconstruction using in-air sonar sensors [4–11]. The present article involves recently published studies and summarizes all the significant findings in a unique contribution.
They realized an array of four ultrasonic sensors moved by a digital modular actuator [4] and utilized it to scan corners, planes, corridors and rooms [4–11]; the reconstruction algorithms used the digital sonic signals and the analogue full-waveforms. Moreover, they carefully examined the physical phenomenon of multiple reflections in the zone close to the intersection, introducing new reconstruction strategies based on powerful mathematical tools, such as Fuzzy C-Means (FCM) algorithm [4–11], RANdom SAmple Consensus (RANSAC) fitting [4–6,9], Principal Component Analysis (PCA) [7–8,9,11] and a function inspired by the Gibbs entropy [10].
The estimation methods, based on minimization and approximation techniques, have been tested and compared in numerous experiments related to the reconstruction of orthogonal planes and room environments, as well as on a validated model of ultrasonic scanning.
This summary paper shows all the main results achieved in recent years and demonstrates the effective possibility of using in-air ultrasonic sensors in an innovative way within robotics. Considering the low cost of these sensors and, therefore, their common presence on mobile robots, the results of this research should be considered of great interest. Moreover, the proposed reconstruction strategies could also be applied in many industrial robotic applications as well, where the use of in-air ultrasonic sensors is undoubtedly more advisable or necessary (e.g., a welding robot for joining two flat surfaces operating in smoky environments).
2. The Sonar Sensor Array Used for the Tests
The sonar sensor array used in all the tests is described in [4–11] and is reproduced here for clarity. It is composed of two types of ultrasonic sensors: the Hagisonic AniBat HG-M40DAI and the HG-M40DNI [12]. These sonar sensors are both transmitters and receivers of ultrasonic waves at a frequency of 40 kHz [12]. The HG-M40DAI sensor spreads an anisotropic beam and may detect obstacles up to 4 m away, with a horizontal directivity of about 150° and a vertical directivity of about 60°–70° [12], while the HG-M40DNI sensor spreads an isotropic beam by up to 9 m and has a directivity of 10° [12].
The rotating array is moved by means of the servo modular actuator Dynamixel AX-12+ [13]. This smart device consists of a precision motor and a control circuitry, which is connected to a computer in order to drive the rotation of a frame by using the Universal Serial Bus (USB) [13]. The actuator was placed on an extendible professional tripod and its shaft was constrained to a thick plastic bar onto which four sensors were screwed. The rotating device is illustrated in Figure 1, where the HG-M40DAI models are labelled with the numbers “1” and “3”, while the HG-M40DNI models are labelled “2” and “4”.
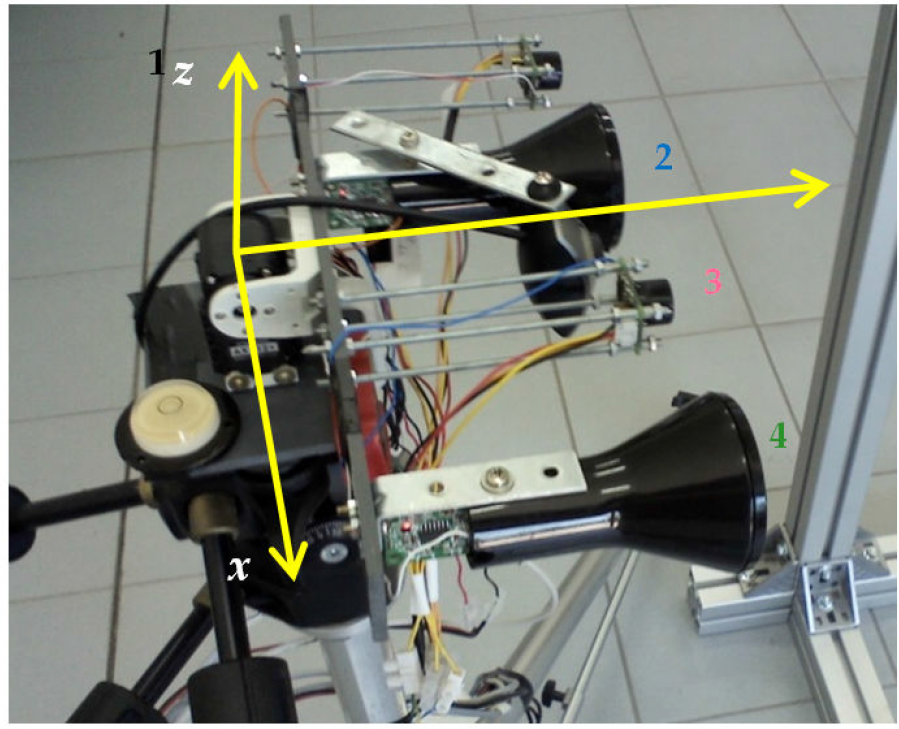
The scanning device for the reconstruction of orthogonal planes and room environments
The same sensor array has also been used for evaluating the orientation of a wall; in this case, the tripod has been rotated in such a way that the array rotation axis z is perpendicular to the xy plane to obtain a right-handed orientation (as in Figure 2).

The scanning device for estimating the wall orientation
All the technical details of the electronic boards that were realized - the sensor electrical connections and rectangular driving signal generation with a frequency of 12.5 Hz, the duty cycle of 4% and the amplitude of 4 V - are fully described in [4–11]. The TOF is estimated by the period that elapsed from the rising edge of the input pulse to the rising edge of the output pulse, while all the output signals were acquired by the acquisition board NI-USB 6210 [14]. In case of direct reflection, if the calculated time is indicated by t iθ (the ith sensor is in the motor position θ; that is, the angle measured from the y axis to the frame direction in the yz plane in Figure 1; whereas it is the rotation angle in the plane xy for the set-up in Figure 2), the distance is obtained by (1), where v is the estimated speed of sound (v ≈ 345 m/s) and h is a correction factor (h = 0.922) for considering the system delay, as estimated by preliminary calibration tests [4–11].

In order to obtain a reliable distance estimation, the time t iθ is obtained as the median value of several consecutive measured values.
3. A Validated Model for the Ultrasonic Propagation
A validated model of the ultrasonic scanning has been proposed and validated [8–9], with the experimental data of the scanning related to the configuration in Figure 2. The ultrasonic beam is characterized by a far field, which has the shape of a cone originating from the centre of the sensor capsule, and where α refers to the semi-aperture angle (visibility angle). The intersection between the cone and the sensor rotation plane defines a bounded region inside which an obstacle may be detected. The boundary of this region has been modelled by joining the curves represented by parametric equations, as fully described in [8–9], which depend on the generic pointing direction of the rotating device θ by the circle radius r, described by the sensor rotation and by the measure range k.
The sensor distance d θ is measured in an opportune rotation step when the motor is stopped and is, ideally, the minimum distance between the sensor position (x 0 , y 0 ) and the target line on condition that the sensor is able to catch the reflection according to the directivity diagram and the law of reflection. In Figure 3, the region (whose boundary is indicated as a dotted curve) and the minimum distance direction (shown as a marked and dotted line) are plotted for θ=60°, r=15 cm, α=85° and k=400 cm, while the target line (the intersection line between the scanned wall and the sensor rotation plane is expressed in (2), while β is the angle of yaw and q is the y-intercept), is obtained for β=30° and q=110 cm.

In this case, the target point (also called the reflecting point) is inside the bounded region (successful detection). In Figure 4, the same parameters of the target wall (β=30° and q=110 cm) and configuration (r=15 cm, α=85° and k=400 cm) are considered, but the target point is outside the bounded region (unsuccessful detection) when the position is θ=0°. Here, the sensor is not able to return the TOF, while the distance value d θ may be equally imposed in relation to the measure range k. The model considers that the maximum sound pressure of the ultrasonic sensor is along the region axis of the cone [15], while the wave pressure decreases very deeply outside. The semi-aperture angle α is directly connected with the horizontal directivity of the sensor, including the effects of eventual lateral lobes.
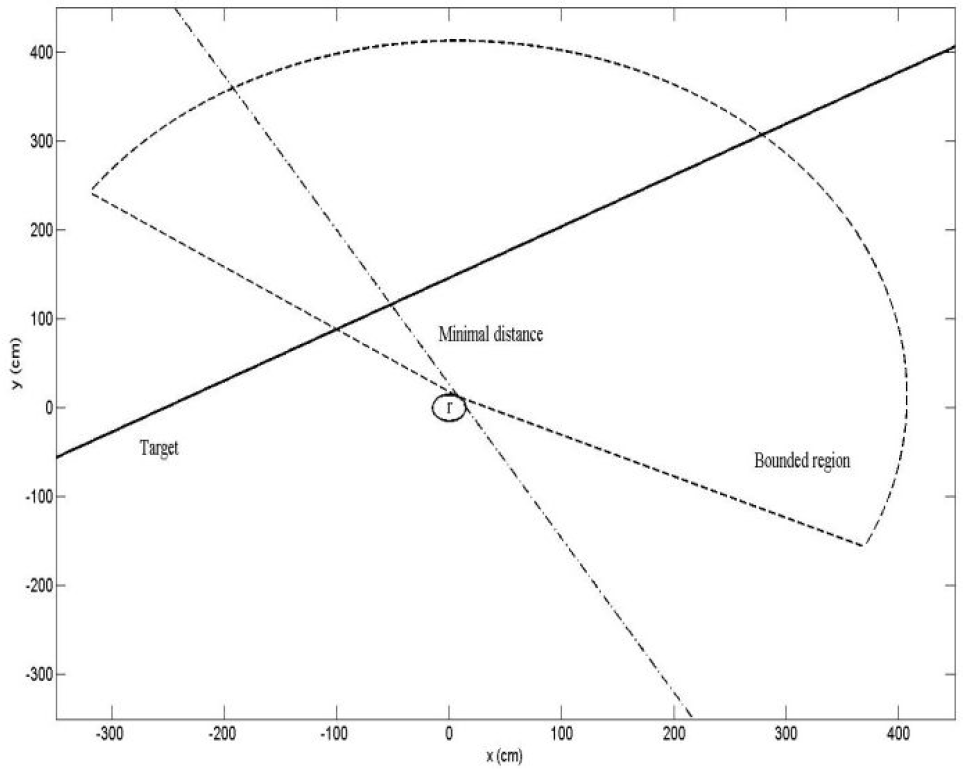
The bounded region for θ=60°, α=85°, β=30°, r=15 cm and k=400 cm (successful detection)

The bounded region for θ=0°, α=85°, β=30°, r=15 cm and k=400 cm (unsuccessful detection)
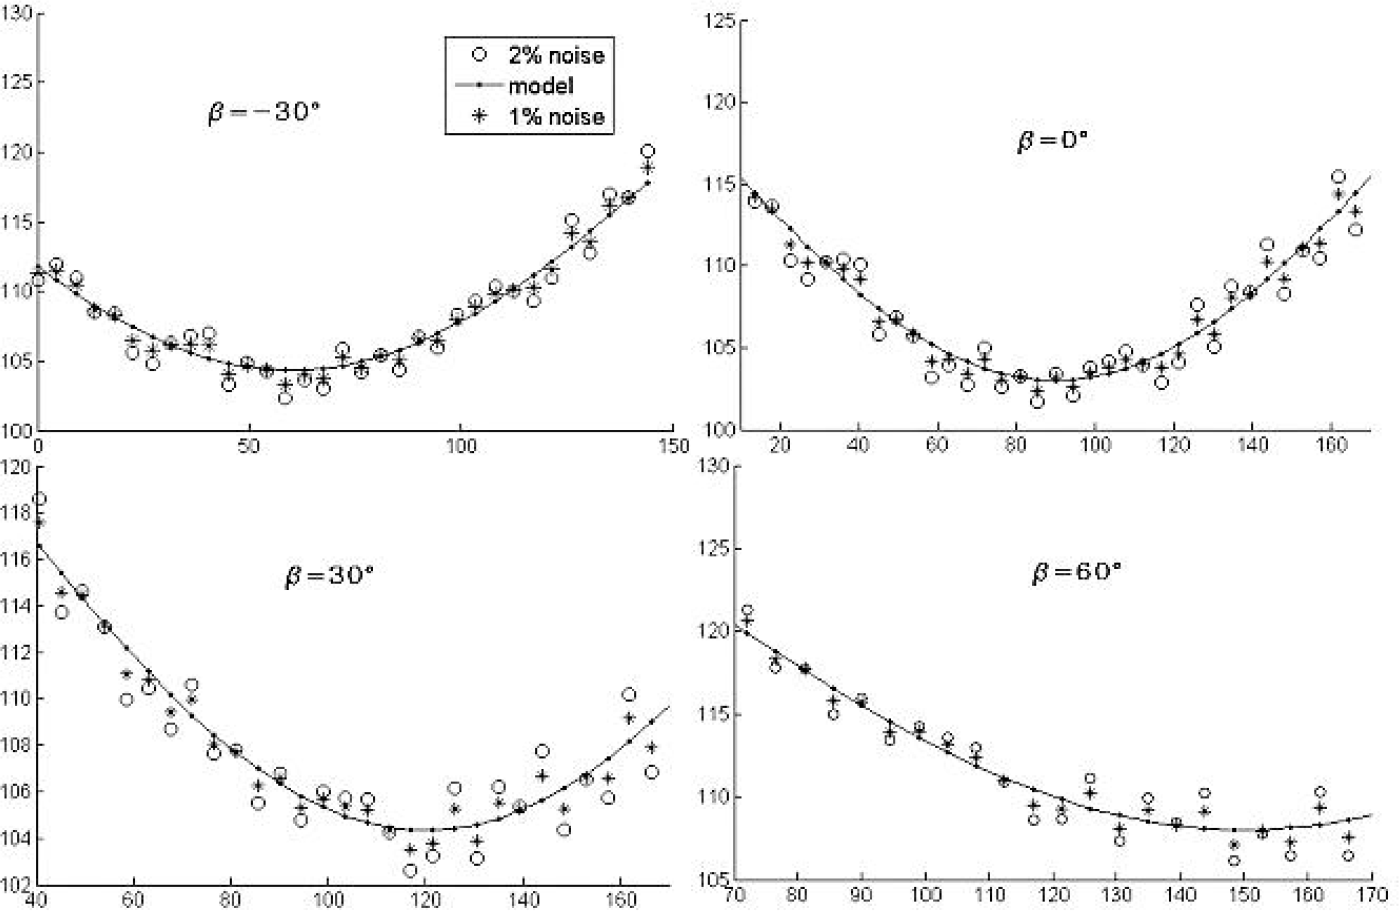
In order to compare the theoretical points with experimental ones, several tests were conducted by propagating ultrasonic waves towards a regular wall with the configuration of Figure 2 [8–9]. The tripod was located in front of the wall at a minimum distance sensor-wall d min =103 cm along the y-axis. The motor was programmed to take 40 steps in the angular interval [0°, 180°]. Different observer locations were shown in [9] by manually changing the sensor starting position and reading it on a goniometer placed on the tripod. The comparison plot between the experimental and the theoretical data for some tests is shown in Figure 5 (β=-30°, 0°, 30°, 60°) for the HG-M40DAI sensor (with α=85° for this sensor). The validated model may well predict the experimental result in all the cases and the estimated visibility angle α (α=85° for HG-M40DAI and α=22° for HG-M40DNI).

Comparison between the experimental and the theoretical data
4. Localization in a Corridor Environment
The validated model allows for testing the approaches for the detection of a regular wall, as well as evaluating the sensitivity in relation to the number of rotation steps. In [9], 17 different configurations were considered, so as to have β varying from −80° to 80° with differences of 10°. The distances concerned, with successful detections, are shown in Figure 6 for each motor position. In Figure 7, the theoretical distance values are compared with the distance values perturbed by means of a random additive noise. Two different levels of maximum noise were considered in order to have a perturbation of 1% and 2%, respectively.

Experimental distances measured in case of successful detection
Theoretical distances carried out by the model and perturbed distances by means of random noise
The data corrupted by 2% of maximum random noise better simulated the experimental conditions. Therefore, they were used for testing the proposed approaches at increasing the data set cardinality. Three methods have been tested, introduced and fully explained [9] for estimating the wall orientation; the first proposed approach is simply based on the Least Squares Method (LSM) for fitting the distance values calculated in each motor position, the second technique considers the centre of a Fitting Circumference (FC) for describing the circular arc resulting from a drawing, and the third innovative approach uses PCA. The three approaches were applied on the set of 17 different target configurations. The tripod was rotated so as to propose 17 different experiments with β varying in [-80°,80°] and with steps of 10°. The modular actuator was programmed to take 40 rotation steps (41 pointing directions) in each configuration, while the distance measurement was carried out in each rotation step. In Table 1, the experimental results of the LSM, PCA and FC are shown. It is important to consider that the expected slope angle (starting tripod rotation) was manually measured by a goniometer, introducing an error to the real position. The average absolute error μ of the absolute orientation error for all tests is shown in the last row of Table 1, which is quite low for all these techniques.
Experimental results of the three approaches with 41 pointing directions

For the aim of discussing and testing the three strategies, the simulated data have also been taken into account. By applying these strategies to the data without perturbing them, it is possible to correctly estimate β in all cases. The robustness of these approaches is analysed afterwards by introducing noise, as previously discussed. Table 2 shows the results when the imposed maximum error is 2% (the same error considered for the three simulations) with the same number of pointing directions (41) used in Table 1 for the experimental data.
Results of the three approaches with 41 pointing directions on the simulated data with 2% of maximum noise introduced
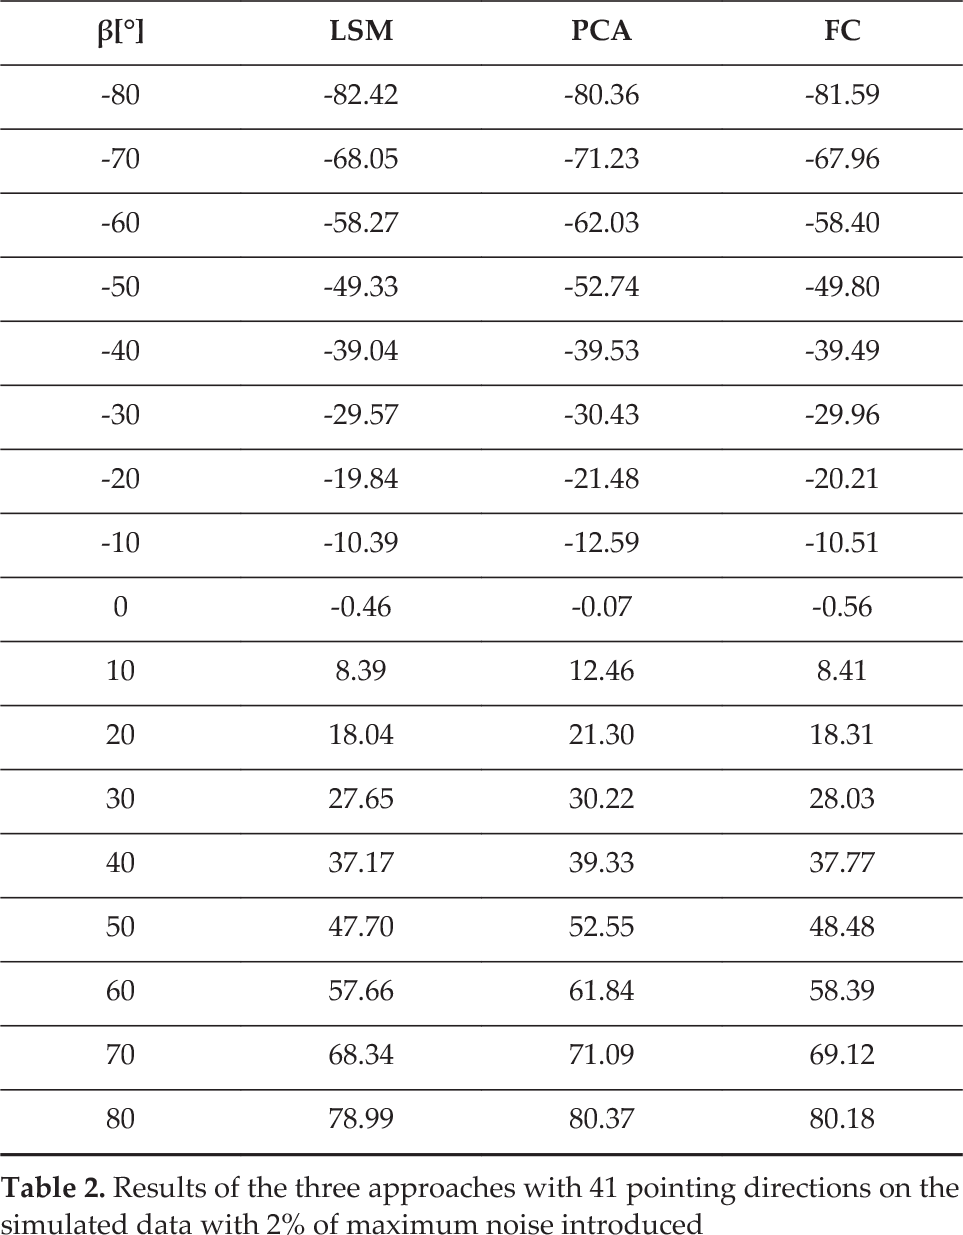
The methods are comparable and give good results for all the tests. The final results are quite similar to the experimental ones. For a low number of points (41), the LSM, PCA and FC approaches have similar behaviour. In order to evaluate the sensitivity with respect to the number of points in the same scanning range, other simulations were carried out by increasing the number of pointing directions from 41 to 60, 90, 120 and 180 [9]; these simulations show that the increase in the number of rotation steps does not entail substantial improvements for the LSM and FC approaches, which are the common strategies referred to in the literature. On the contrary, the PCA-based method converges to the correct values by increasing the number of points. This behaviour can be emphasized (Table 3 and Figure 8) by considering the average μ of the absolute orientation error as a unique parameter on all the considered configurations.
Average absolute error μ of the three approaches on the simulated data with 2% of maximum noise

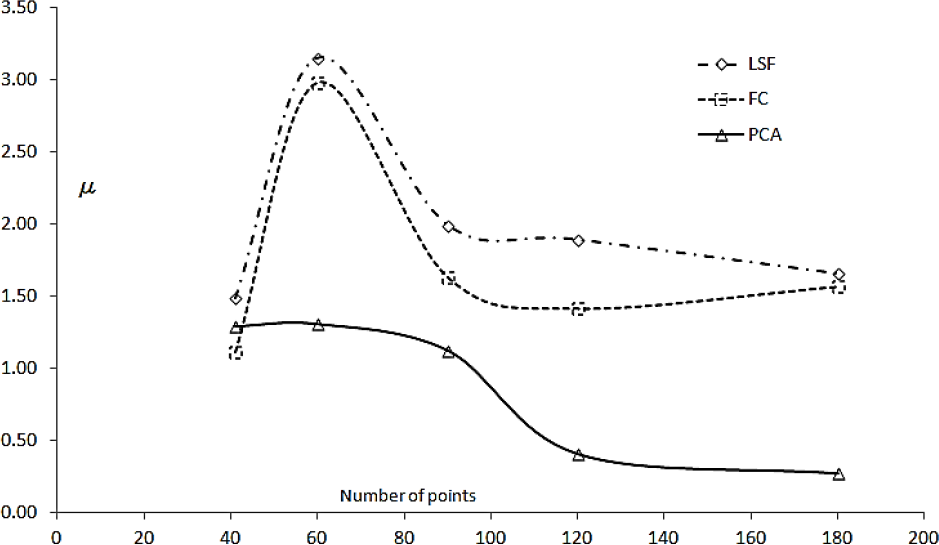
Average absolute error μ for the three approaches on the simulated data with 2% of maximum noise perturbation
The results confirm the applicability of the proposed methods by means of the rotating device, while the simulations predict that the experimental error may be significantly reduced by increasing the number of rotations in the measurement range when the PCA is computed. The final outcome can help to find a reasonable compromise between the estimation accuracy and the number of motor steps required.
5. Reconstruction of Panels Forming a Right Angle
The aim of accurately reconstructing two orthogonal planes by using ultrasonic sensors is very interesting in the context of industrial and robotic applications. For instance, fabrication processes often consist of joining together two parts by using welding robots [16–17]. Many experiments have been carried out, with three different strategies proposed by the authors.
All the experimental tests are carried out propagating ultrasonic waves towards an L-shaped structure. The L is built by a number of ply-wooden surfaces linked on a frame (Figure 9) to create a right angle. These panels are disposed of in such a way that two planes can be reconstructed: a plane orthogonal to the y-axis and a plane orthogonal to the z-axis, where the axes are oriented as indicated in Figure 1. When the rotating device is placed in front of the incident surfaces, it is able to scan them in each rotation step. Considering the preliminary reconstructed points in Figure 10, in addition to the problems occurring at the intersection for multiple reflections, it is evident that a certain curvature comes to the other points in comparison with the real planes. The main reason for this curvature resides in the incorrect hypothesis of direction of reflection corresponding to the pointing direction. Both the effects of multiple reflections and the direction of reflection have been analysed: in Figure 11 a projection on the rotation plane of the i th sensor is schematized, indicating three different significant positions θ (labelled 1,2,3). In positions 1 and 3, the interested directions are marked, whereas the multiple reflection effect is referred to position 2.

Target obstacle and professional tripod equipped with the realized scanner

Experimental points obtained without taking care of directivity and comparison with the real panels location

Reflection scheme in three significant conditions
Different tests have been carried out [4,5,7] but only one of them will be shown herein; it is referred to the configuration with the real plane orthogonal to the y-axis at a distance of 157 cm and the real plane orthogonal to the z-axis at a distance of 106 cm (distances from the origin of the reference system). The clockwise rotation range is [-10°, 110°] with 184 steps. The spurious TOF measurements in the intersection zone were analysed by introducing a parameter directly linked to the energy of the acquired waveform (details in [4,5,7]). Indicating, with ψiθ, the full waveform acquired by the i th sensor in the angular position θ and, with T, the acquisition period, the energy E iθ (expressed in V 2 s) of ψiθ is defined by (3).

For each angular position θ, a total energy level has been defined by (4) and plotted in Figure 12.

Energy level for all the positions

Three distinct peaks may be localized in the plot of Figure 12; two of them are referred to the positions where the direction of reflection corresponds to the pointing direction (θ=0° and θ=90°). The third peak is due to the multiple reflection effects, but its particularity is that, in contrast with the two other peaks, it is referred to very distant points. This consideration is on the basis of the first strategy introduced in the following paragraphs.
5.1. A Strategy Based on FCM and RANSAC [4–6]
The introduction of the physical indicator, based on the wave energy suggested, automatically left out all distance values, which are misrepresented for the effect of the multiple reflections. A FCM classification method is used for partitioning a data set in three different clusters: two clusters referred to a valid data subset and an undesired cluster. The cloud of points is given to the FCM function for partitioning it. Such is the partition that one of the three clusters contains all corrupted distance values, which is individualized by the point having the critical angular position and the maximum distance in that position as coordinates. The two remaining clusters are necessary to reconstruct the obstacle. The application of FCM, for the experimental data of the considered test, gives the results shown in Figure 13: the clusters are plotted in an opportune reference system (details in [5]), their centres are indicated as circle points and the critical point is indicated by a star point.

3D clusters partitioned by FCM
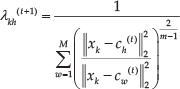
The FCM-clustering algorithm is based on the minimization of the weighted distances between the points and the cluster centres through the iterative optimization of an objective function. The cloud of N points (θ, d iθ , R), where N is equal to four times the total number of steps and θ is the indexed goal position, R is the ratio between the energy level, and the theoretical expected energy (as detailed in [4]) is given to the FCM function for partitioning it. Such is the partition that one of the three clusters contains all corrupted distance values, which is individualized by the point having the critical angular position and the maximum distance in that position as coordinates. The two remaining clusters are necessary to reconstruct the obstacle. A random matrix Λ(0) of N rows and M=3 columns, for which generic element λ kh (0) is initialized so as to satisfy the condition (5). Λ(0) is called the membership matrix at iteration 0. The membership matrix is updated at each iteration of the algorithm; Λ(t) denotes the membership matrix at the t th iteration and expresses the membership degree of the point x k at the cluster h.

The centre c h (t) of the cluster h at the t th iteration is calculated by (6), where m is the fuzziness coefficient.

The value of the objective function at the iteration t th is given by (7), where || • ||2 is the Euclidean norm.

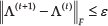
The membership matrix elements are updated using (8) and the cycle stops when the condition (9) is satisfied, where || • ||F is the Frobenius norm and ε is the error threshold.
The excluded cluster is painted in dark green in Figure 13, whereas the other clusters are painted in red and cyan.
All remaining polar points are then mapped in the Cartesian reference system (Figure 14) and separately sent to the RANSAC function [18]. RANSAC fits a plane using a restricted range of useful points (inliers). The reconstructed planes are compared with the real ones in Figure 15 for the considered test.

Points obtained after clustering compared to the real panels location

Planes reconstructed by RANSAC (painted in grey) compared with the real planes (painted in red)
The proposed approach has been tested in many experimental cases, verifying its effectiveness. It has been observed that the reconstruction validity is linked to the sensor array localization; e.g., if the sensors are much closer to one plane than to the other one, it is possible that a set of useful data is not collected for the more distant plane because of the large resulting beam propagation [4–5]. Another important aspect consists of evaluating the eventual variation of the full waveform energy when the target surfaces are made of different material. Given this proposal, some tests have been carried out successfully by covering the wooden surfaces with silver foils [6]. Every panel has been papered, while all the foils have been pressed in order to avoid the scattering of sound (Figure 16).

Surfaces of the target obstacle covered by silver foils
5.2. A Strategy Based on the Least Entropy-Like (LEL) Method [10]
The reconstruction of the planes has been pursued by a strategy based on the LEL estimator [10]; this local estimator [19] minimizes the relative squared residuals defining the entropy-like function H, which is numerically minimized using a Nelder-Mead algorithm. Following the analysis and suggestions reported in [19], the numerical minimization of the LEL cost is performed for the ultrasonic experimental data (details in [10]). The result of such a strategy for the same experimental condition, considered in the previous paragraph, is depicted in Figure 17.

Planes reconstructed by LEL strategy (painted in green and pink) compared with the real planes (painted in yellow)
A further improvement to the strategy [10] has been obtained by removing the data referred to the higher error values from the original sets, so as to improve the accuracy of the LEL fit. Given this proposal, a threshold equal to 10% of the maximum error value has been imposed in order to leave out the data points associated with greater errors. After filtering, a further application of the LEL strategy allows for estimating the surfaces, as plotted in Figure 18.

Planes reconstructed by LEL strategy (painted in green and pink) compared with the real planes (painted in yellow) with a pre-filtering of the data
Pre-filtering improves the final reconstructions. The reconstructed surfaces in Figure 18 almost overlap the real scanned ones.
A further comparison of the performance of this strategy is carried out by analysing the results of the approach referred to in paragraph 5.1 when applied to the same experimental data. Although the use of FCM and RANSAC algorithms leads to a more accurate reconstruction of the surfaces, it is noteworthy that the entropy method returns appreciable results and is computationally less complex.
5.3. A Strategy Based on FCM and PCA [7–8]
The aim of reconstructing orthogonal planes by using the ultrasonic data, after excluding the outliers, has been pursued by introducing another strategy based on PCA, as fully described in [7,8] for several tests.
A new energy-based indicator, which takes into account the effect of the distance, is used [7–8] to automatically select the peak concerned with the critical position. The indicator values are plotted in Figure 19 for the test under consideration here. This new indicator of the critical position proved [7–8] to be better than the previous indicator used in paragraph 5.1. The covariance matrix permits us to compute the PCA with a view to excluding the eventual outliers from each set and obtaining useful information on the orientation of the planes. The PCA consists of an orthogonal transformation in order to analyse the data, which is frequently used in a computer vision for image compression.

Indicator of critical position
The possibility of estimating the critical angular position led the authors to use it in order to exclude the misrepresented distances stemming from multiple reflections. The aim of partitioning the cloud of points is achieved by means of FCM clustering. In this way, the original set is filtered and the spurious distance values are removed. The clusters of the considered test are plotted with different colours, as depicted in Figure 20. The excluded cluster is the red one containing the point, which is concerned with the critical position (illustrated as a black point).

Clusters partitioned by the FCM algorithm
The blue and green clusters may be used to define two sets of three-dimensional points in the reference system of Figure 1 with the same procedure shown in Figure 11. The exclusion of the data points, which are further away from the mean, helps us to pursue the aim of a robust estimation. The inliers are defined as all points contained in the ellipsoid, which are calculated as expressed in [7–8].
The data points and the two confidence ellipsoids, which were obtained for the test, are represented in Figure 21, while the points, which are inside the closed surfaces, are plotted in Figure 22. This reduced data set allows us to calculate a matrix whose smallest eigenvalue is associated with a characteristic vector with a direction that is normal to the fitting plane. Therefore, the aim of drawing the planes was soon reached.
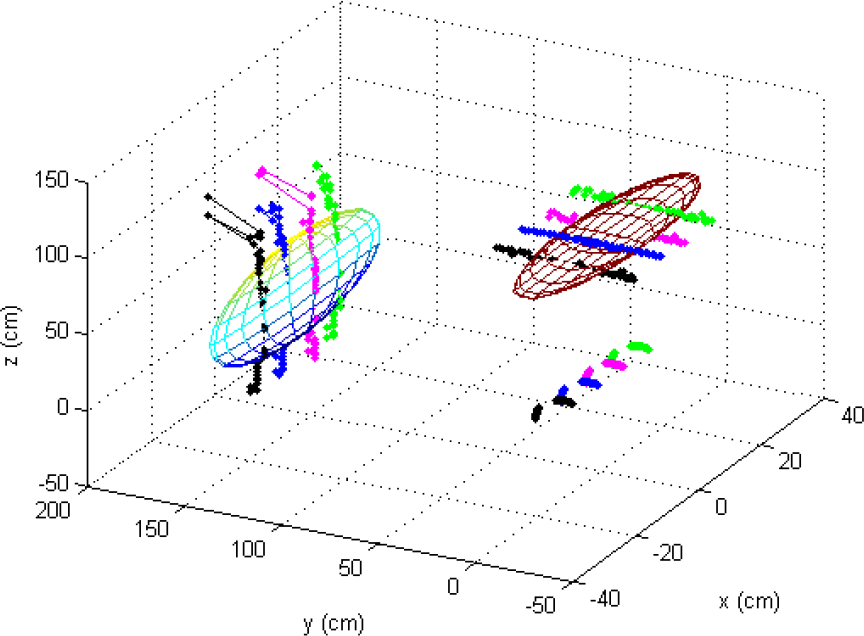
Sets of three-dimensional points and ellipsoids for the test
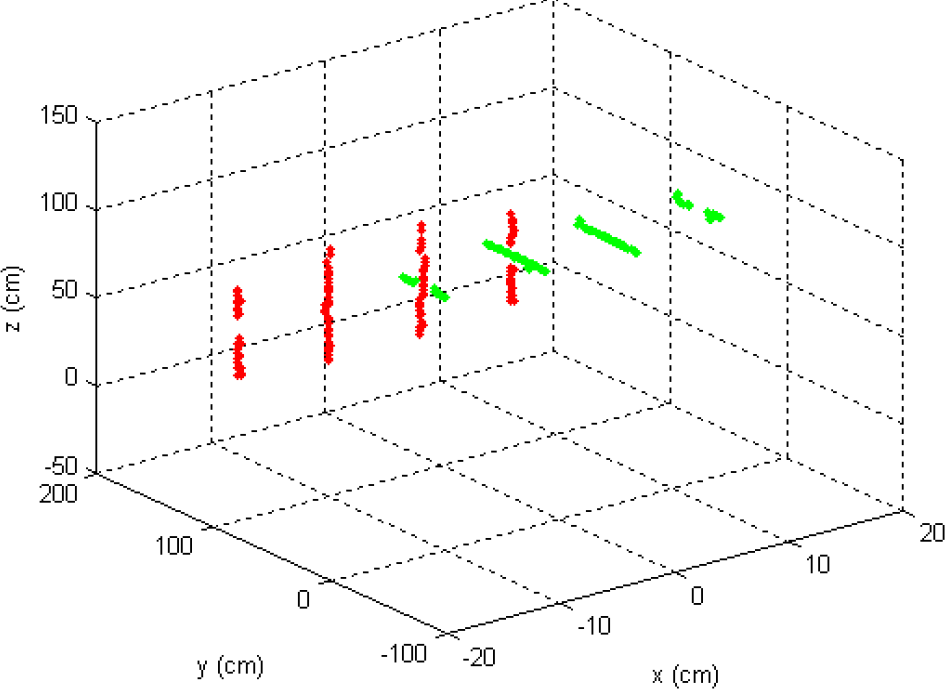
Points contained in the ellipsoids
Using PCA allows us to achieve the very accurate reconstructions, illustrated in Figure 23, for the considered test. The fit planes, depicted as coloured full surfaces, are compared with the expected ones, which are depicted by mesh.

Planes reconstructed by the PCA and comparison with the real locations for the first test
Both RANSAC (shown in paragraph 5.1) and PCA may be used to produce results, which match the set of observations very well.
6. Reconstruction of the Environment Room [11]
The strategy in paragraph 5.3 has been generalized and tested with experimental tests carried out in a real laboratory environment without removing any obstacle interposed between the scanner and the target surfaces (such as chairs, desks and other undesired items).
The explored room environment and the tripod, equipped with the scanner, are shown in Figure 24, where the yz reference is represented. The partition walls are normal to the y-direction and the ceiling is normal to the z-direction. The motor starts scanning the partition wall, which is located in the positive side of the y-axis at a minimum distance d 1 from the origin of the considered reference system. The ceiling is the middle wall, with a minimum distance d 2 from the same point. Finally, the last scanned wall is the other partition wall located in the negative side of the y-axis at a minimum distance d 3 from the origin. The real plane equations are y=d 1 for the first scanned partition wall, z=d 2 for the ceiling, and y=-d 3 for the last partition wall. The digital motor was programmed to make a step-by-step rotation with a significant number of steps, in such a way as to approximately describe a straight angle. In [11], several configurations have been considered and discussed; one set of results is reported here.

The explored room environment

Clusters partitioned by the FCM algorithm
In order to automatically exclude spurious distance measurements related to the reflections from non-target objects, the energy- and distance-based indicator (as in paragraph 5.3) was permitted to depict a cloud of points that was partitioned by the FCM algorithm in five clusters. Two of the five sets (misrepresented information) contained erroneous distances as a consequence of second-order reflections, which were automatically left out by means of the indicator with the same procedure as explained in the previous paragraph.
After clustering and filtering, the remaining clusters allowed for plotting the sets of three-dimensional points concerning each surface. In order to exclude further outliers, the covariance matrix of each set was calculated by PCA. The variance along the principal coordinates was analysed to determine an ellipsoid and contain all the inliers in it. Finally, the eigenvalues and related eigenvectors of the new covariance matrix of each filtered set allowed for the normal vector to each surface to be obtained. The room was reconstructed by joining three planes, whose equations were calculated by ensuring that each surface passed through the mean point of each set.
The exclusion of the data points, which are further away from the mean, allows for the aim of a robust estimation to be pursued. For the sake of appreciating the robustness of this approach, the data points and the three confidence ellipsoids are represented in Figure 26, while the data points, which are contained in the ellipsoids, are plotted in the Figure 27.

Sets of three-dimensional points and ellipsoids for the test
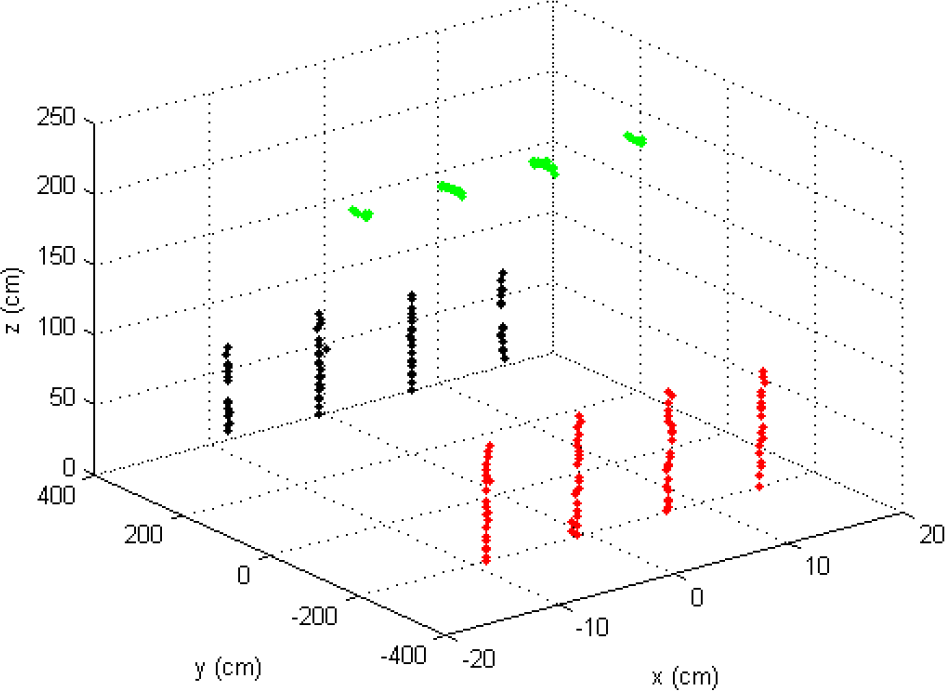
Points contained in the ellipsoids
The computation of the covariance matrices allows for very good reconstructions to be obtained (i.e., the reconstruction in Figure 28) for all the considered configurations [11]. The fit planes are represented by coloured full surfaces and compared with the expected planes, which are depicted by a mesh.

The reconstructed walls by PCA and comparison with real locations
The final outcome is very satisfactory: the proposed FCM- and PCA-based strategy means that the benefit of statistical considerations can be taken into account, which lets the user define the appropriate values for the reliability factors that depend on the characteristics of the scanned environment.
The proposed strategy demonstrates a good robustness if the considered environment is not structured as occurs in most mobile robotic applications.
7. Conclusion
This paper has offered an overview of recent studies with which the authors have been involved. Several strategies have been introduced for the use of ultrasonic sensors in recognition and reconstruction of obstacles, such as walls of corridor, planes and room surfaces, with possible applications in industrial and robotic fields. A device, opportunely realized for moving an array of ultrasonic sensors in a controlled way, has been used for experimental verification and testing a validated model on ultrasound reflection.
The possibility of obtaining a valid estimation of a wall inclination in corridor environments is useful for the autonomous navigation of mobile robots endowed with ultrasonic sensor rings. This permits strategies of path-planning, such as wall-following, to be performed. In order to solve this problem, three innovative methods have been introduced and discussed, in order to define their accuracy.
Another problem tackled in recent years is related to the effect of multiple reflections, which occur from two surfaces because of a corner. This causes erroneous distance measurements, making it the detection of the real obstacle structure more difficult. Such difficulty has been surpassed by looking at the energy level of ultrasonic reflected signals. In fact, an increase in the signal energy level has been observed when the ultrasonic waves returned back from the corner owing to the capture of more echoes.
The application of a clustering technique has permitted the elimination of spurious data identified through the energy based on analysis.
With the aim of obtaining desired reconstructions, some robust reconstruction techniques have been implemented: the RANSAC, the LEL (a technique based on a function inspired by entropy) and a technique based on PCA. Both RANSAC and PCA are applied after filtering by means of FCM, whereas the LEL may also be used with raw data, reducing the required time for processing in spite of lower accuracy; this method seems to be indicated in a robotic application where the computational time is a crucial factor. The two other methods (RANSAC and PCA) need a higher computational time, but they may guarantee more accurate results, as shown in this paper. For this reason, they seem to be more suitable in industrial applications, in which high precision and accuracy are generally required, such as in a robotic welding process.
When the ultrasonic scanner is used for reconstructing environments, where sound diffracts because of undesired objects, a new indicator allows for the automatic reconstruction of the three room walls. The final reconstructions are obtained by PCA and, as they are very satisfactory, they encourage further developments.
Nowadays, the sound propagation for solving localization and reconstruction problems is a field of scientific research that has yet to be addressed. The proposed algorithms and the obtained results show the potentiality of sound-based approaches, as well as motivate future research activities for industrial and robotic applications. The authors encourage the use of ultrasonic sensors because these systems are essential in cases of low visibility or environments surrounded by mirrors, transparent surfaces or light-absorbing obstacles in which lasers often fail. The future aim is to equip a robot with the ultrasonic sensors in order to evaluate the use of all the methods presented here by improving the robotic perception in situations where other sensors fail.