
Abstract
This paper describes the development of an aerial system applied for the terrain mapping and geo-detection of explosive landmine-like objects. In practice in Colombia, a large percentage of the anti-personnel mines that still remain across the country are hand-crafted and partially exposed on the terrain's surface so that they can be triggered. This scenario facilitates the use of a vision-based approach for the detection of these artifacts. Our goal is to integrate computer vision algorithms within a low-cost UAV robot suited for the Colombian scenario. The aerial system enables: (i) terrain mapping based on a visual stitching method to generate a mosaic image of the covered terrain, and (ii) the visual detection of landmine-like objects in real-time. Despite the hardware drawbacks and the camera limitations of the used UAV, we demonstrate that our low-cost platform could be used as a complementary tool for demining missions in Colombia. After briefly reviewing the state of the art regarding the use of robots for mine clearance, we present a field report that confirms the feasibility of our aerial-based system featuring in approximate scenarios.
Introduction
Anti-personnel mines are explosive artefacts originally designed to destroy military targets. Both civilians and the military are daily affected worldwide. Since 1999, more than 90,000 people have been murdered or harmed by these devices, and around 10 people are harmed each day by the explosive blast or flying fragments emitted by the explosion. Colombia is currently one of the most mine-affected countries in the world. Since 1990, the Colombian government has registered 10,751 victims: 39% corresponding to civilians and 61% to the military. According to government statistics, there are more than 3.6 million registered IDPs (internally displaced persons) in Colombia, i.e., civilians that have to migrate from rural to urban areas. In most of cases, landmine contamination prevents the return of IDPs to their land, affecting not only the well-being of these people but also the agricultural productivity of the country, increasing social unrest in the largest cities. Colombia's new victims' law aims to compensate the victims of the Colombian conflict and lays out plans to return 3,000,000ha of land to those who have been displaced by the conflict. Although the conflict in Colombia is ongoing, the post-conflict era has left many regions in the country with over 10,000 potentially hazardous areas that require urgent mine clearance.
The procedure of anti-personnel mine (landmine) detection and removal is referred to as ‘mine-clearance’ or ‘demining’. Commonly, the basic mechanism of a landmine structure consists of a detonator, a firing mechanism, an explosive charge and metal or plastic housing. These artefacts are mainly classified into two groups: anti-personnel (AP) and anti-tank (AT) landmines [6]. AP landmines are small and light whereas AT landmines are larger and require about 100 kg-f of pressure to be triggered. In this article, we present the key role that robotics has been playing by designing autonomous machines for demining AP landmines. There are three different approaches to tackling landmine detection and deactivation using complementary tools: (i) tools directly operated by human operators (e.g., metal detectors, sniffer animals, manual prodders and chemical sensors), (ii) vehicles used for deactivating mines based on controlled detonations, and (iii) unmanned vehicles able to detect and deactivate landmines. Unfortunately, in Colombia, the former approach still remains the most widely used method by the military. Figure 1 shows the different tools used for demining.

Heavy equipment used for landmine removal
In recent years, unmanned vehicles have been improved with a wide variety of sensing hardware: ground penetrating radars (GPRs), chemical sensors, multi-spectral and thermal cameras, among others. In this regard, wheeled and legged vehicles have sufficient payload capacity to carry heavier and larger equipment that normally requires highly computationally costly resources [5], whereas aerial vehicles have appeared as a new approach for demining thanks to the miniaturization of sensing power and processing electronics.
This section presents the related field-work on the use of robotics as applied for demining. Firstly, we review and highlight some of the advantages and drawbacks of the most commonly used terrestrial and aerial robot mechanisms, and secondly we present some approaches for landmine detection.
Unmanned land vehicles for landmine detection
Accurate navigation over rough terrains is perhaps the major challenge for land-based vehicles. For demining, navigation control is crucial in enabling safer terrain mapping and accurate reconnaissance. Different mechanisms, such as wheeled, legged and dragged robots have been proposed to overcome this issue [28]. Within the wheeled robot category, the Irish company Kentree manufactures a six-wheel mobile robot named HOBO [4]. The robot has an arm-manipulator capable of lifting payloads up to 75kg and uses an onboard camera for sensing the environment. The robot has a mass of 228kg and moves with a maximum velocity of 4km/h. This robot is mainly used for excavation and landmine removal [21, 2], two important tasks in demining. However, the robot is too heavy and too slow for covering larger areas. Another example of a wheeled robot used for demining is the Gryphon [3]. This robot is able to detect buried landmines using a metal detector and a GPR antenna. One of the first legged robots used for demining was the COMET series [1]. This robot has two arm-manipulators onboard: one for mine detection using a radar and the other for grass cutting. The robot is able to cover an area of 300m2 per hour autonomously. It uses a hierarchical neural network (HNN) controller, allowing autonomous obstacle avoidance and walking control. The total mass of the robot is 900Kg with a length of 4m. Other platforms, such as the Titan-IX [12] and the SITO6 [9], demonstrate that legged robots are able to navigate more precisely over rough terrains than wheeled robots. Nonetheless, both wheeled and legged mechanisms are simply too expensive and heavy to be used within the Colombian context, where the military must transport tons of equipment to difficult access locations.

UAV applications for landmine detection
The use of unmanned aerial vehicles (UAVs) is clearly suited to covering a minefield without the risk of triggering landmines during the mission. However, the weight and size of the sensing systems used for demining are unlikely to be placed on UAVs due to their poor payload capacity. In [13], the authors propose the fabrication of a small, multi-frequency GPR on board a UAV quadrotor able to lift up to 1.1Kg in payload (see Fig. 2a). The GPR was designed to be a multi-band reconfigurable antenna able to switch among a range of radiating frequencies within 0.5–5GHz with a bandwidth of 350MHz to 5GHz. Although the results were acquired in lab experiments with the GPR off-board the UAV, the designed GPR was able to characterize buried landmines with different shapes and depths, mainly in dry terrain. However, for wet soil, most of the emitted high-frequency signal from the GPR was reflected back and almost none of it was able to penetrate deep inside the wet material. The tropical climate of Colombia is characterized by presenting huge variations, depending on the altitude, temperature and humidity of the area in question. Landmines in Colombia are mostly located in mountainous regions with daily precipitation (rainfall). High-frequency GPR sensors do not properly work on extremely wet soil.

General description of the system. The AR Drone 2.0 quadrotor is wirelessly connected with the base station. The modules of the base station are ROS-based packages coded in C++.
Thus far, biological sensors used by animals (e.g., dogs and rats) provide the highest degree of accuracy in terms of landmine detection; (unfortunately, manual demining using trained animals is still one of the most commonly used methods for detection). In [17], a blimp-based chemo-sensing UAV is proposed (see Fig. 2b). The authors developed a bio-inspired detection architecture composed of six-grid array films responding to a wide range of volatile organic compounds. The system creates a map of the terrain with the information provided by the chemo-sensor. The advantage of this chemo-sensor technology lies in its small size; however, the sensitivity can only go up to few particles per million (ppm), which might not be enough for detecting explosive particles such as TNT or DNT.
In [27], an airborne LIDAR system integrated with a laser scanner, GPS and an inertial measurement unit (IMU) is proposed. The system is able to detect TNT and DNT using sensitive biosensors based on the soil bacterium Pseudomonas putida. By reflecting a green laser light at a wavelength of 532nm over the explosives, they emit a red fluorescent light. In this regard, multi-spectral cameras can be used for capturing the traces of fluorescent light. So far, the lightest multi-spectral cameras commercially available, such as the Tetracam ADC micro 1 , are able to capture visible light wavelengths longer than 520nm and near-infrared wavelengths up to 920nm. They might be an interesting choice for landmine detection.
We propose the use of an affordable aerial system with the following sensors onboard: a CMOS camera, GPS and an IMU. Our goal is to use an artificial vision-based approach for detecting partially buried landmine-like objects and creating a geo-referenced map of the terrain with the GPS location of the landmines. Figure 3 shows a general description of our system:
Communication driver: uses an open-source ROS-based driver called Ardrone autonomy [15] to enable the wireless transmission of navigation, sensor and control data between the AR.Drone and the base station.
Navigation: handles the flight control. It provides both camera and IMU data to the visual mosaic module. It uses an open source ROS-based package called Tum_ardrone [31].
Visual mosaic: builds a panoramic image by combining multiple photographic images captured by the robot's camera. It generates a map of the covered terrain. It uses an ROS-based package developed by the authors called stitching_panoramic.
Detection algorithm: detects partially buried landmine-like objects in real-time using image recognition methods. It uses a former ROS-based package called drone_detection, which was developed in previous work [19, 22].
GPS data: enables the geo-location of the detected landmines based on GPS information processed by the dron_GPS ROS-based package.
The robot operating system (ROS) is an orientated, widely-used framework for robotics applications. The aforementioned packages were written in C++ using the OpenCV library and the Qt4 user interface development framework. In this article, we extend the functionality of the drone_detection package by introducing two other ROS packages: drone_GPS and stitching_panoramic. The former allows for the geo-location of detected landmine-like objects, whereas the latter generates a map of the terrain by applying mosaicing techniques with the images captured by the quadrotor during flight. It is worth mentioning that this project is open source under the GNU GPL v3 license and that it can be downloaded at: https://code.google.com/p/uav-detection/
The low-cost quadrotor-based UAV
The selected platform is the AR.Drone 2.0, a low-cost quadrotor equipped with a 1GHz 32-bit ARM Cortex A8 processor running at 800MHz, an IMU with a three-axis gyroscope/accelerometer, an ultrasound sensor for measuring altitude, a three-axis magnetometer with 6 o precision, a pressure sensor with ±10Pa precision, and two cameras (one aims at the ground). The bottom camera has a field of view of 47.5 o with a resolution of 320×240 pixels at 60fps. Despite the hardware and onboard processing limitations of this robot, the AR.Drone 2.0 has been used in several research projects in control [10], autonomous navigation [7], image processing [14] and swarm robotics, due to its low cost and robust mainframe. In this project, we installed a commercial GPS sensor onboard the AR.Drone quadrotor called Flight Recorder. Besides the GPS receiver, the device has 4 Gb of USB flash memory. Section 3 details the geo-location feature.
Geo-location and image mosaicing methods
In order to geo-locate the identified landmine targets within an image (a geodesic position), we calculated the odometry between consecutive images by using the IMU data [20]. Once the landmine is geo-located, we create a map of the terrain by computing an image mosaic.
Image mosaicing is a process for building a panoramic image that results from combining multiple photographic images. To achieve an accurate match between the frames, one might apply an alignment method. There are two methods for the alignment and fusion of images: (i) direct and (ii) feature-based. The direct method iteratively estimates the camera parameters by minimizing an error function, which depends on the intensity difference in the overlapping region of the images [30]. In contrast, feature-based methods do not need initialization, are more robust against image movements, and can be used for the detection of objects that are widely separated. In this work, we investigated existing methods for feature-matching [25, 35, 16], blur-object removal due to the motion of the camera [32, 11], and also how to deal with different image exposures [8].
As mentioned, the creation of a panorama photo is the result of combining individual images. That process is also known as ‘stitching’. This approach requires nearly exact overlaps between images and similar exposures to produce a seamless result. Basically, three procedures must be applied to the image: registration, calibration and blending. To properly apply these procedures, one must first calculate the homography matrix of the image and a camera calibration matrix aimed at correcting image distortion by transforming the image into a standard coordinate system (image rectification). When the images are captured from a UAV, the inherent motion of the camera causes errors during the calculation of the transformation model. Approaches to solve this issue are based on improving the abstractions of a sparse set of features [24, 26], e.g, Jyun et al, [18] implemented a dominant image selection method to reduce the motion parallax region, Yahyanejad et al, while [33] derived a geometric transformation using the location and orientation data of the camera and also incorporated depth map information within the image stitching algorithm to improve on the feature extraction, geometric distortion correction and projection selection.
Outline
This article is organized as follows: Section 2 briefly describes the visual approach for landmine-like object detection based on prior work [19, 22]. Section 3 introduces the method for visual stitching using the low-resolution camera of the AR.Drone quadrotor. Section 4 presents simulation scenarios that were developed for the preliminary testing of the system, whereas Section 5 concludes with a field report of our system deployed for different scenarios.
Landmine detection and geo-location
Vision algorithms are used to analyse the images and to determine whether a landmine has been found. The searching procedure is developed by analysing the content of the images obtained from the bottom camera of the UAV. The developed algorithms to perform the landmine detection task are included in the ROS package drone detection [19, 22]. The detection procedure is divided into niose filtering, feature extraction and image classification.

A flowchart describing: image pre-processing, registration and blending
Noise filtering
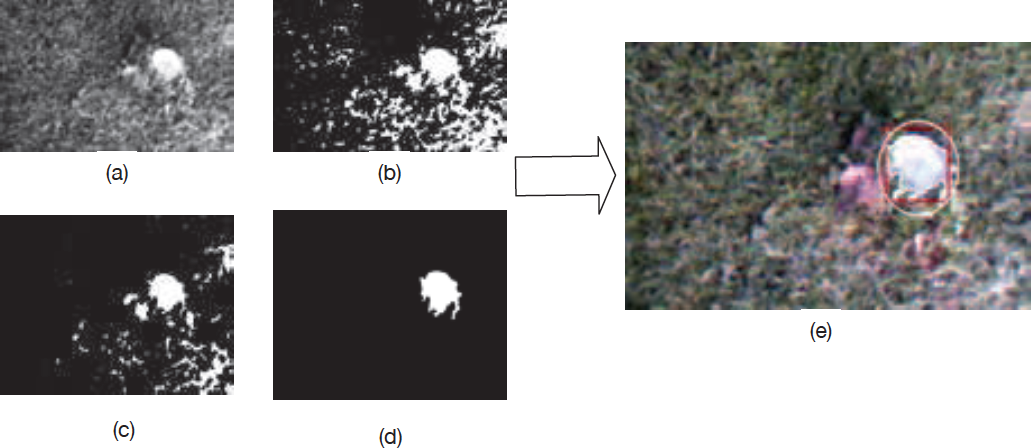
The noise filtering process implements classical vision algorithms to eliminate the noise of the image, such as morphological and noise filtering operations. The first step consists of transforming the obtained image from the RGB scale to greyscale to perform binarization operations. The filtering process involves several methods for removing those image-objects that do not match a landmine. Firstly, the erosion function is used to delete the little noise pixels of the images. Secondly, a specially designed function is used to eliminate those medium objects of the image. The object elimination criterion is based on a pre-defined pixel-size threshold. The last step is to recover the removed fragments of the landmines once the erosion function has been applied. Figures 4a-b depict the transformation process of the image to the greyscale and binary space. Figure 4c details the resultant image after applying the erosion function. The output image is then shown in Fig. 4d.
Feature extraction and image classification
The feature extraction involves two methods for obtaining enough information from the image and to determine whether the detected object in the image is a landmine. The selected properties of the images are related with pixel-features. Firstly, the size of the detected object is calculated by counting the number of white pixels in the binarized-image. Secondly, the number of pixels contained within a define percentage of intensity in each layer of the RGB scale of the image is calculated. The image classification conditions are defined by the error measurements calculated with the features extracted and the original features from a comparison template. Figure 4e shows the final image after applying the noise filtering and image classification process.
Geo-location of targets
The geodesic coordinates of the detected landmines are obtained using the flight recorder module, which comprises a GPS receiver and 4 GB of USB flash memory. The GPS has an accuracy of ±2m with a data-link rate of 5Hz. Because the AR.Drone quadrotor comes without onboard GPS, we developed an ROS-based package called drone_GPS 2 . This enables us to transform geodesic coordinates captured by the GPS into universal transverse mercator (UTM) coordinates for positioning the robot on earth.
In previous work [22], we explained the main software components of our proposed ROS package for visual landmine detection called drone_detection. Here, we extended this package by adding image mosaicing support. This new feature creates a map of the covered terrain based on the images captured by the robot. The package, called stitching_panoramic 3 , runs a stitching algorithm that uses navigation data provided by the IMU, camera location and orientation, to create an image mosaic. The procedure has two steps: i) image registration and ii) panorama composition. The former allows for selecting and aligning the images, whereas the latter enables us to construct the final panoramic image by analysing the features and exposure information. Figure 5 describes the flowchart of the proposed stitching algorithm, which mainly consists of: image acquisition and pre-processing registration and blending.
Image acquisition and pre-processing
The images captured by the bottom camera of the AR-Drone have a poor resolution of 320 × 240 pixels. That limitation causes several issues regarding the feature extraction, matching and image warping. To address this problem, we used the unsharp mask technique, which improves on image sharpness by increasing the contrast based on comparing the original image with a high-pass image, as described in (1),
where ³ is the original image, λ is a scale factor that controls the contrast level and HΣ(³) is the filtered image that is obtained by applying Gaussian blur to the original image. Mathematically, applying Gaussian blur to an image is equivalent to convolving the image with a Gaussian function. This process works as a low-pass filter that not only reduces image noise but also enhances the image structures at different scales.
Registration
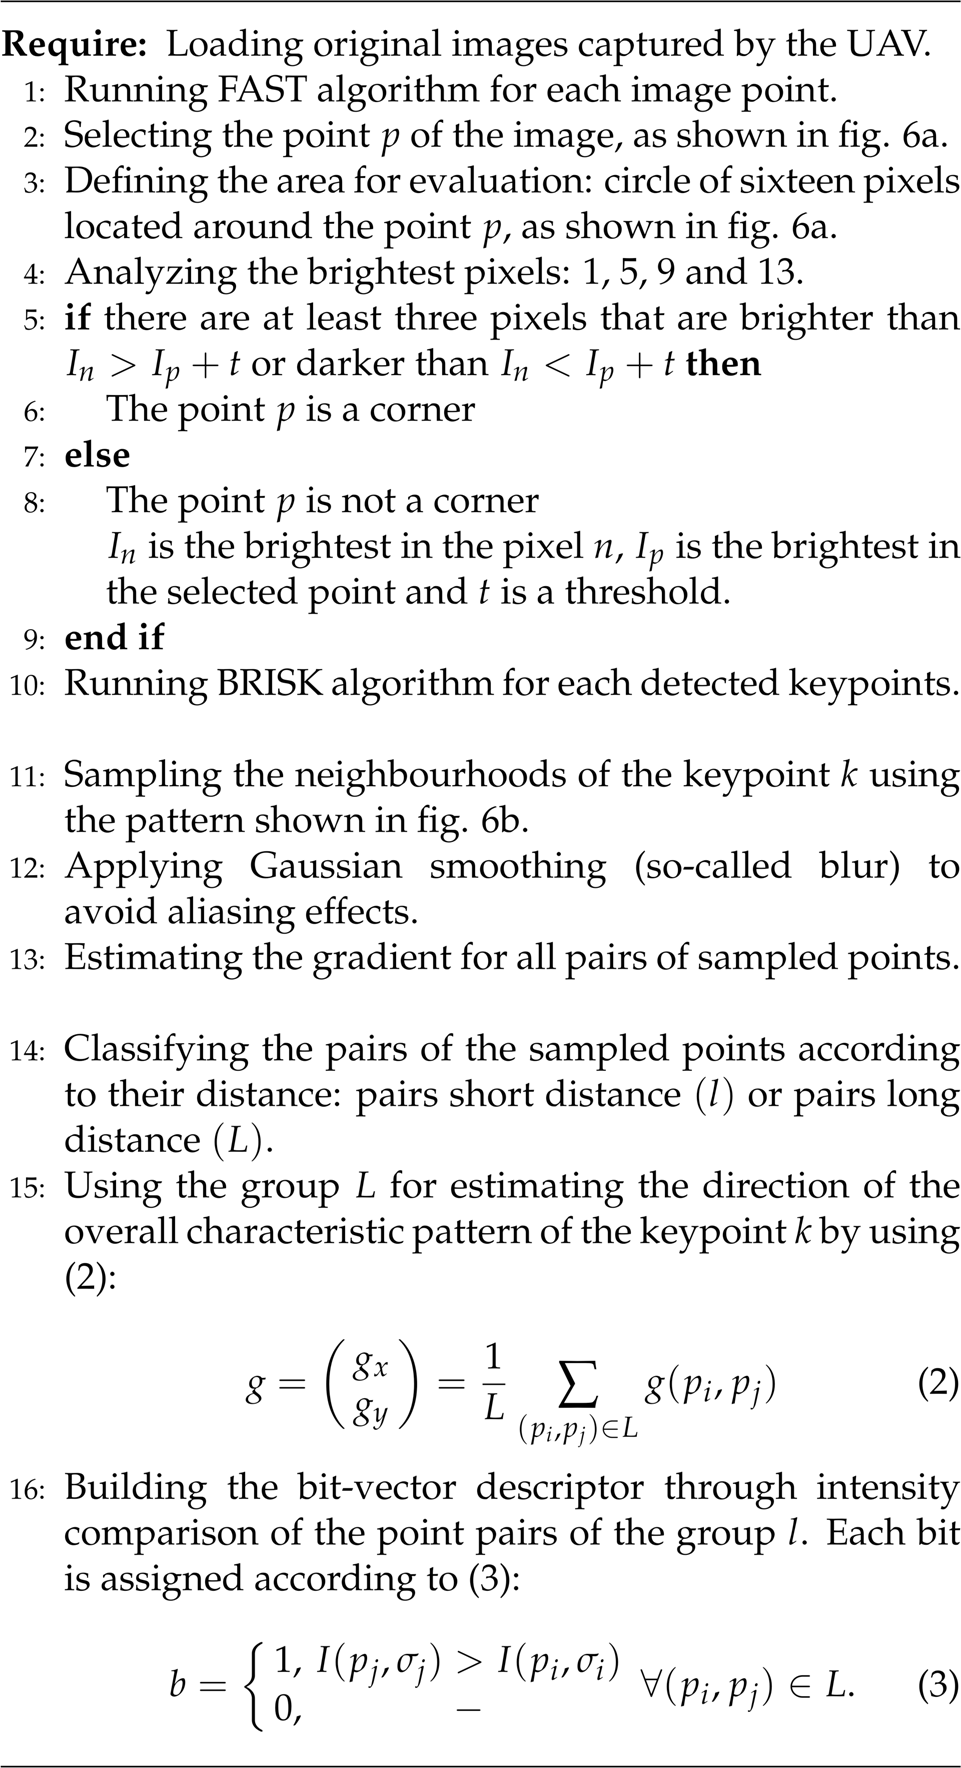
Once the images are preprocessed, we apply an alignment technique based on local features aimed at extracting any relevant information from the images. To do this, we implemented an algorithm for extracting those features, matching key points to finally obtain a transformation model. To extract the relevant features from the image, we used the FAST method as a detector (viz., the features from accelerated segment test) [29] and the BRISK method as a descriptor (viz., binary robust invariant scalable key points) [23]. These methods were selected because they enable us to find a greater number of matched features and also use less memory space.

Algorithm 1 describes how we extract relevant features from each image. Firstly, a non-parametric KNN classifier and an optimization algorithm called Flann are used to find all the matching images. Secondly, an interactive method called RANSAC is used to verify whether the matching and selection have provided an accurate set of features compatible with the transformation model.
Therefore, the homography matrix is calculated using the navigation data of the drone (altitude, camera location (x, y) and orientation (roll (ϕ), pitch θ and yaw ψ)) [34]. In order to find the transformation model between two images that relates the 3D space and the image space, we used the homography matrices H and G to transform from the camera frame of reference to the inertial frame, and vice versa. Both matrices H and G are described in (4) and (5) respectively.
In (2) and (3), g(p i ,P j ) is the local gradient, and I(p j ,Σ j ) y I(p i ,Σ i ) are the smoothed intensity values in the points (p i ,p j ),

Features Extraction process

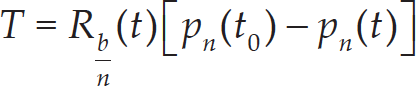


Note that t0 and t are the initial and latest sampling times, p
n
is the position vector of the UAV, and R
b/n
is the rotation matrix that relates from the navigation frame to the camera frame, which is also denoted as

Blending
Blending is used to concatenate or merge the images to build the panorama. To correctly merge the images, we implemented a method that corrects the perspective transformation and projects onto a planar surface. The homography matrix is used to update the camera parameters and the rotation matrix in order to perform the correction of perspective. Hence, the image points are mapped to a planar surface in order to take into account the geometrical motion produced by the UAV's camera. The algorithm applies the aforementioned process to each image and, at the same time, constructs a single panorama image. To reduce noise, we used a mask that distributes the information of the shared regions between the set of images. We preferred using a mask rather than a Gaussian filter to ensure that we would not lose any image information during the iterative process. Algorithm 2 explains the blending step in more detail.
In this paper, we used an open source ROS package called tum_simulator developed by [31]. The simulator uses the well-known Gazebo engine to provide a more realistic simulation using the AR.Drone platform. Inside the tum_simulator package, one can find a complete description of the the AR.Drone, including kinematics, dynamics, sensor and actuation models. By using the driver ardrane_autonomy, it is possible to access the ROS topics and publishers of the AR.Drone model, such as navigation data, camera information, etc.

Blending step
Thus far, we have created several environments to emulate some of the types of minefields that might be found in Colombia, including different vegetation densities and soil topologies. Figure 7 details some of the scenarios. The 3D models were created in the Google SketchUp software package, but some of the objects within these worlds, such as rocks and plants, were downloaded from the 3D Warehouse-SketchUp database. We included these scenarios within the landmine_zone_gazebo package 4 .

Simulation scenarios: a) short green grass, b) a deserted area, c) abundant vegetation
As mentioned at the beginning of this article, landmines in Colombia are mostly hand-crafted and partially exposed on the terrain's surface so that they can be triggered. The military reports that tuna cans are one of the materials used by rebels for housing explosives. In this section, we present our experimental results after collecting data during six months of trials. Overall, we analysed 28029 images captured by the drone during flight, and the drone covered three type of terrain under different weather conditions (see Table 1). On average, the drone covered terrain areas ranging from 15m2 to 80m2 with a flight altitude ranging from 1m to 7m. In addition, we used tuna cans as landmine-like objects partially visible on the terrain's surface. The percentage of visibility was modified by covering a portion of each tuna can with leafs, grass, plants or rocks. The forthcoming field-report basically shows the performance of the system in terms of:
(Landmine-like object detection): the percentage of detection measured by the true positive rate (TPR) and the false positive rate (FPR) given by the receiver operating characteristic (ROC) curve.
(Terrain map generation): the feature confidence measure between a ground-truth image and the image mosaic obtained with the stitching algorithm.
The types of terrain used for the experiments
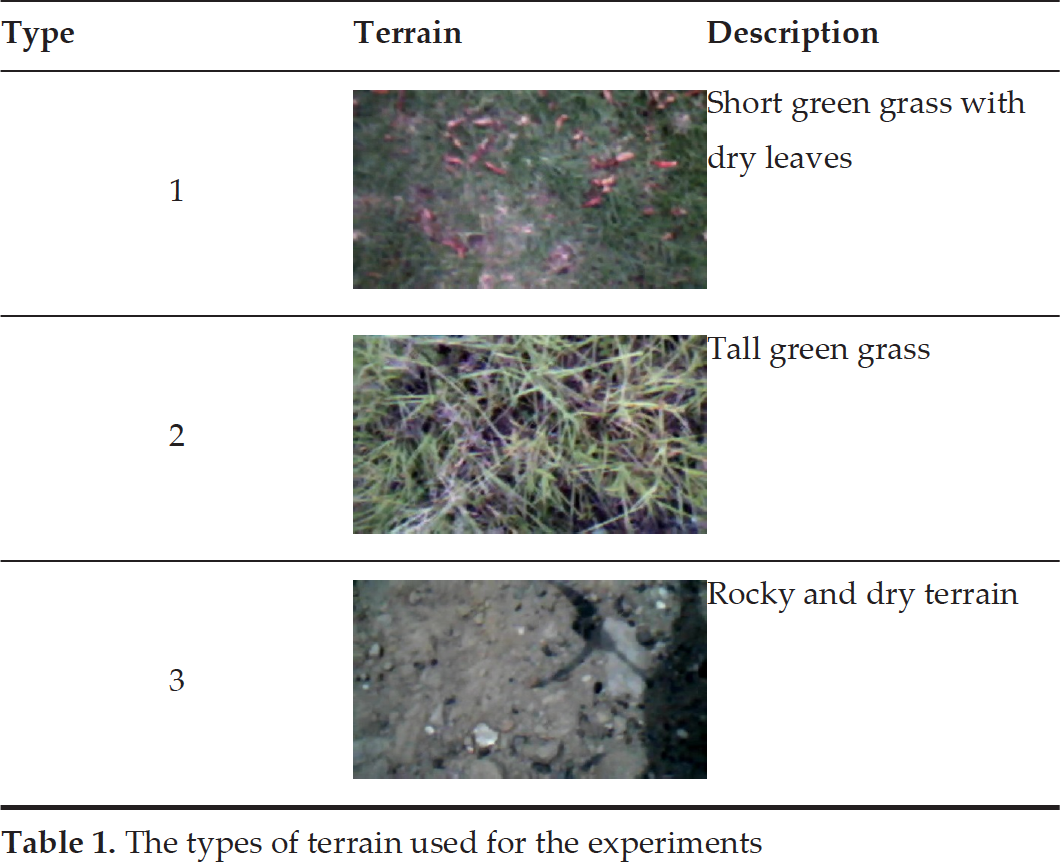
The types of terrain used for the experiments
Figure 8a shows the trajectory followed by the drone while covering an area of 80m2. The red circles represent the GPS coordinates of the detected landmine-like objects during flight. The drone captured images of the terrain at a rate of 15Hz using its bottom camera (i.e., the camera aiming downwards). This camera has a low resolution of 320 × 240 pixels at 60 fps with a field of view of 47.5°. The drone should fly at an altitude of 0.95m and a speed of 0.3m/s to ensure accurate detection. The detection algorithm runs at the ground station and takes 250ms to process the images. In addition, Fig. 9 shows the detected objects corresponding to the red circles shown in Fig. 8a. The detection algorithm detects the boundary of the object and places a red square around the object. In most cases, the boundary of the object cannot be perfectly matched to the real size of the object; therefore, the algorithm places a white circle around a larger portion of the area which might be compromised.

a) The 3D trajectory of the quadrotor: a covered area of 80m2 at 2560m above sea level. The red circles are the GPS coordinates of the detected landmine-like objects. The inset shows how the detected target is displayed to the user via the base station's interface; b) panoramic image of the covered terrain. The map was created by applying a stitching method to the images captured by the quadrotor during flight.


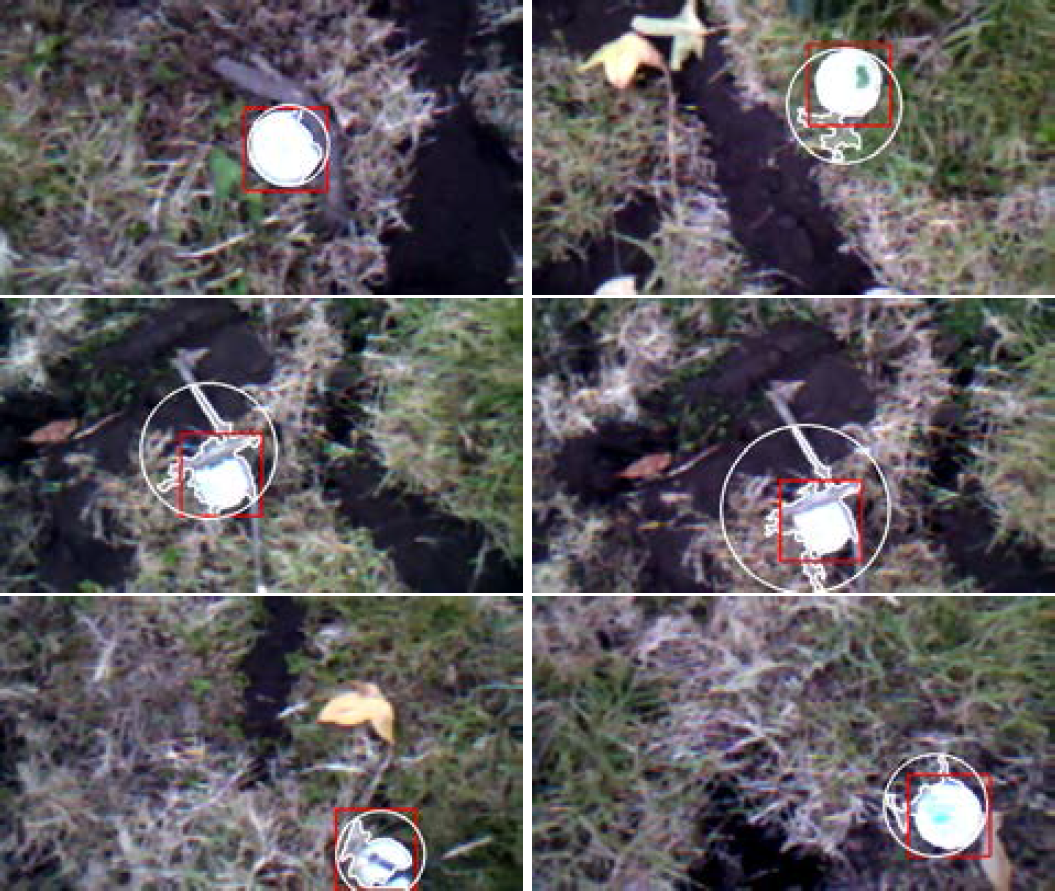
Landmines detected during the detection and geo-location mission
(detection) Summary of the overall data obtained during six months of trials. Both the TPR metric and the FPR metric condense the experimental results of the system while featuring diverse weather conditions and different types of terrain.

The ROC curve corresponds to that shown in Fig. 10a
It summarizes six months of trials. The ROC curve corresponds to that shown in Fig. 10b
Detection data classified per terrain type. The ROC curve corresponds to that shown in Fig. 10a.

We used the ROC curve to calculate the percentage of landmine detection. The ROC curve measures the sensitivity of the detection algorithm by computing the fraction of true positives out of the overall real positives, and the fraction of false positives out of the overall real negatives.

a) TPR: the ROC curve calculated for each type of terrain described in Table 1; b) TPR: the ROC curve calculated with the overall data obtained during six months of trials

Experimental results of terrain map generation based on image stitching: a) the assembled mosaic with geo-located landmine-like objects (red circles), b) output map showing the covered terrain and the drone's trajectory. Left-to-right: (i) Terrain type 1 (flying altitude: 4.5m), (ii) Terrain type 2 (flying altitude: 4.5m), (iii) Terrain type 3 (flying altitude: 6.58m).
Equations (13) and (14) describe how to obtain both measurements. The parameter TN represents the number of true negatives, TP the true positives, EP the false positives and FN the false negatives. Table 2 summarizes the overall performance of the system after analysing 28029 images similar to those shown in Fig. 9. As shown in Fig. 10b, the overall TPR measurement of 0.9416 is located at the top left-hand border of the ROC space, which demonstrates the accuracy of the detection algorithm. In the ROC space, an area of 1 represents a perfect test whereas 0.5 represents a worthless test. TPR=0.9416 is a promising result considering the low resolution of the camera, the variations in the terrain's brightness due to different weather conditions, and the visibility of the object depending on the type of terrain. Likewise, Fig. 10a shows how the TPR metric changes depending on the terrain conditions. It turns out that terrains with taller grass dramatically induce noise in the detection algorithm, decreasing the percentage of detection to 82.6% compared to dry terrain with short grass or rocks (see Table 3).
Figure 11 shows the experimental results regarding terrain map generation based on the image stitching method described in Fig. 5. The column (a) of Fig. 11 depicts the assembled maps for each terrain type and the column (b) shows the trajectories followed by the drone. The flight data is listed in Table 4. Unlike the experiments regarding the landmine-like detection, in which the flight altitude was set at about 1m to ensure the accurate detection of the object (see Fig. 8), here, we have tested a diverse range of flight altitudes to ensure an accurate image mosaic. It is essential to determine any trade-off between altitude and speed that enables a higher feature confidence measurement, i.e., a match of key points between the assembled image mosaic and a ground-truth image. For this purpose, we found that the drone should fly between 3.5m and 4.5m above the ground at speeds of less than 0.3ms−1 aimed at extracting enough features from the ground. This setup applies for Terrain types 1 and 2 due to the huge number of features (objects) found in the images. For dry terrains (Terrain type 3), the altitude can be increased up to 7m due to the lack of object cluttering within the image. The main advantage of flying higher is based on the time needed for the generation of the map.

a) Terrain type 1 at a flying altitude of 3.24m, b) Terrain type 1 at a flying altitude of 4.5m. Left-to-Right: (i) the ground-truth image taken at an altitude of 10m, (ii) the image mosaic obtained by the stitching algorithm, iii) the matching between the ground-truth image and the image mosaic.
To evaluate the feature confidence of the image mosaic (terrain map), we used a ground-truth image of the terrain to be mapped. Figure 12 shows the results. In both cases, one can see that the stitching method was able to generate the corresponding map of the terrain where the features of the panoramic images corresponded to those from the ground-truth image. Despite the low resolution of the camera (320 × 240 pixels), we achieved an average feature confidence higher than 0.82 (see Table 4). Figure 13a details the terrain areas covered by the drone flying at different altitude profiles. Likewise, Fig. 13b shows how the number of matching features decreases when the altitude of the drone increases.
(Terrain map generation) Summary of the overall data obtained during six months of trials. The drone was able to generate a panoramic image for each type of terrain evaluated. Figure 11 depicts the output maps.

The type of terrains are shown in Table 1

Covered terrain areas with different altitude profiles
The experimental results demonstrate that the proposed method for map generation and visual landmine-like object detection delivers both visually pleasing and geometrically accurate image registration. For the bulk of cases, our system was able to detect partially buried objects in different types of terrains with a percentage of detection higher than 80% (cf. Table 3). Likewise, it was found that the quality of the feature-based registration for the image stitching was highly dependent on the distribution of features within the images and the drone's altitude. Because our goal was to use a low-cost aerial vehicle, such as the AR.Drone; the speed, altitude and the area to cover played an important role for the accurate assembling of the image mosaic. The results recommend covering small areas (50m2) flying lower than 5m with an average speed of 0.2ms−1 (cf. Figure 13).