
Abstract
Stochastic error in the Micro-Electro-Mechanical-System (MEMS) Strapdown Inertial Navigation Unit (SINU) is the primary issue causing sensors to be unable to operate as a standalone device. Conventional implementation of MEMS SINU fuses measurement with a global positioning system (GPS) through a Kalman filter in order to achieve long-term accuracy. Such integration is known as a GPS-aided SINU system, and its estimation accuracy relies on how precise the stochastic error prediction is in Kalman filtering operation. In this paper, a comprehensive study on stochastic error modeling and analysis through a Gauss-Markov (GM) model and autoregressive (AR) model are presented. A wavelet denoising technique is introduced prior to error modeling to remove the MEMS SINU's high frequency noise. Without a wavelet denoising technique, neither the GM model nor AR model can be utilized to represent the stochastic error of SINU. Next, details of the Kalman filter implementation to accommodate the AR model are presented. The modeling outcomes are implemented on an unmanned aerial vehicle (UAV) for on-board motion sensing. The experimental results show that AR model implementation, compared to a conventional GM model, significantly reduced the estimated errors while preserving the position, velocity and orientation measurements.
Introduction
Stochastic error [1] exists in all Micro-Electro-Mechanical-System (MEMS) Strapdown Inertial Navigation Units (SINU). It is the primary issue causing the MEMS SINU to be unable to function as a standalone navigation instrument [2,3]. Nevertheless, MEMS SINU stands as the cheapest attainable solution compared to high performance inertial sensors [4].
Several methods exist in stochastic error modeling. The conventional approach is to model the stochastic error using a Gauss-Markov (GM) model [5,6], or, to be more specific, a 1st order GM model. Such an approach requires the implementation of an autocorrelation function on the MEMS SINU static data. Another approach, using Allan Variance (AV) analysis [7], which was originally developed to analyse the frequency stability of oscillators, has been adopted [8] to characterize the random errors of MEMS SINU. In general, AV analysis is a relatively compendious method used to analyse and model random errors in MEMS SINU compared to a power spectral density approach [8, 9], which usually relies on the autocorrelation function of the MEMS SINU data. Other than the above mentioned methods, another efficient approach is to apply an autoregressive (AR) model [5, 10] in stochastic error modeling. AR modeling has existed for more than 60 years, and was originally developed to solve time series problems [11] such as voice and sound identification, and can be applied for MEMS SINU's stochastic error modeling. Note that the implementation of AV analysis in MEMS SINU was particularly discussed in [9], and so the AV analysis discussion will not be presented in this paper.
This paper presents a comprehensive study on MEMS SINU's stochastic error modeling using an AR model compared to a GM model. A common practice to acquire the inertial sensor's stochastic error is through its static measurement. In this paper, the modeling is implemented on three independent sets of MEMS SINU's eight hours of static data. The MEMS SINU is a 9-axis inertial sensor that consists of 3-axis accelerometers, 3-axis gyroscopes, and 3-axis magnetometers. A crucial pre-filtering process known as a wavelet denoising technique is applied on the static data before error modeling [12,13] to remove the high frequency noise. Without wavelet denoising, both the GM and AR models failed to represent the stochastic noise of SINU. The outcomes of modeling indicate that the AR technique, as compared to a GM model, offers a consistent result on stochastic error modeling. To proceed further, a global positioning system (GPS) aided SINU system is proposed with an improved Kalman filter process to accommodate the AR model. The integrated Kalman filtering with AR model implementation is outlined and compared with the non-AR model. Lastly, the developed system is applied to an unmanned aerial vehicle (UAV) [14] and the results obtained are compared with the outcomes of a GPS-aided SINU system using a GM model.
The outline of this paper is organized as follows. Section 2 discusses the principle of the wavelet denoising technique and its influence on MEMS SINU data. Section 3 describes the MEMS SINU's stochastic error modeling using an AR technique. Comparisons are made between AR models with the GM model to show that the AR modeling offers better stochastic error estimation. Section 4 outlines the Kalman filter modeling of the improved GPS-aided SINU system with an AR model. Section 5 presents the proposed system's implementations on an UAV aeroplane, with intensive results and discussions to show the betterment of GPS-aided SINU with AR model implementation. Finally, section 6 summarizes the paper's findings.
Principle of Wavelet Denoising Technique
As mentioned previously, the wavelet denoising technique is an important signal handling technique adopted in the pre-filtering process of MEMS SINU data to remove its high frequency noises. The MEMS SINU stochastic error, without the wavelet denoising process, cannot be efficiently modelled in either the GM model or AR model. Hence, it is of great necessity to outline the principle of wavelet denoising and its influence on MEMS SINU data.
Background Study
The wavelet denoising technique utilized wavelet decomposition theory (or known as wavelet analysis) to achieve the denoising process. It tabulates the signal in the form of translations and dilations of a unique function known as the mother wavelet or analysing wavelet [15]. Wavelet analysis possesses an advantage over the Fourier analysis, such as the local analysis of a specific portion of a signal in a specific time and frequency portions [5,13,14,15].
The mother wavelet Ψ(t) is a complex function used to transform designated signals in wavelet analysis. It must satisfy the following two conditions:


where Ψ(t) denotes the Fourier transform of Ψ(t). Equation (1) signifies the finite energy of the mother wavelet Ψ(t), and equation (2) implies the admissibility condition in which
The wavelet transform of a real continuous time signal s(t) with respect toΨ(t) is defined as:

where Ψ represents the complex conjugate of the mother wavelet Ψ, μ is the scaling (or dilation) parameters and v is the translation (or time shift) parameter. Equation (3) can be simplified as an inner product of the real continuous time signal s(t) with Ψ, as follows:

with

Note that the value of the scaling factor μ determines the degree of extension or compression of the wavelet, and it is inversely proportional to the wavelet frequency [16]. On the other hand, the value of the shift factor v indicates delaying or hastening, on the wavelet.
Equations (3) to (5) show the continuous wavelet transform. In practice, however, only finite sets of data are generated and stored in discrete form. Hence, the discrete wavelet transform is implemented rather than the continuous wavelet transform. In the discrete wavelet transform, a subset of the scale factor μ and the shift factor v is chosen for the overall calculation. The subset in accordance to the power carries the constant value of 2, which forms the optimal means of determining the “dyadic” scale and shift [15,16,17] for the whole discrete wavelet transform process. With the “dyadic” condition taking into consideration, the scale factor μ and the shift factor v can be derived as follows:

where n and m refers to the discrete dilation and discrete translation indices. Thus, the discrete wavelet transform equation can be obtained by substituting equation (6a) andequation (6b) into equation (3), as shown below:
The wavelet denoising process of MEMS SINU data can be divided into three steps. Firstly, wavelet decomposition is performed on the MEMS SINU data to partition the data into a low frequency Approximation component and high frequency Detail component. Secondly, the high frequency Detail component is removed. The justification is that the primary identity of motion information in MEMS SINU's data is embedded in a low frequency Approximation component. The high frequency Detail component, on the other hand, is composed by noise. Lastly, wavelet reconstruction is carried out to recover the denoised MEMS SINU data.
As mentioned earlier, the MEMS SINU data that signify the motion information lie in the low frequency region. Judging from a wavelet decomposition point of view, the decomposed Approximation part should hold the signal's identity. Note that additional wavelet decomposition can be applied on the Approximation part to obtain a 2nd level of Approximation and Detail parts. Such a decomposition process could be continuously implemented on each level of the Approximation part to acquire the next level of Approximation and Detail parts until the decomposed components hold only a single sample. Such a procedure is known as a wavelet decomposition tree or wavelet multiple level of decomposition (LOD).
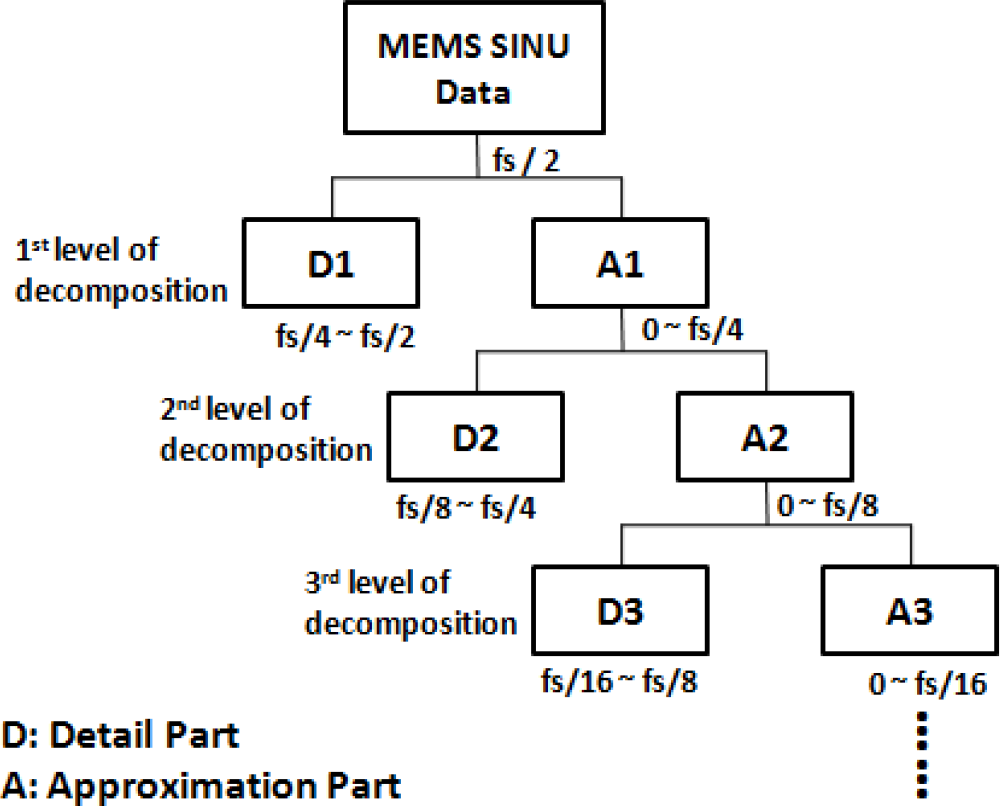
Block diagram of wavelet decomposition tree
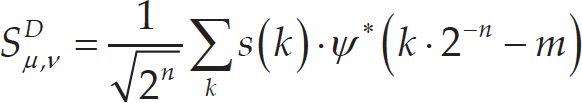
Figure 1 shows the block diagram of multiple LOD of MEMS SINU data, and the equation of wavelet decomposition on MEMS SINU data can be expressed as:

where the parameters

where n represents the LOD.
Considering the MEMS SINU data represented in its wavelet decomposition form as shown in equation (9), the denoised data can thus be expressed by excluding the Detail component, as follows:

where S D represents the denoised MEMS SINU data.
To evaluate the effect of wavelet denoising technique on MEMS SINU data, three different sets of MEMS SINU data were collected under three different conditions at a 40 Hz data rate. The first dataset was MEMS SINU static data obtained by recording the sensor's data in stationary, non-vibrating conditions at room temperature. The second and third sets of data were recorded by mounting the MEMS SINU inside a moving car and a moving UAV aeroplane, respectively. It should be noted that the 40 Hz data rate (which corresponds to 20 Hz motion signal bandwidth) is sufficient for the wavelet denoising technique since the measured motion data reside in the low frequency region (3 Hz) [5].
Figure 2 shows all three frequency plots of the MEMS SINU's y-axis accelerometer signals. Figure 2 shows that the actual inertial data exist at the low frequency region and that the noise exists across all frequencies, with Figure 2(b) and Figure 2(c) showing a significantly high amplitude spectrum at frequencies ranging from 12 Hz to 16 Hz, mainly caused by the vehicle's and the UAV aeroplane's engine vibration [5], respectively. The red lines shown in Figure 2, indicate the cut-off frequency of 2.5 Hz, equivalent to the Approximation frequency after the 3rd LOD. Data from other accelerometers and gyroscopes experience similar responses as compared to Figure 2.

MEMS SINU data frequency plots
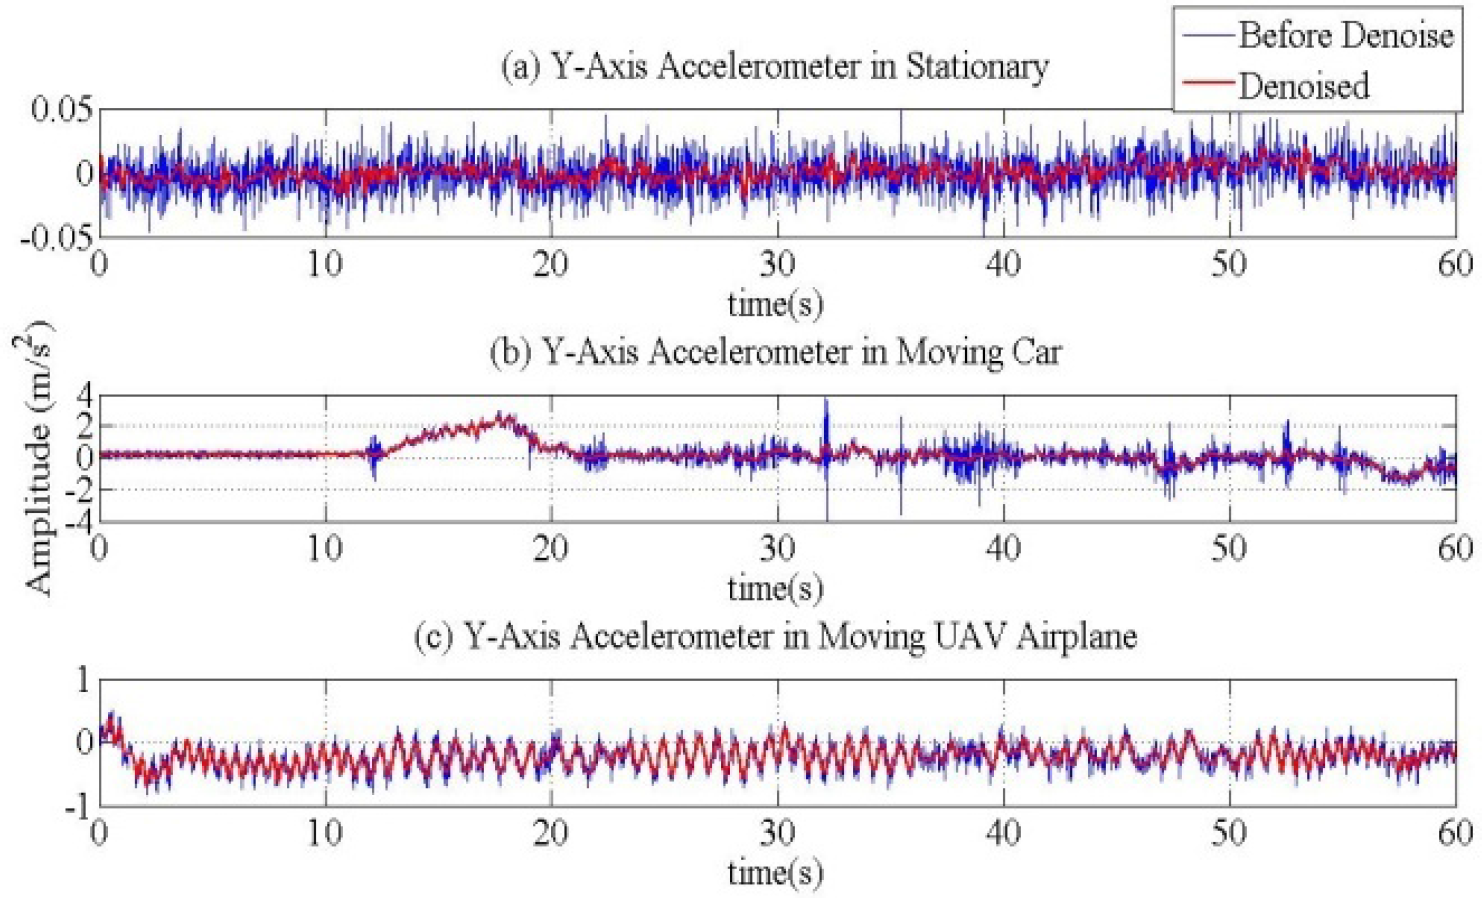
MEMS SINU data plots - before and after wavelet denoising
Figure 3 shows the MEMS SINU data plot, with and without the implementation of wavelet denoising. Special attention should be placed on Figure 3(a), which outlines the 60-second y-axis accelerometer's stationary plot. Note that the stationary measurement of MEMS SINU data is supposed to produce zero measurement, but due to the stochastic errors retained in all frequency ranges the stationary measurement outputs show non-zero values. Notice from Figure 3(a) that the wavelet denoising technique is able to improve the static MEMS SINU data, with the calculated standard deviation reduced from 0.0148 m/s2 to 0.0062 m/s2. However, the effect of stochastic errors residing in a low frequency zone will still have a significant impact on the MEMS SINU's measurement accuracy. Nevertheless, the implementation of a wavelet denoising technique has successfully removed high frequency stochastic errors, thus enabling the implementation of stochastic error modeling using GM and ARmodels. Figure 3(b) and Figure 3(c) show the 60-second y-axis accelerometer plots, in a moving car and moving UAV aeroplane, respectively. Both figures show a significant improvement in the motion data after eliminating the high frequency components of the MEMS SINU data.
This section outlines the derivation of MEMS SINU's stochastic error using GM and AR models. The GM model represents the conventional model of the inertial sensor's stochastic error, while the AR model represents a relatively new approach for the inertial sensor's stochastic error modeling. Here, the modeling analysis focuses on MEMS SINU, and the modeling outcomes are discussed and compared.
Gauss-Markov (GM) Model
The Gauss-Markov (GM) model is a stationary model represented by an exponential autocorrelation function [18]. A common preference of the 1st order GM model is in favour of the modeling of MEMS SINU stochastic error [5, 6].

Autocorrelation function of 1st order GM model
The 1st order GM model can be expressed as follows:

where β 1 is the inverse of correlation time t c and w is the white noise. The autocorrelation function of Equation (11) can thus be expressed as:

where Σα2 is the error variance and τ is the process time interval.
Figure 4 shows the typical autocorrelation plot of a 1st order GM model used to compare with the autocorrelation plot of MEMS SINU static data. Three independent static experiments, each of eight hours' duration, were carried out under normal room temperature to validate the efficiency of the GM model in representing MEMS SINU stochastic error. Figures 5 and 6 depict one of the autocorrelation plots of MEMS SINU's accelerometers and gyroscope static data among the three static eight-hour measurements. Similar autocorrelation plots could be obtained for the other two static data. Note that Figure 6 shows only one gyroscope's autocorrelation plot since other two gyroscopes' static measurements experienced similar responses. It should be pointed out that the wavelet denoising technique is applied on these static data before obtaining the autocorrelation plots. In the absence of a wavelet denoising process the high frequency noise component in the static data will prevent successful modeling and jeopardize the autocorrelation plots.
It is shown that by comparing Figure 5 and Figure 6 with Figure 4, one may notice that both the accelerometer's and gyroscope's behaviours are not toward the 1st order GM process. Instead, the autocorrelation functions of the accelerometers' static measurements in Figure 5 and gyroscope's static measurement in Figure 6a andFigure 6b are more toward a periodic-random process. Therefore, the conventional 1st order GM model cannot efficiently represent the MEMS SINU's stochastic error.

Autocorrelation plot of MEMS SINU's accelerometer static measurements
The autoregressive (AR) process is a unique modeling technique used to represent the stochastic error. It was originally developed for the purpose of time series modeling in a control system [11,19], and had been used in various applications with convincing results [20,21,22]. The primitive AR model in a discrete time domain can be described as follows [23]:

with x(n) and y(n) representing the input and output, respectively, and α k as the AR prediction coefficient.
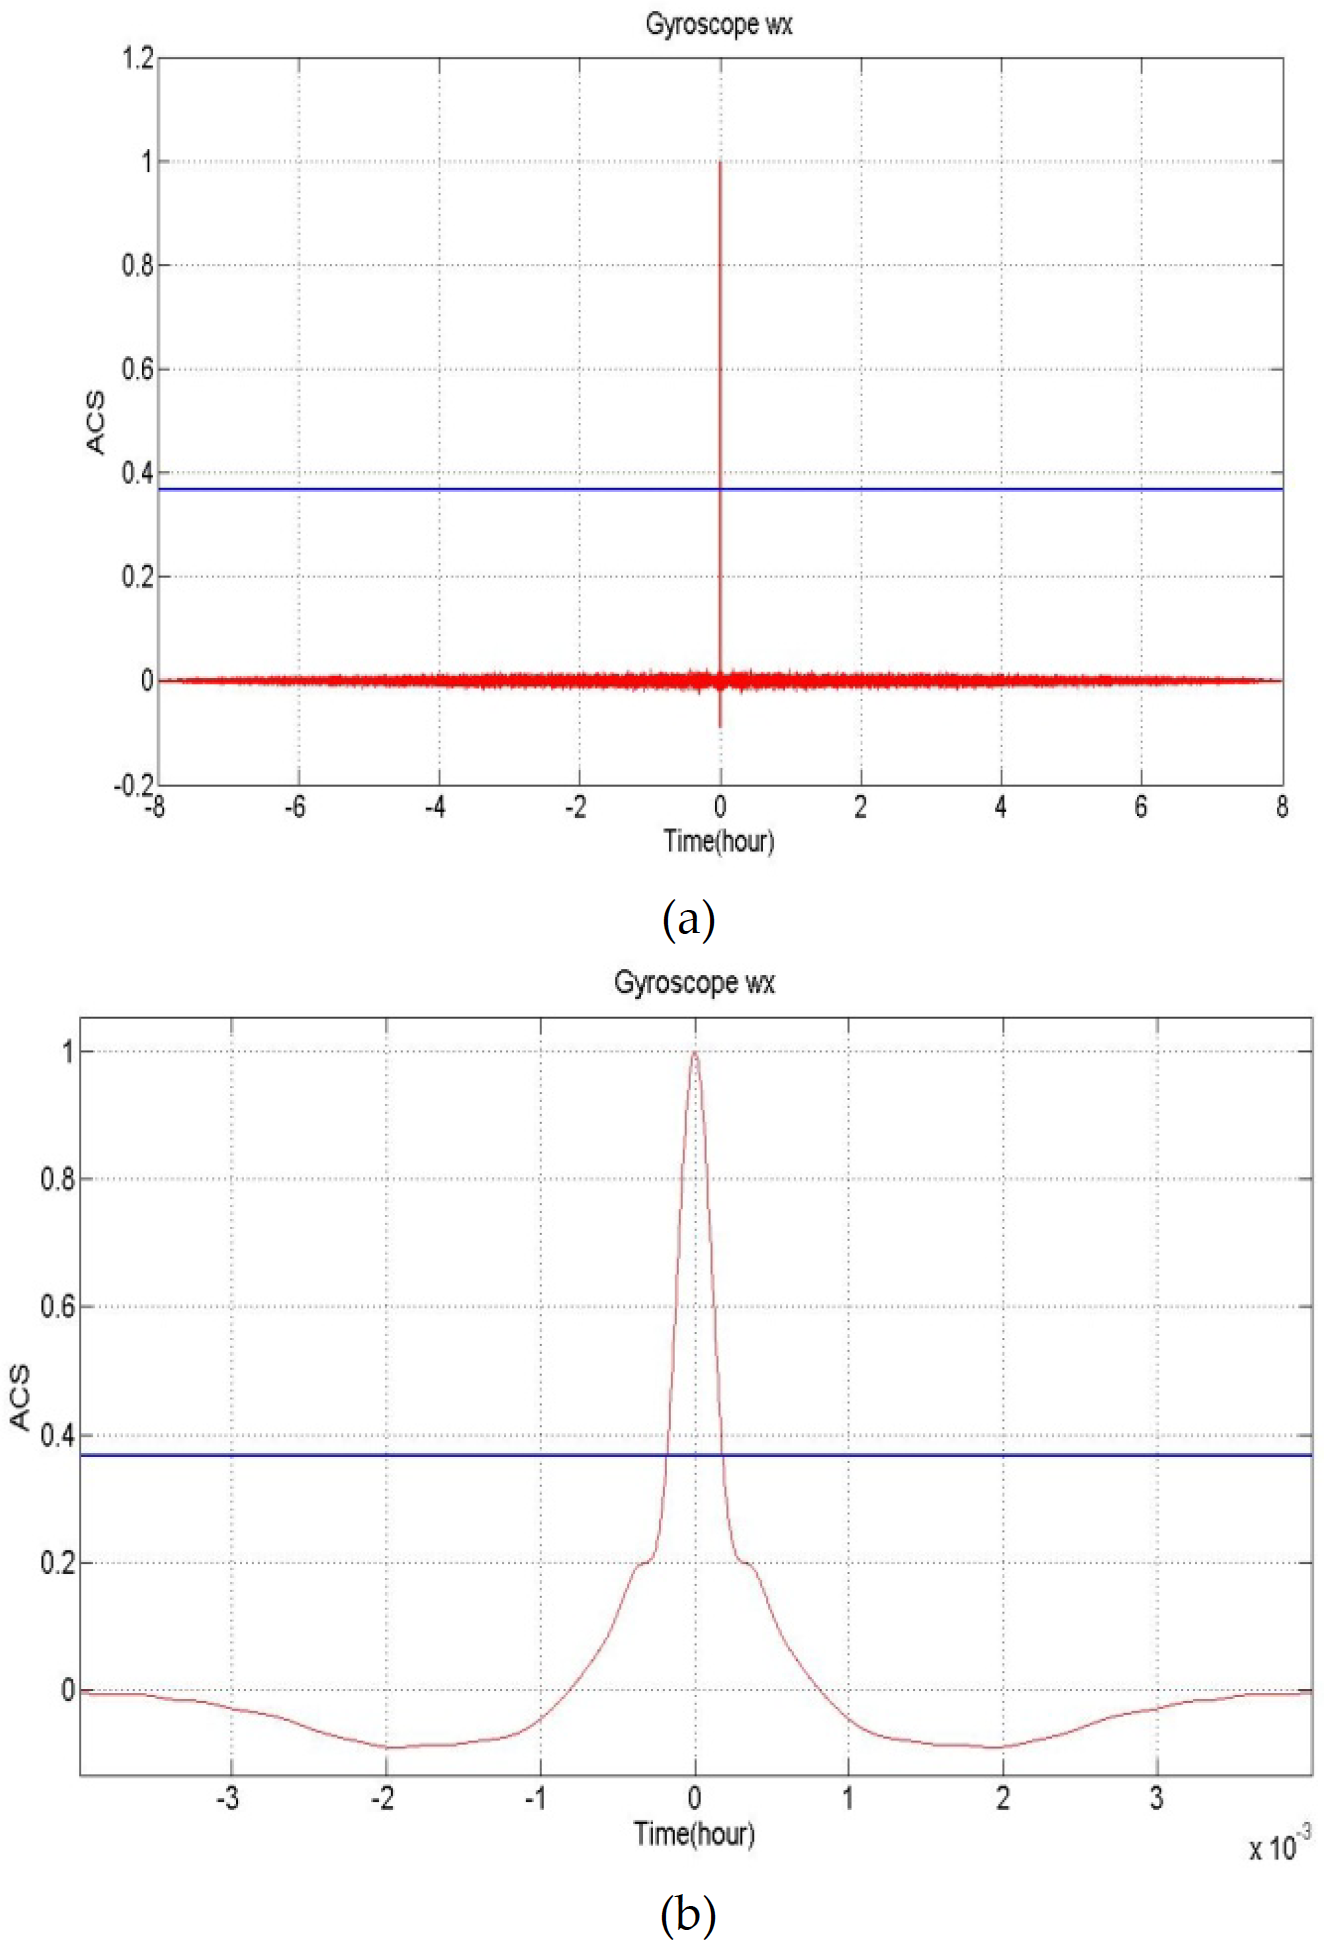
(a) Autocorrelation plot of MEMS SINU's gyroscope static measurements; (b) Close-up of autocorrelation plot of Figure 6a
It is crucial to incorporate a wavelet denoising technique into the MEMS SINU's static data in order to model its stochastic errors using an AR model. For this, consider the following equation (14):

where
where

where the subscript D in equation (16) indicates the denoised data. As mentioned earlier, the level of decomposition is kept to 3rd level with a cut-off frequency of 2.5 Hz. Lastly, it is possible to express the denoised static data as follows:

Note that x(n) is a series of uncorrelated, zero mean measurements.
It is crucial to identify the optimal values of the AR model coefficients a k in order to obtain the best estimated AR model for MEMS SINU stochastic errors. This can be achieved by minimizing the prediction error through the computation of cost function [5], and there are three distinct approaches in achieving such minimization, namely the Yule-Walker method, the Covariance method, and the Burg's method.
In this paper, the above mentioned three eight-hour MEMS SINU denoised static datasets were modelled using AR modeling. Table 1, Table 2 and Table 3 show a comparison of estimated 4th, 5th and 6th order AR coefficients on three distinct eight-hour denoised static datasets using a Yule-Walker model, Covariance model, and Burg's model on accelerometer ax, accelerometer az, and gyroscope ω y , respectively. These comparisons are necessary to reflect the most suitable AR model to be utilized in MEMS SINU stochastic error modeling.
Comparison of various 4th order AR modeling estimated coefficients on Accelerometer αx.


Comparison of various 6th order AR modeling Estimated coefficients on Gyroscope ω x .

It is observed from Table 1 to Table 3 that the Yule-Walker method suffers from inconsistency in coefficients predictions for all three datasets. Such is not the case for the Covariance method and Burg's method, where both methods show high consistency in predicting the AR coefficient parameters for all three datasets. Similar results can be obtained in higher AR orders for the accelerometers and gyroscopes, although these results were not shown here in this paper due to page limitation.
Figure 7 shows the comparison of the estimated variances of accelerometer ay from 1st order AR model until 10th order AR model between Yule-Walker method, Covariance method and Burg's method, respectively. Similar estimated variances could be obtained for the rest of accelerometers and gyroscopes. Notice from Figure 7 that the values of the estimated variances decrease as the number of AR orders increase, where significant change of variances could be observed from 1st order to 3rd order. Another observation is that the Covariance method and the Burg's method generate a relatively lower variance as compared to the Yule-Walker method with AR orders greater or equal to three. These findings could be extended to all accelerometers and gyroscopes variance estimations in various AR orders.
Overall the Covariance method and the Burg's method offer better performance as compared to the Yule-Walker method in modeling the MEMS SINU stochastic error, both in terms of modeling consistency and estimated variance. In the meantime, both methods exhibit similar but slightly different results in the coefficients and variance predictions. In this paper, the Burg's method is chosen over the Covariance method to be the AR model, since Burg's method offers higher resolution for finite data records, and it always produces a stable model as compared to the Covariance method.
This section outlines the comparison of the GM model with the AR model in terms of MEMS SINU's stochastic error modeling. It is observed that the autocorrelation functions of MEMS SINU's denoised static data are not towards the GM model. On the other hand, it is observed that the AR model, in representing MEMS SINU stochastic error, offers consistent coefficient predictions. Hence, the assumption by modeling the MEMS SINU stochastic error using a GM model is practically not accurate.

AR model variances' comparison of Accelerometer ay
Table 4 shows the comparison of the GM model and AR model in terms of modeling variance. It is shown in Table 4 that the 3rd order AR model achieved much less variance than the commonly adopted 1st GM model, signifying that the AR model is more suitable than the GM model to represent MEMS SINU's stochastic error.
Variance comparison of GM model and AR model in modeling MEMS SINU's stochastic error.

This section focuses its discussion on the implementation of a GPS-aided SINU Kalman filter based on the AR model. Note that the GM model implementation will not be discussed here, since it has already been outlined in the authors' previous research [24]. The derivation of navigation equations and its corresponding dynamic error model can also be found in [24], where the proposed system is an enhanced GPS-aided SINU system. The proposed system in [24] is implemented in this section by replacing the conventional GM noise model with the AR model. Note that the 3rd order AR model from Burg's method is chosen as the noise model due to the fact that it can achieve significantly lower variance with advantages mentioned in Section 3.
Equation (16) outlines the proposed MEMS SINU Kalman filter's prediction model:

where


where


where the matrixes
To complete the Kalman filter modeling, the following observation (or measurement) equation is derived:
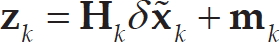
where

the where
This section outlines the experimental results of GPS-aided SINU system's implementation on an UAV aeroplane for on-board motion sensing. The 40 Hz MEMS SINU motion data together with the 5 Hz GPS data were recorded and analysed. The wavelet denoising technique was applied on the MEMS SINU motion data before fusing with the GPS data using a Kalman filter for position, velocity and orientation estimations. The duration of the experiment is approximately 3000 seconds (or 50 minutes). The average velocity of the UAV is approximately 145 km/h. Figure 8 show the GPS paths of the experiment using Google Earth [25].
Figure 9 and Figure 10 show the error estimation of all three accelerometers of the GPS-aided SINU system through Kalman filtering, by using the GM model and the AR model, respectively. It is shown that the accelerometer's error estimation in AR model possesses consistent and better estimated value than GM model.

GPS path in Google Earth

Accelerometer error estimation in GM model

Accelerometer error estimation in AR model
Figure 11 and Figure 12 depict the error estimation of all three gyroscopes of the GPS-aided SINU system through Kalman filtering, by using the GM model and the AR model, respectively. It is observed that the gyroscope's error estimation using AR model offers lower and better estimation results as compared to the GM model.
Figure 13 and Figure 14 present the Kalman filter's orientation estimation of the UAV using the GM model and AR model as the stochastic noise model. The measured orientations include Yaw, Pitch and Roll angles of the UAV. One may conclude from the comparison of both figures that the estimated results are similar. By combining the findings from Figures 8 and 9 with the result from Figures 10 and 11, one may observe that the AR model implementation establishes a similar orientation estimation with lower estimation errors as compared to GM model implementation. Such a conclusion reflects the advantage of implementing a AR model over a GM model as the MEMS SINU's stochastic noise model.

Gyroscope error estimation in GM model
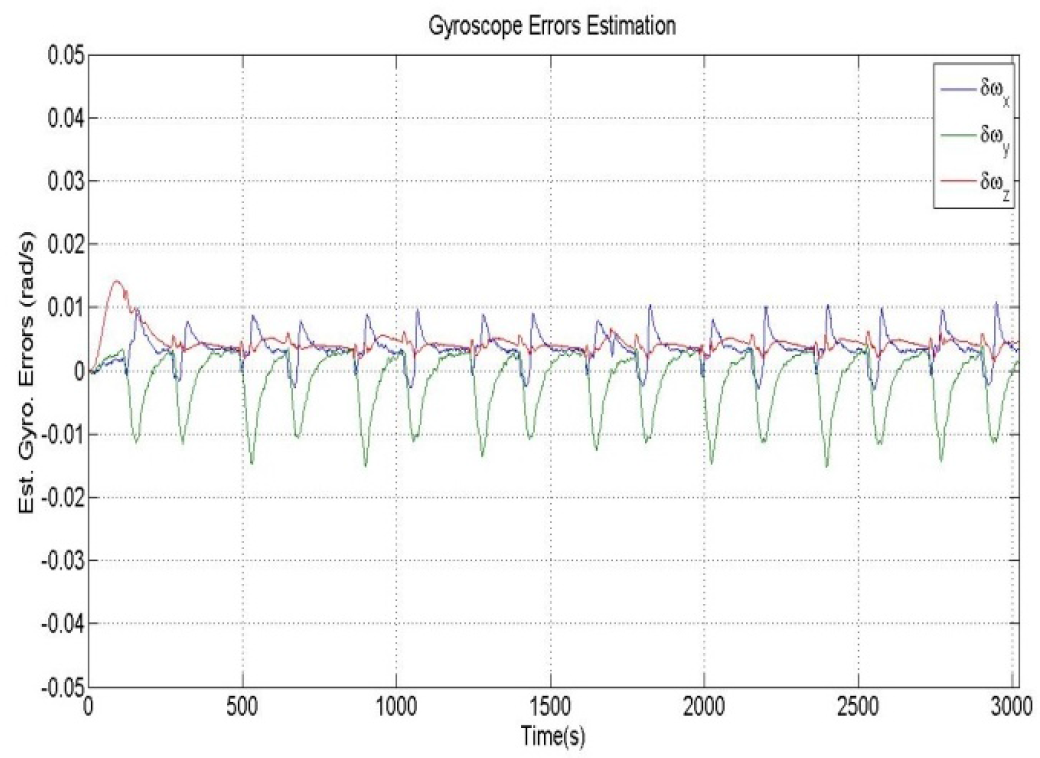
Gyroscopes error estimation in AR model
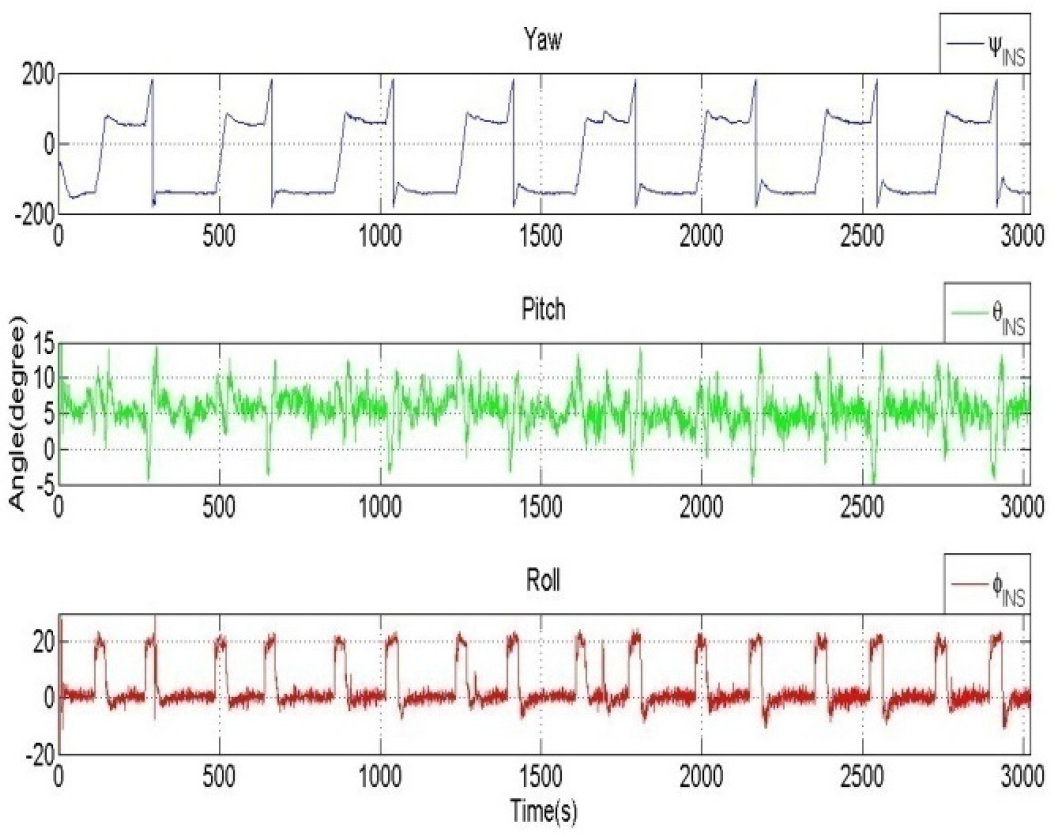
Orientation estimation of UAV in GM model
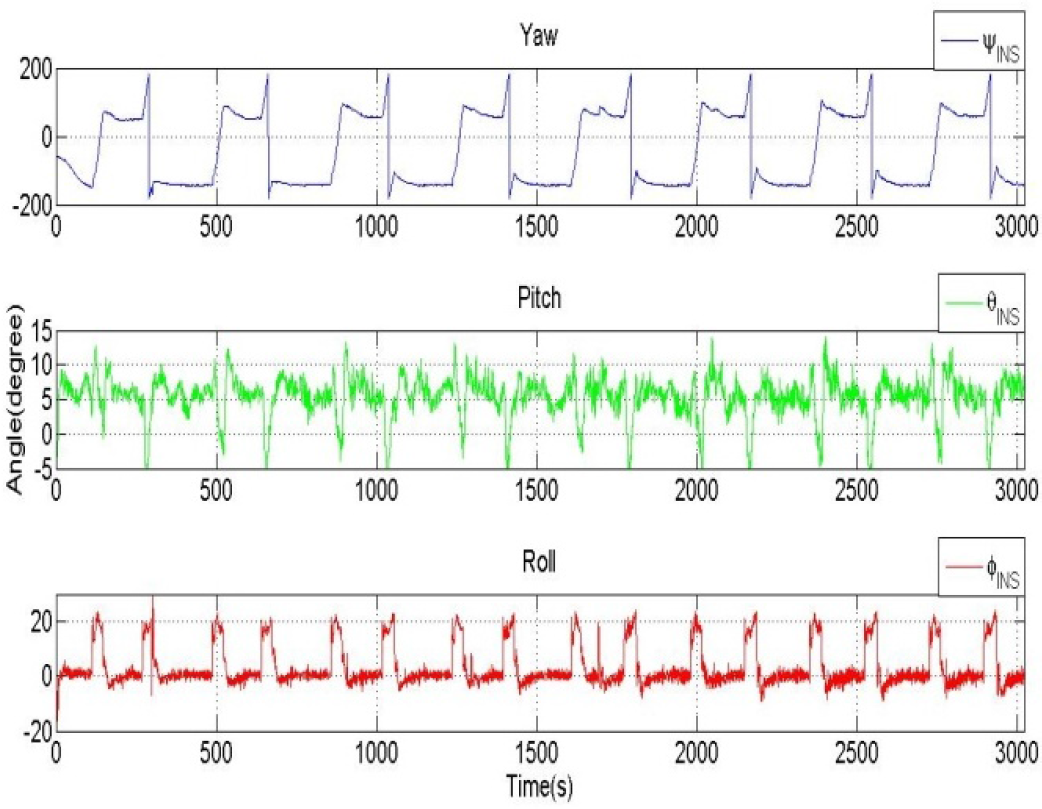
Orientation estimation of UAV in AR model
Next, Figure 15 shows the two dimensional position plots of the UAV's trajectories. The measured positions are being compared with the motion data from the UAV's on board Piccolo II autopilot system [26]. As shown in Figure 15, the blue colour plot indicates the GPS path obtained from the GPS module, while the green colour plot and the yellow colour plot indicate the MEMS SINU's navigation path by applying the AR model and GM model, respectively. Lastly, the red colour plot represents the Piccolo II's position measurement. The navigation starting point is at (0,0). The mean square difference between the GPS navigation path's measurement and the GPS-aided SINU system measurements with GM model is ±2.9834m. On the other hand, the average difference between navigation path of GPS measurements and the GPS-aided SINU system measurements with the AR model is ±2.905m. Meanwhile, the mean square difference between the GPS-aided SINU system measurements with GM model and the Piccolo II system is ±0.268m, and the mean square difference between the GPS-aided SINU system measurements with AR model and the Piccolo II system is ±0.154m.

2-D position estimation comparisons
To extend the discussion, two experiments were being conducted to evaluate and compare the performances of the GPS-aided SINU system using GM model and AR model during short term GPS outages. In the first experiment, the GPS signal's availability, originally updated once at 0.2 seconds, was being intentionally reduced to slower update rates. Table 5 illustrates the calculated position's root-mean-square-error (RMSE) compared to the estimated position with a 0.2 second GPS update rate. The position RMSE of 10 seconds, 15 seconds, 20 seconds, 25 seconds and 30 seconds GPS update rates are computed for both GPS-aided SINU systems with a GM model and AR model, respectively. The results in Table 5 signify that the GPS-aided SINU system using AR noise model achieved a lower position RMSE than the GPS-aided SINU system using a GM noise model.
Position RMSE of GPS-aided SINU system with GM model and AR model at various slower GPS update rates compared to 0.2 second GPS update rate

In a second experiment, durations of 20 seconds, 25 seconds and 30 seconds GPS outage are imposed in eight UAV flight locations. The eight locations are indicated by numerical numbers from 1 to 8, as shown in Figure 16, Figure 17 and Figure 18. These eight locations are being carefully chosen to cover different UAV flight dynamics. It could be observed from Figures 16 to 18 that the estimated positions from the GPS-aided SINU system using a GM noise model deviate significantly from the navigation path, as compared to the GPS-aided SINU system using an AR noise model, during short term no GPS conditions.

Position estimation with 20 seconds GPS outage at eight specific locations

Position estimation with 25 seconds GPS outage at eight specific locations
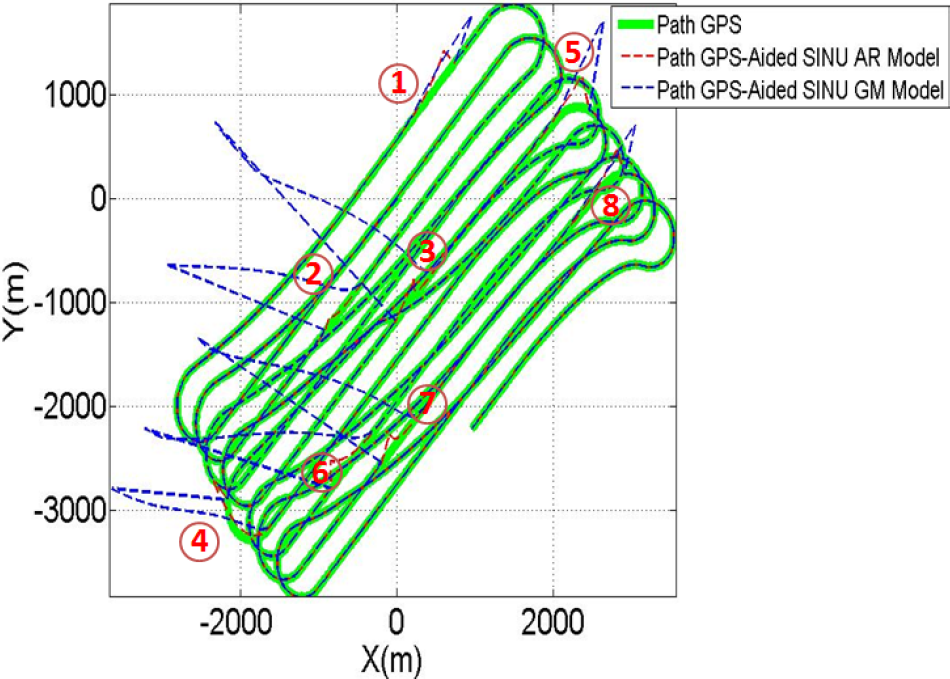
Position estimation with 30 seconds GPS outage at eight specific locations
Various estimated position errors with 20 seconds, 25 seconds and 30 seconds GPS outage duration at different locations
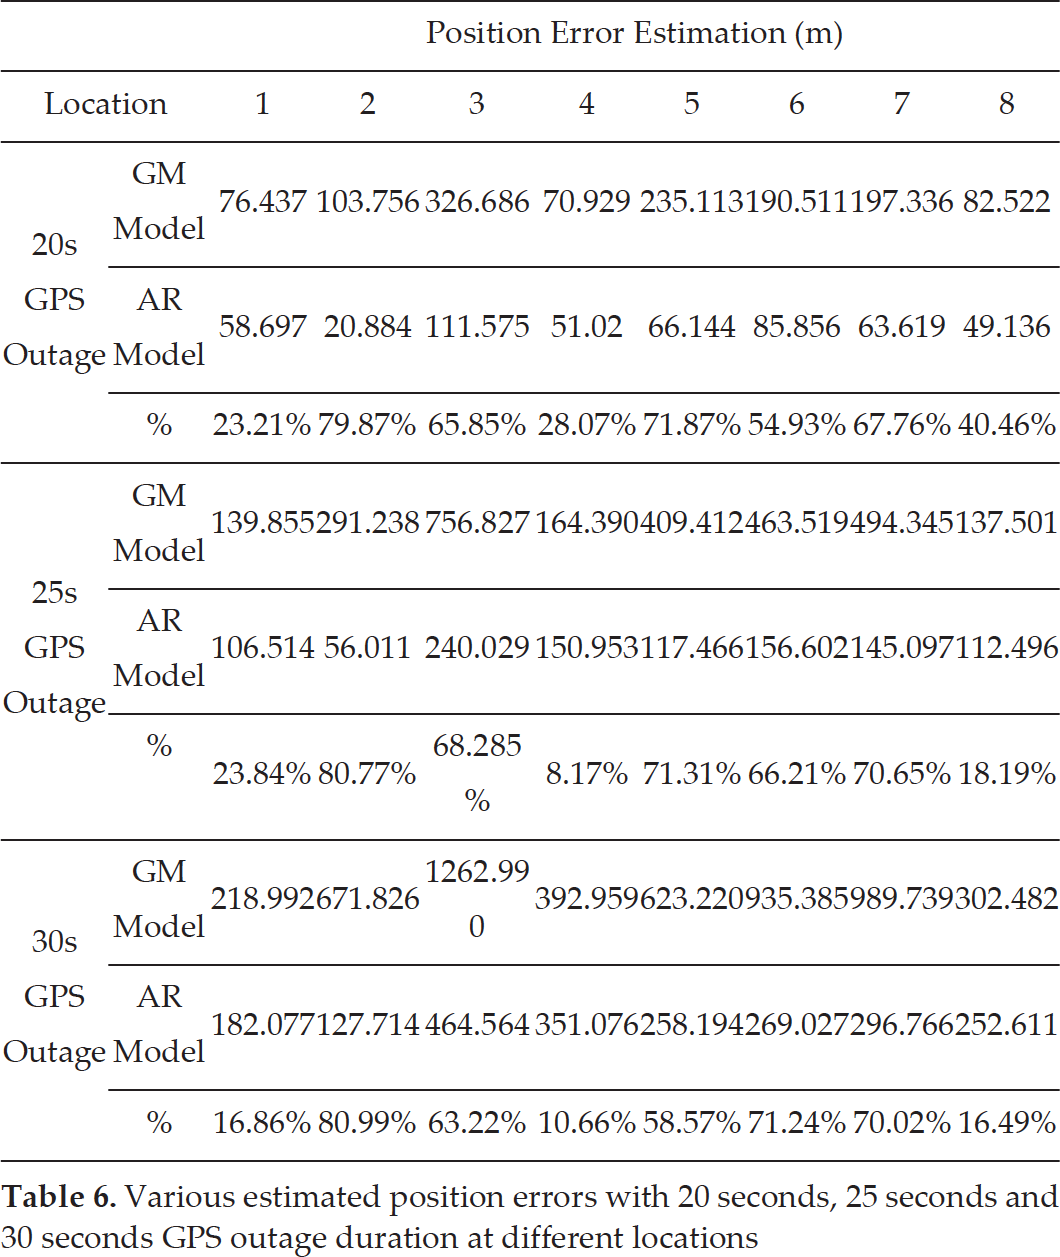
Table 6 summarized the estimated position errors of the GPS-aided SINU systems using GM noise model and AR noise model, respectively, with three different GPS outage durations at the eight locations illustrated in Figure 16 to 18. It could be observed from Table 6 that the estimated errors using the AR model are lower than the GM model.
This paper proposed a new GPS-aided SINU system modeling by implementing an AR model as the MEMS SINU's stochastic noise model. The wavelet denoising technique is introduced with two main purposes: to denoise MEMS SINU's static data for stochastic error modeling and to minimize the high frequency error of the MEMS SINU's data during GPS fusion. Comparisons are made between the proposed systems using the AR noise model with conventional system modeling using a GM noise model. Both systems have been implemented on an UAV test flight with a Piccolo II autopilot system for comparison. Experimental results indicate that the proposed GPS-aided SINU system with the AR noise model achieved better error estimation as compared to the GPS-aided SINU system with GM noise model. Another two extra experiments were conducted to justify the findings. The first experiment was conducted with a much slower GPS update rate, while second experiment introduced short duration of GPS outage during navigation. Both the GPS-aided SINU systems were put into the experiments for performance evaluations. The results clearly indicate that the GPS-aided SINU system with AR noise model achieved better position estimation than the GPS-aided SINU system with the GM model.
For future work, the performance of the GPS-aided SINU system with the AR noise model can be further improved by implementing the Adaptive-Neuro-Fuzzy-Inference-System (ANFIS) [27] as a sub-remedy system during a short duration of GPS outage.
Footnotes
7.
This work is partially funded by the Malaysian Remote Sensing Agency (ARSM).