
Abstract
In this investigation, differently shaped and surface functionalized TiO2 anatase nanoparticles and human serum albumin (HSA) were selected to study protein-nanoparticles interaction both in a solution and on flat surfaces, thereby mimicking a medical device. Anatase nanocrystals were characterized by transmission electron microscopy (TEM), Brunauer-Emmett-Teller (BET) surface analysis and dynamic light scattering (DLS). The protein-nanoparticles' interactions and their eventual reversibility were studied by pH dependent ζ- potential measurements in different media: ultra-pure water, a phosphate buffer simulating physiological conditions and in a culture medium supplemented with foetal bovine serum. The protein corona masking effect was evidenced and the interaction HSA-nanocrystals resulted irreversible. The interaction HSA-silicon supported TiO2 nanocrystals films was studied by atomic force microscopy (AFM), and resulted driven by the substrate hydrophilicity degree plus was different for the diverse range of nanocrystals tested. Surface roughness measurements showed that on some of the nanocrystals, HSA were arranged in a more globular manner. A lower protein affinity was found for nanocrystals that had a smaller primary particle size, which may correspond to their higher biocompatibility. This nano-bio interface research aimed to study the HSA protein-TiO2 anatase nanocrystals under conditions similar to those for in vitro and in vivo toxicity analyses.
1. Introduction
Nanotechnological products' rapid diffusion has given rise to concerns about the possible adverse effects following the direct or indirect exposure of humans to nanoparticles (NPs) [1-3]. Due to their high surface to volume ratios, engineered nanoparticles exhibit chemical, physical and biological properties that differ from their bulk material forms, which may lead to adverse effects on human health and environmental systems [4]. Since the toxicological and environmental effects of these compounds are not fully known, there remains a need for understanding their health and environmental impacts, nanoparticles' life cycles, human exposure routes, nanoparticles' behaviour inside the body, the risk to those who work with nanoparticles and approaches for safely handling and using nanomaterials [5-7]. The interactions of nanomaterials' functional biomolecules are considered preconditions for cytotoxicity and organ toxicity, and in this context, various proteins have been investigated over the past years [8]. Due to the possibilities created by nanomedicine [9], nano-TiO2 was tested as a nanomaterial together with human serum albumin (HSA) as a representative blood protein. The engineered nanomaterials' interactions with molecules in biological fluids (mainly proteins) presents an extremely relevant process that leads to a nano-bio interface, as elucidated over the past few years [3]. This interface, which is primarily constituted of systemic circulation proteins and phospholipids in the lung [10, 11] is not a static process, but a range of continuous associations and dissociations, where events at a certain point reach an equilibrium [12]. The final composition of the external coating, called the protein corona, is determined by size and the surface properties of the engineered nanomaterials, as well as by protein-protein interactions [13]. Nanoparticles' blood protein interactions are considered the most critical events for determining the fate of nanoparticles in the body. The blood protein-nanoparticle surface affinity regulates this interaction and may trigger adverse responses such as thrombosis and inflammation [14]. The occurrence and the extent of these processes are thought to be related to the surface chemistry of the engineered nanomaterials [15, 16]; their properties such as surface hydrophilicity, roughness and charge have been shown to modulate different proteins' adsorption on their surfaces and consequently, their biocompatibility as a biomaterial [17]. This study aims to elucidate the adsorption molecular mechanism of HSA on different titanium-dioxide nanoparticles using diverse capping agents (acetic acid, boric acid and oleic acid) [18-21]. These nanocrystals have been prepared to assess how functionalized surfaces drive HSA adsorption [22]. Functionalization aimed at obtaining new TiO2 nanoparticles that are less toxic than commercial ones, e.g., Aeroxide P25 (used as a TiO2 model), as well as the study of their interactions with HSA was applied as a test for discovering promising biomedical applications [22]. HSA was chosen because serum albumins are the most abundant proteins in plasma and among them, HSA has a wide range of physiological functions involving transport and the delivery of fatty acids, bilirubin, steroids, etc. [23]. The binding properties of HSA with drugs have been investigated in depth [24-27]. HSA is a water-soluble protein with a molecular weight of 66.500 Da and contains 585 amino-acid residues; at physiological pH, it has a net negative charge, since its isoelectric point (IP) is at pH 5.9. The binding capacity and sites of albumins have been studied in numerous reports [28-30]. Presently, as a first approach, the combination of adsorption curves, the extent of protein coverage and the irreversibility of the precesses were respectively monitored. Most protein adsorption experiments have been carried out on pure homogeneous surfaces or natural surfaces, including commercial glass of undocumented heterogeneity at the nanoscale [31]. Therefore, to further investigate the TiO2-protein interaction, wafers of Si-O were nanoparticle-functionalized using a chemical batch deposition technique to obtain TiO2 nanoparticle films where the interactions of the hydrophilic surfaces with HSA were investigated by atomic force microscopy (AFM). To correctly interpret the behaviour of proteins interacting with a surface, it is necessary to obtain complete knowledge of the interactions between them. [32] With the aid of atomic force microscopy, the interaction forces between human serum albumin layers adsorbed on different TiO2 substrates were measured. We found that electrostatic and steric forces dominated the interactions. The current study's long-term goal was to better understand the protein-nanoparticle adsorption mechanism, both in a solution and on implanted flat surfaces. Therefore, it was important to investigate how the surface characteristics affected the adsorption of proteins, as well as their conformational changes effected on immobilization; this was done using complementary surface analysis techniques.
2. Materials and Methods
2.1. TiO2 Samples Preparation
All chemicals were analytical-grade reagents that did not undergo any further purification. For the anatase TiO2 nanocrystals' synthesis procedure, conditions and details have been explained in our previous works [18-21, 33]. Briefly, all the nanocrystals were synthesized using a microwave-assisted procedure, via hydrolysis of titanium tetraisopropoxide Ti(iPrO)2 (TTIP) in benzyl alcohol in the presence of acetic acid (labelled TA) or oleic acid (labelled TO) or boric acid (labelled TB). Commercial Aeroxide P25 was also employed and the resulting materials were compared with the synthesized nanocrystals in the different experiments. Human serum albumin (HSA), which was chosen as model, was purchased from Sigma Aldrich (Germany) and used without further purification. In all experiments, ultrapure Milli Q (Millipore, Billerca, MA) water was used. All other reagents were purchased from Sigma Aldrich (Germany).
2.2 Nanocrystals' surface area measurements
The nitrogen adsorption-desorption isotherms at 77 K for Brunauer-Emmett-Teller (BET) characterization were recorded using a Quantachrome ASiQwin system.
2.3 ζ Potential measurements
The ζ potential was evaluated by means of electrophoretic light scattering (ELS) (Zetasizer Nano-ZS, Malvern Instruments, Worcestershire, UK).
Titania nanocrystals (TA, TO, TB and Aeroxide P25) were suspended in ultrapure water, in a 10 mM (PBS) phosphate buffer or culture medium (RPMI) at a concentration of 0.5 mg/ml and sonicated for 2 min prior to measurements.
The ζ potential at pH 7.4 (physiological condition) was obtained by interpolating the curve obtained by measuring the ζ potential at different pH levels (1–11) by adding 0.1 M HCl or NaOH to the suspension. The interaction at different concentrations (0.1–100 mg/ml) between titania nanoparticles and HSA was checked by the ζ potential measurements, which were also repeated following the incubation period with the protein. Then, to assess the irreversibility of the interaction, measurements were taken after washing HSA-titania nanocrystals with PBS. The data were expressed as mg of protein adsorbed on m2 as a function of the protein concentration in the solution following incubation.
2.4 HSA adsorbed amount on nanocrystals
Titania powders (TA, TO, TB and Aeroxide P25) were suspended (30 mg/ml) in a PBS solution of HSA at different concentrations (0.1–100 mg/ml). The suspensions were stirred using a thermostatic stirrer at 37°C for 1 h. After centrifugation at 11 000 RPM for 10 min, the nanoparticle-protein complexes were filtered through a membrane filter (cellulose acetate, pore diameter 0.45 μm). The residual HSA concentration in the supernatant was determined spectrophotometrically (562 nm) by using the bicinchoninic acid (BCA) assay. This method, based on the formation of a violet complex between Cu+ ions and the protein, is highly sensitive and suitable for determining a wide range of different proteins [34]. The adsorbed HSA amount was calculated as the difference from initial concentrations. The theoretical monolayers were calculated from protein sizes as the amount needed to obtain a side-on protein monolayer on an entirely available flat surface. The results were reported as the mean value of at least three separate determinations ± standard error.
2.5 Silicon-nanocrystals' substrates preparation
Silicon wafers were rinsed with ethanol and water to remove dust gathered during shipping and storage. Then, hydrolysed silicon surfaces (Si-OH) were obtained by placing the wafers into an 80°C piranha solution comprising 7.5 mL of 30% hydrogen peroxide and 17.5 mL concentrated sulphuric acid. After 25 min, the wafers were removed and rinsed with 18.2 MΩ deionized water (Direct-Q, Millipore), then blow-dried with a stream of argon, and subsequently treated with amine-functionalized organic self-assembled monolayers (SAMs). Then, in a dry box under argon, 0.5 mL of pure (3-Aminopropyl)triethoxysilane (APTES, Sigma), 0.5 mL DI water and 9 mL ethanol were mixed in a Petri dish on a stir plate. Then, piranha-oxidized wafers were submerged in this solution. A lid was placed over the Petri dish and the solution was stirred slowly with a stir bar for 5 h at room temperature. Afterward, the wafers were removed and rinsed with ethanol and 18.2 MΩ DI water three times each, and blow-dried with argon.
Following amino-functionalization, the prepared substrates were functionalized with nanocrystals by chemical bath deposition (CBD). This technique did not require elevated temperatures and has also been used successfully to deposit oxides, sulphides, selenides, tellurides, halides, sulphates, phosphates and arsenates [35]. According to this technique, the solutions of titania nanoparticles were prepared in PBS 10mM (the same concentration previously used to check the HSA-nanocrystals' interaction) and incubated with silicon amino-functionalized wafers for 30 h under stirring.
2.6 Silicon surface: contact angle measurements
To characterize the surface of the silicon wafers, contact angle measurements were carried out with a drop-shape analyser (Krüss Instruments, Germany), equipped with a charge-coupled device camera and an automatic dosing system for the liquid. Only water was employed as a liquid for the analysis using the sessile droplet method.
2.7 Silicon-nanocrystals-HSA: atomic force microscopy
Samples were imaged using a multimode atomic force microscope (AFM) (Digital Instruments, Veeco). RTESPA silicon nitride cantilevers were used. Cantilevers were 115–135 μm long and had a typical resonant frequency between 226–365 kHz, and a force constant of 20–80 N/m. The AFM was operated in tapping mode in order to minimize tip-sample interaction. Typical free air amplitudes were 300 mV (20 nm) and a high amplitude set-point was maintained to minimize sample/tip damage. All samples were imaged in air at ambient relative humidity. The images obtained contained 256 pixels per scan line. We characterized both films of TiO2 nanoparticles and the same wafer after the incubation with HSA protein. Prior to imaging, the wafers were washed with ultrapure water to remove the excess HSA not adsorbed at the surface. For the acquisition of force curves, the silicon wafers were incubated with the highest protein concentration (10 mg/ml) at 37°C for 1 h and then washed to remove the non-adsorbed protein. For each measurement, a single tip was employed. The adhesion forces values were an average of four measurements on a single point, performed twice on each sample.
3. Results and discussions
3.1 Physicochemical nanoparticles' features
As already described [18-21, 33], TEM images (Figure 1) revealed differently shaped nanocrystals. Particles used with the TA sample were of nearly spherical or slightly elongated size, between 2 nm and 7 nm (Figure 1 a). The TO sample (Figure 1 b) consisted of nanorods with an estimated average size of 3 nm (diameter) and 33 nm (length). The TB sample (Figure 1 c) showed nanocrystals with a short axis of roughly 5–6 nm and a long axis of 7–8 nm. These data are summarized in Table 1.
Characterization of TiO2 nanocrystals
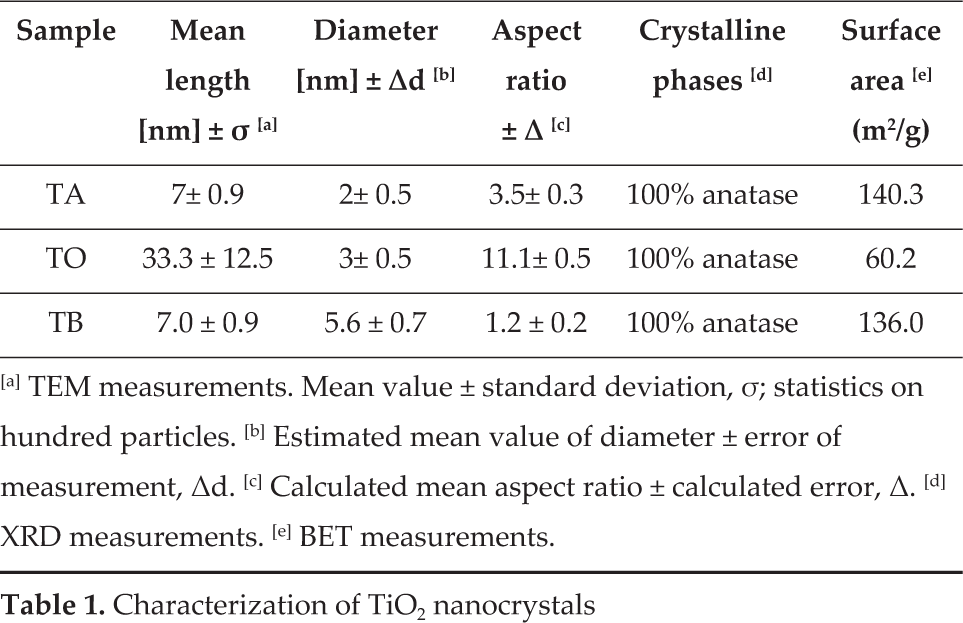
[a] TEM measurements. Mean value ± standard deviation, σ; statistics on hundred particles. [b] Estimated mean value of diameter ± error of measurement, Δd. [c] Calculated mean aspect ratio ± calculated error, Δ. [d] XRD measurements. [e] BET measurements.

TEM images of the different TiO2 samples: (a) TA, (b) TO, (c) TB
The surface areas were characterized by the Brunauer-Emmett-Teller (BET) surface area analysis. The determined BET specific surface areas were 140.3 m2/g for TA, 60.2 m2/g for TO and 136.0 m2/g for TB nanocrystals (Table 1).
Two important properties of nanoparticle dispersion are the surface charge and hydrodynamic diameters, since nanoparticles dispersed in aqueous solutions show surface ionization (for the adsorption of cations or anions) in the results of a surface charge, which develops an electric potential between the particles' surfaces and the bulk dispersion medium [36]. Depending on the measurement technique, surface charge can be represented by either the surface charge density (in the case of potentiometric titration) or the ζ potential (with electro kinetic methods). The point where surface charge density equals zero is defined as the point of zero charge (PZC), while the point where ζ potential equals zero is defined as the isoelectric point (IEP).
The hydrodynamic diameter analysis of nanocrystals was performed by dynamic light scattering (DLS) in ultra-pure water. The behaviour of our nano-titania was compared to the largely characterized commercial Aeroxide P25 (Table 2). The data obtained from DLS and ζ potential measurements that relate to physiological conditions (pH 7.4) and PCZ are reported in Table 2.
DLS characterization of TiO2 nanocrystals in ultra-pure water
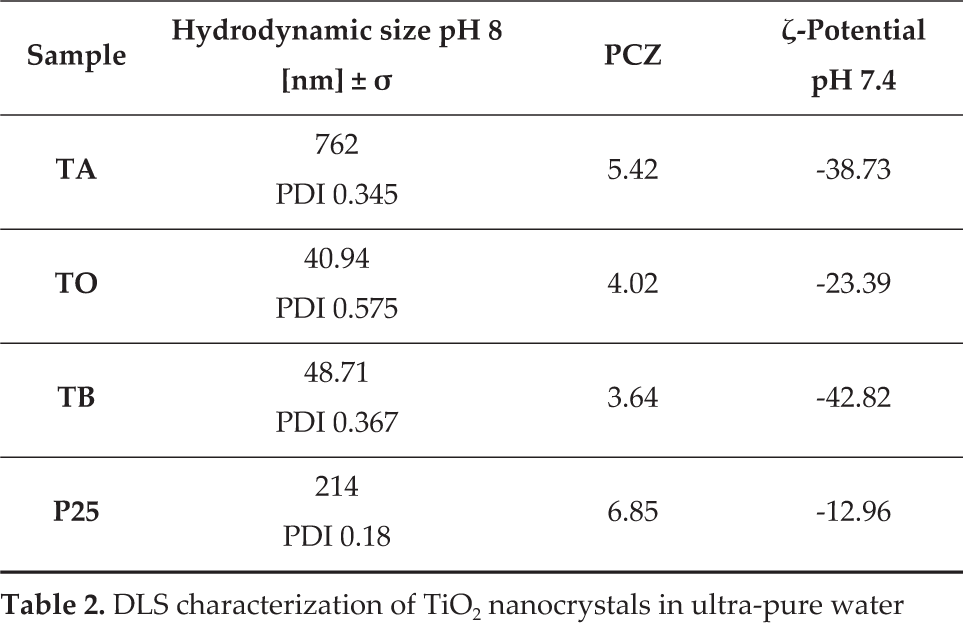
The nanoparticles size was measured at pH 8, because all of them exhibit a highly negative ζ potential value, leading to their electrostatic repulsions. The DLS analysis revealed a greater tendency of TA and P25 nanocrystals to form aggregate with a wide range of diameters (760 nm and 214 nm, respectively), despite their nominal size of a few nanometres. The TO and TB nanocrystals in ultra-pure water showed the formation of smaller aggregates of about 40–50 nm, but with a high PDI, indicating low polydispersity. The high polydispersity index (PDI) values in all samples, reported in the Table 2, confirmed the formation of aggregates.
Measurement of ζ potential as a function of pH was recorded in ultra-pure water, in a 10mM phosphate buffer and in a culture medium (Figure 2).
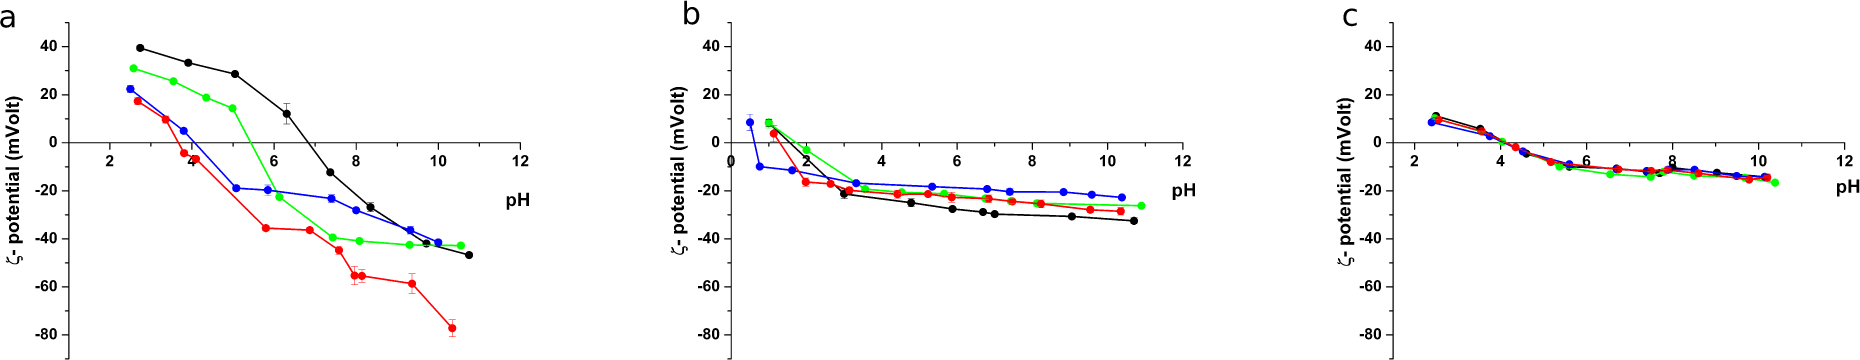
TiO2 samples' potential variation measured in different dispersants: (a) ultra-pure water; (b) PBS buffer; (c) RPMI culture media. The curves were measured after 2 min of sonication of the nanoparticles suspensions: TA (green), TO (red), TB (blue) and P25 (black). The acquisitions were repeated three times.
In ultra-pure water, we expected the hydroxyl group to cover the surface of the nanocrystals. As shown in Figure 2a, the PZC of our TiO2 nanocrystals resulted in a shift to acidic pHs with respect to commercial P25. This difference may have been due to the surface acid functionalization (acetic acid, boric acid and oleic acid) of the three samples.
The nanocrystals' ζ potential was measured in a 10 mM phosphate buffer (PBS) (Figure 2b), since we are interested in the proteins-nanoparticles interactions in PBS in order to simulate physiological conditions. In this case, there was adsorption of phosphate ions on the nanocrystals' surface and the ionic strengths of PBS led to a shift of ζ potential value towards more negative pH values.
The differences shown in ultra-pure water disappeared almost entirely and considering the pH of the physiological conditions (pH 7.4), the ζ potential was similar in all samples with values from −20 mVolt to −30 mVolt.
Finally, for mimicking biological conditions, we also monitored the trend of ζ potential value concerning the function of pH in a common culture medium, RPMI 1640 (RPMI). Measurements were performed by suspending TiO2 nanoparticles in a complete RPMI, supplemented with 10% foetal bovine serum (FBS). Prior to the measurement, we waited 30 minutes to ensure that the serum proteins could interact with the surface of the nanoparticles. Data shown in Figure 2c demonstrated that the differences among the TiO2 nanoparticles disappeared completely, compared with other considered conditions. The presence of the serum proteins presumably formed the so-called protein corona around the nanoparticles, removing differences in the nanoparticles' surface chemical functionalities, causing all of them to behave in a similar way.
All ζ potential experiments were carried out at the physiological temperature of 37°C.
3.2. Evaluation of the interaction of HSA and TiO2 on nanocrystals' surfaces
Protein adsorption on a solid surface has attracted significant attention in a wide range of disciplines: materials science, environmental sciences, geophysics, biomaterial science and technology and biomedical processes, among others. Many efforts have been made to better understand protein adsorption mechanisms. It has been suggested that proteins' solid surface interaction is extremely complex and depends on different factors including the nature of both proteins and solid surfaces, as well as the surrounding environments [37, 38].
Protein molecules were charged, after which we expected a modification of the ζ potential of titania nanocrystals following the interaction. We measured the ζ potential of the titania nanocrystals, previously incubated with HSA at different concentrations and prepared in PBS buffered solutions. As shown in Figure 3, similar results were obtained with all the nanoparticles.
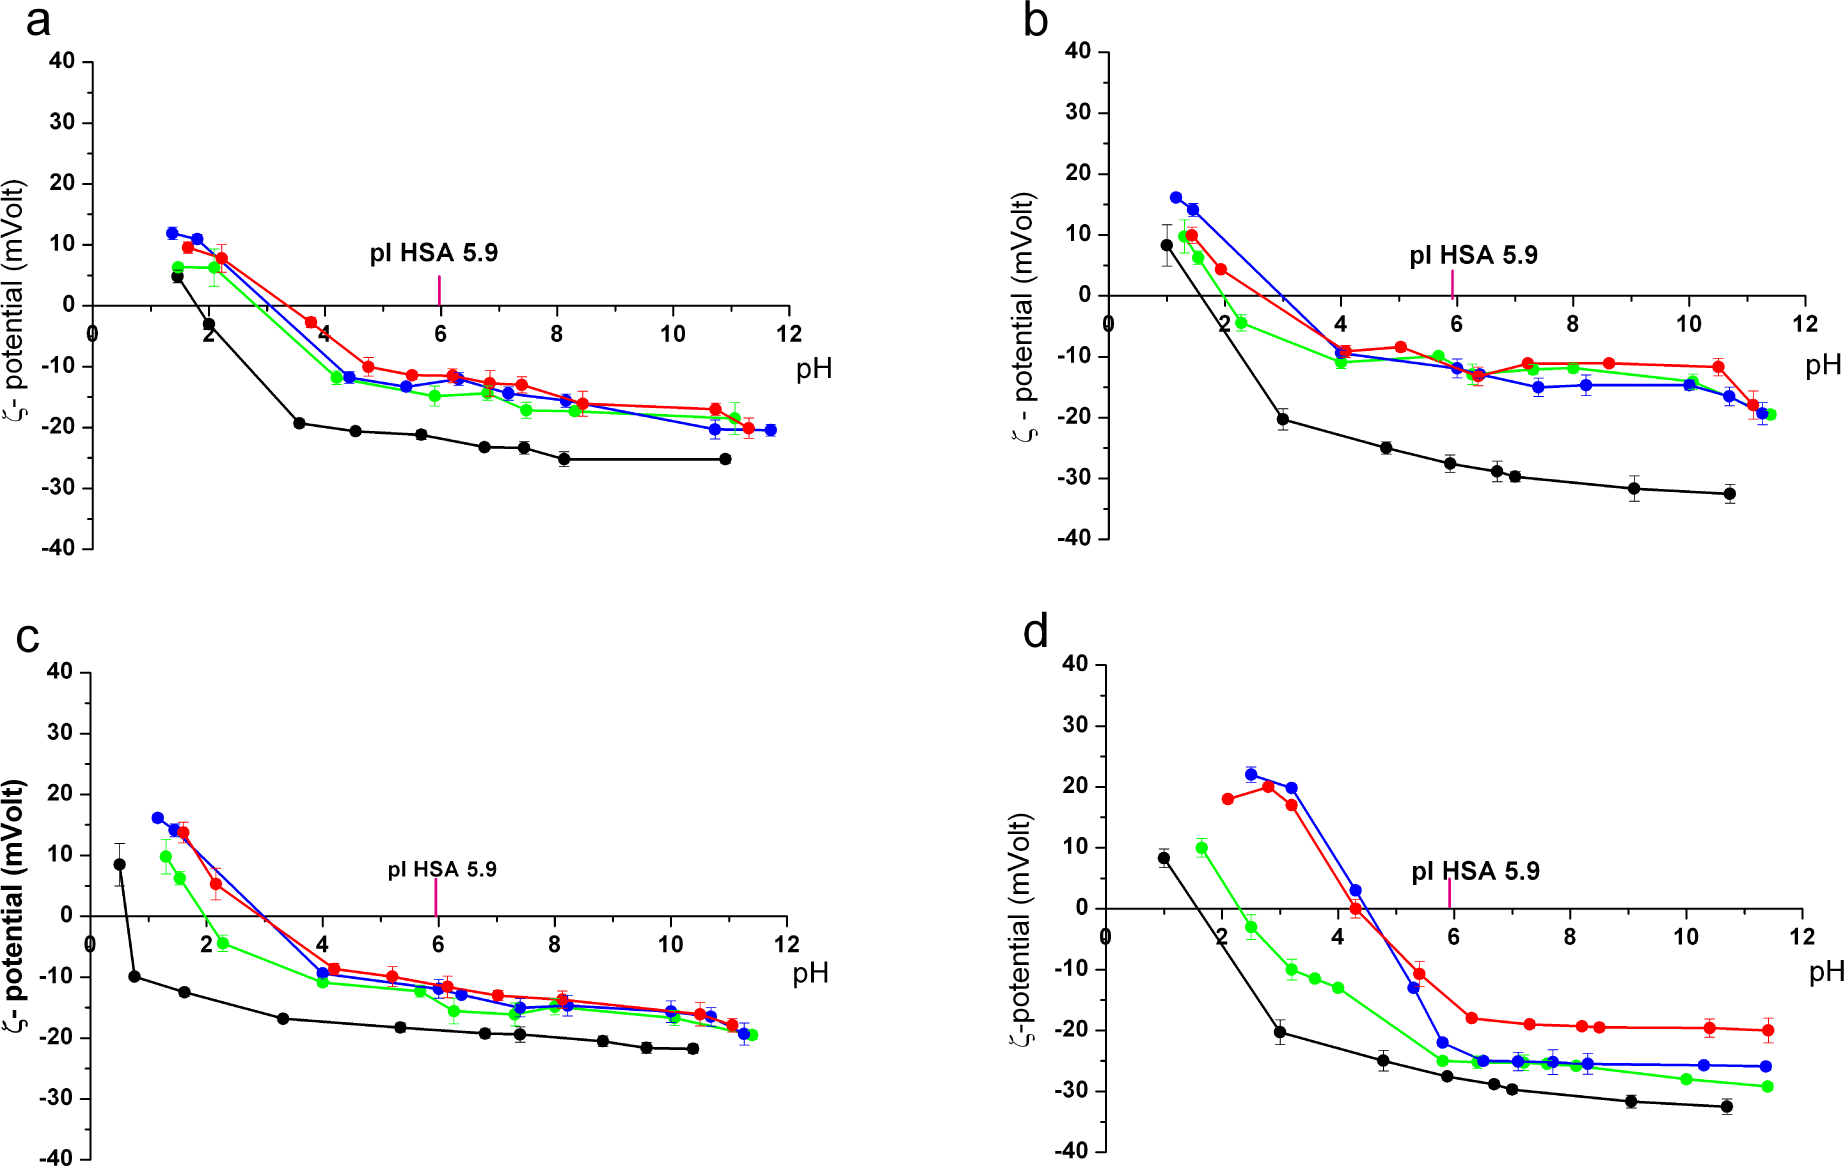
ζ potential variation after protein adsorption on (a) TA; (b) TO; (c) TB; (d) P25. Increasing albumin concentrations were associated with the nanoparticles' point of zero charge (PZC) shift toward the protein isoelectric point (pI). The curves are relative to different protein concentrations: 0.1 (green); 1 (blue); 10 (red) g/L.
The adsorption of HSA shows a shift in pH and also in ζ potential values toward the isoelectric point of the protein (5.9 pI HSA), but without reaching it. This phenomenon may have been due to the exposure of particle surfaces to the solvent.
The curve shapes were similar to those obtained when measuring the ζ potential after nanocrystal-HSA incubation with a complete culture medium; as such, we were able to assume a similar protein corona masking effect. In a previous work, it was found that proteins promote the agglomeration of inorganic nanoparticles [39]. The size distribution of TiO2-HSA agglomerates was studied using DLS analysis; Table 3 shows the results obtained with the highest concentration of HSA used. As expected, the presence of protein increased the size of agglomerates.
DLS characterization of TiO2 nanocrystals after interaction with HSA at a concentration of 10mg/ml

It was then evaluated whether the interaction was reversible or irreversible. If the bonding was reversible, it was expected that when re-suspending the protein-nanoparticles conjugates in a fresh protein-free buffer and applying a negative protein concentration gradient, the protein would be removed from the nanoparticles' surface, with a return to the initial ζ potential value. On the contrary, in the case of an irreversible interaction, after washing the conjugate, ζ potential value was expected to remain the same. The ζ potential measurements of TiO2 nanocrystals previously incubated with HSA in PBS, recorded after a washing cycle in PBS, are reported. We performed the experiment for all the concentrations of tested has; Figure 4 shows only the results obtained with the lower concentration (0.1g/L). In all considered cases, the results were the same. The black curve represents the measured PBS, while the green curve was recorded after HSA adsorption in a phosphate buffer; the remaining two curves, blue and red, refer to the ζ potential measurements after one or five cycles of washing, respectively. It was easily noticeable that the curves recorded after the washing cycles did not lead to a shift in the ζ potential values measured at different pH; the green, blue and red curves were almost coincidental and as such, we can assume that the interaction between nanocrystals and proteins was irreversible.

ζ potential variation after washing (a) TA; (b) TO; (c) TB; (d) P25. The curves were acquired for the sample prior to HSA adsorption (black); after the incubation with a high (10 mg/ml) HSA protein concentration (green); one washing cycle (blue); five washing cycles (red).
3.3 Evaluation of HSA amount interacting with nanoparticles
As explained in the experimental section, to investigate the proteins' affinity for the TiO2 nanocrystals, buffered solutions of HSA at increasing concentrations (0,1–10 mg/ml) were with the nanoparticles incubated for one hour. To measure the amount of HSA interacting with the nanoparticles, a BCA assay was performed.
Figure 5 shows a horizontal dotted line that indicates the theoretical protein monolayer value calculated from the native protein size and from the TiO2 nanocrystals' specific surface area values (assuming a side-on (47.5 × 9 nm) adsorption in the protein native conformation).

HSA amounts, surface interacting with the different TiO2 nanocrystals: TA (black); TO (green); TB (blue); P25 (red). Data were expressed as HSA amount adsorbed per square metre versus the free protein concentration in the supernatant, after 1 h of incubation. The dotted horizontal line indicates the HSA adsorbed amount needed to build up a theoretical monolayer on a flat surface.
The protein amount adsorbed on the nanoparticles' surface and the curve shapes differed significantly among the samples, but showed similar behaviour for P25 and TO, and for TA and TB. As shown in Figure 5, as expected, the amount of protein increased alongside an increase in concentration and reached a plateau at values lower than the theoretical monolayer for TA and TB nano-titania. Instead, the amount of protein adsorbed increased and overcame the theoretical monolayer for the other two samples, P25 and TO. These data suggest that HSA has a higher affinity for P25 and TO surfaces than for TA and TB surfaces.
We justified this behaviour according to nanoparticle size: TA and TB nanocrystals were smaller to P25 and TO; presumably, lower primary particle size led to nanocrystal aggregation and as a result, the number of interaction sites with HAS was reduced.
These results are in accordance with literature [40-43] that reports that in addition to shape, size and chemical functionalization can also influence protein adsorption on nanoparticles' surface. Nanoparticle composition, hydrophobicity, the presence of specific functional groups, pH and temperature have been shown to affect protein adsorption on the surface of nanoparticles. Adsorption of a protein on the nanoparticle surface also depends on the affinity of the protein for the nanoparticles' surface and its ability to completely occupy said surface.
3.4 Nanocrystals' surface tailoring of silicon wafers and HSA adsorption characteristics
HSA adsorption has been investigated in the past ex situ by means of AFM on different model surfaces, including mica [37], graphite [38] and self-assembled monolayer surfaces [44].
As described in the experimental section (sect. 2.5), the substrates were hydrolysed and subsequently treated with amino-propyltriethoxysilane (APTES) to obtain a SAM, where nanoparticles' monolayers were produced by chemical bath deposition (CBD). At this stage, it was important to consider the ζ potential of the substrate and the resultant electrostatic attraction or repulsion between the precipitating particles and the substrate. The ζ potential is influenced by pH, as are the particles.
The hydrolysed Si wafer presented low isoelectric points and exhibited negative ζ potentials at almost all pH values, while the Si-amine-terminated layer gave a relatively high IEP and exhibited positive ζ potentials in the pH range studied in this paper. By exposing the various nanoparticle suspensions to the Si-amine-terminated wafers, a predictable pattern of film formation was expected to appear. For combinations of nanoparticles and substrate where the suspension pH was between the IEPs of the components, it was predicted that film formation and growth would be promoted [35].
To check the hydrophilicity of the substrate before and after APTES functionalization, the contact angles of water droplets were measured with a contact-angle goniometer (Rame-Hart Inc.). In the first step, after incubation with a piranha solution, only substrates with advancing angles of < 10° were accepted.
The wafers were exposed to the TiO2 nanoparticle suspension and the coverage produced was measured by AFM. Goniometer measurements were again employed to ensure successful depositions. P25 and TO samples were more hydrophilic, exhibiting advancing contact angles between 27°-29°; TA and TB samples presented contact angles between 43°-45°. From contact angle measurements, substrates with angles below 90° were considered hydrophilic. Different types of surfaces were expected for different interaction behaviour with HSA.
During the last few decades, several methods have been used to study protein-solid surface interactions and to measure their interaction forces [45, 46]. Recently, direct high-resolution microscopic observations have been extensively used to investigate these interactions. Atomic force microscopy (AFM) is an ideal tool for force measurements, with high spatial resolution at a molecular scale in flexible operating environments. The AFM tip-solid sample surface interaction can be monitored and the obtained information can be associated with van der Waals forces, hydrogen bonding, electrostatic forces and hydrophobic interaction [47].
Figure 6 (a) shows representative AFM images of the P25 film (height channel); (b) (c) (d) and (e) are 3D projection images of the four nanoparticle films obtained by CBD, as described in the experimental section. As confirmed by the profiles in Figure 7, the film technique used was able to obtain the maximum peak heights of a few nanometres.

AFM characterization: (a) height channel P25; (b) P25; (c) TA; (d) TO; (e) TB, 3D projection of height channels

TiO2 nanocrystal film profiles: (a) TA; (b) TO; (c) TB; (d) P25
Sample roughness was also estimated by AFM and the results are shown in Table 4.
TA, TO, TB and P25 films roughness measured by AFM. The results are the mean of three images

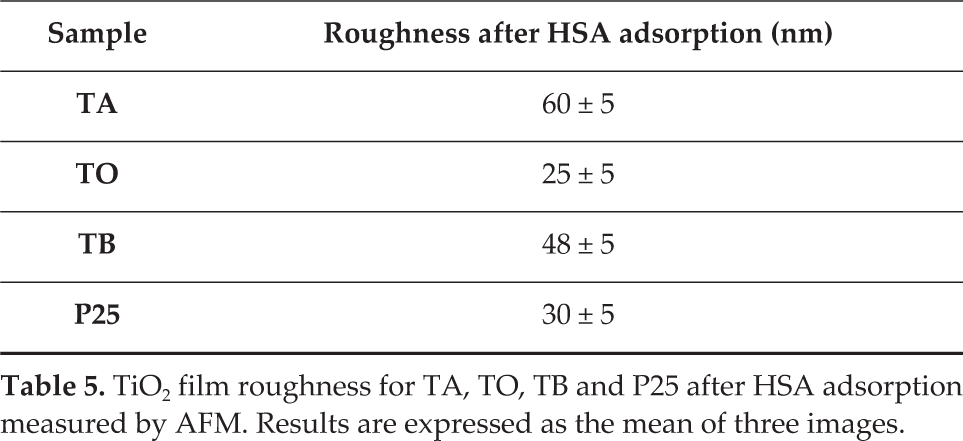
In the final step, the TiO2 substrates were exposed to the highest concentration of HSA. Following protein adsorption, the samples were characterized by AFM (Figure 8) by studying their roughness and profiles (Figure 9), morphology and adhesion force. Table 5 reports roughness; surfaces became smoother following protein adsorption, suggesting the propensity of HSA to cover the nano-titania film to form a smother surface, in turn suggesting the propensity of HSA to form a monolayer rather than stacked aggregates.
TiO2 film roughness for TA, TO, TB and P25 after HSA adsorption measured by AFM. Results are expressed as the mean of three images.
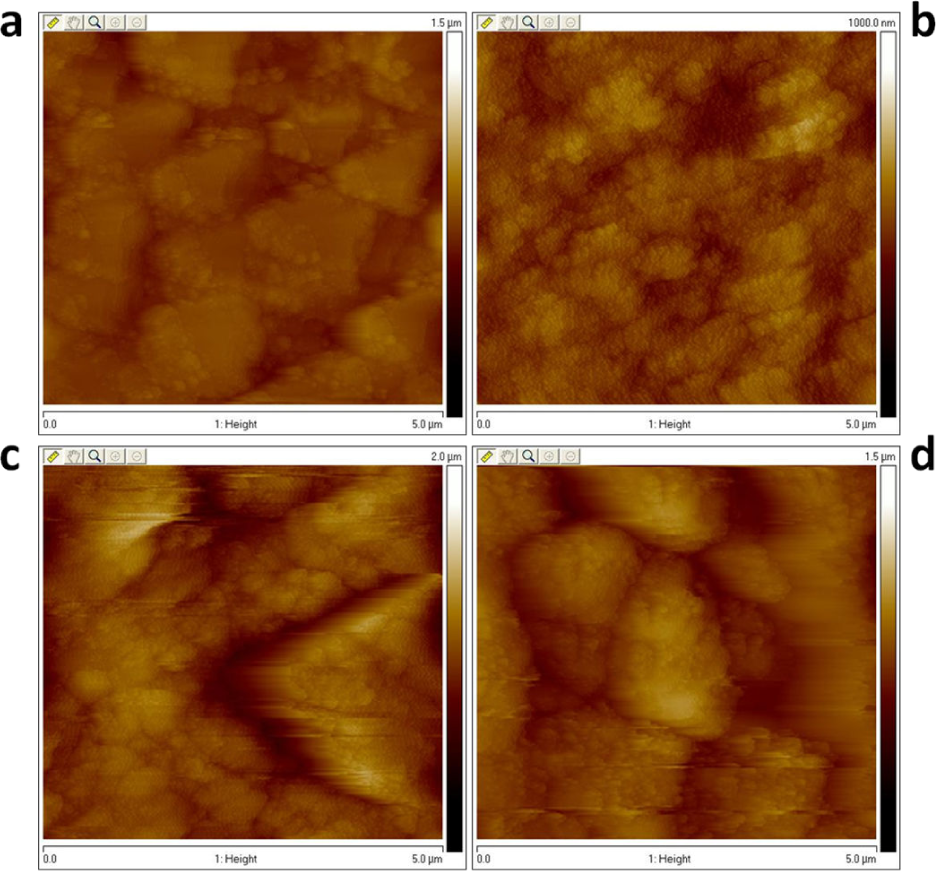
AFM characterization – height channel: (a) P25; (b) TA; (c) TB; (d) TO, all functionalized with HSA

TiO2 film profiles for (a) TA, (b) TO, (c) TB and (d) P25 covered with HSA
As reported by Bacakova [17], hydrophilicity led to the tendency of HSA molecules to interact with the surface, inhibiting HSA self-assembly. The results of the contact angle suggest that our substrates had a higher degree of hydrophilicity; therefore, by analysing the zeta profilers of height channels, we found that film thickness increased after the interaction with HSA. This increase and the hydrophilicity suggest the presence of layers of protein in native conformations.
3.5 Adhesion and force curves
A method for studying the protein-substrates interaction is to record the adhesion curves. In this approach, indentation single point force curves were used. The adhesion force curves were acquired with a protein concentration of 10 mg/ml.
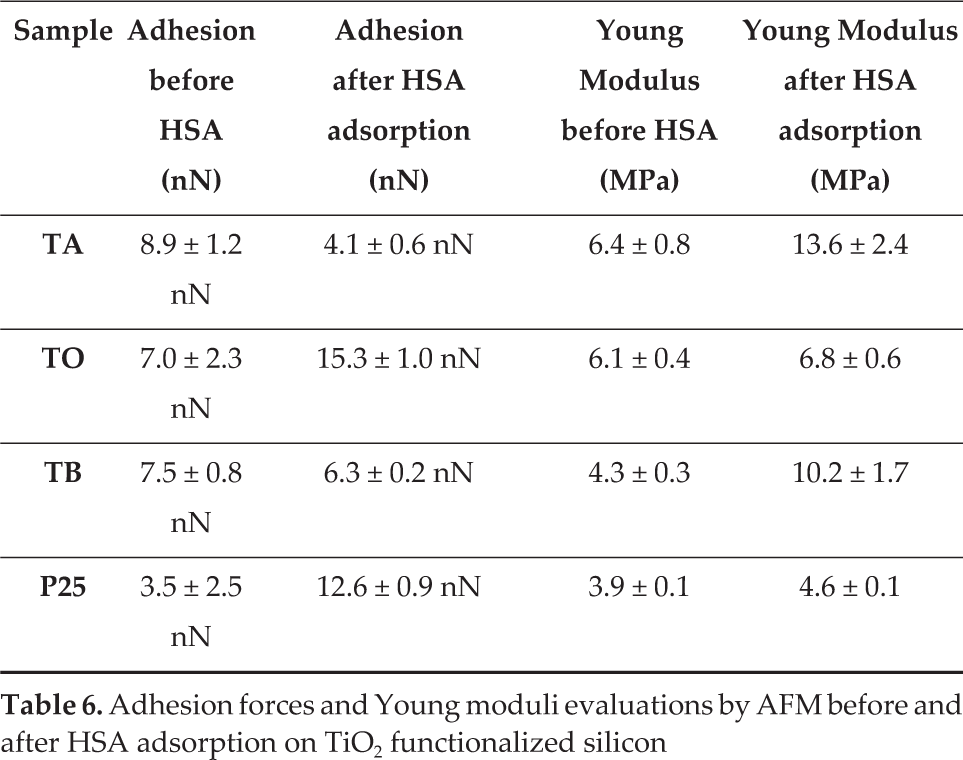
The adhesion force on the clean silicon wafer (26.4 ± 1.4 nN) was checked first, then for the nanocrystal-functionalized wafer prior to and following HSA incubation. The strongest adhesion force was observed on the clean silicon surface, partly due to water molecules exerting a large force on the tip. Table 6 shows the adhesions for silicon-supported HSA-TiO2 surfaces. As expected, compared to TB and TA, the degree of hydrophilicity influenced the adhesion forces, with higher values for P25 and TO.
Adhesion forces and Young moduli evaluations by AFM before and after HSA adsorption on TiO2 functionalized silicon
Protein conformational changes can influence the different substrate-albumin adhesion forces.
Young moduli values were in agreement with the above discussed results. In TA and TB samples, albumin was rearranged in a more globular manner and the measured stiffness was lower than for the other two samples, where there was a better HSA distribution, which was also confirmed by a lower roughness.
4. Conclusions
In this study, HSA interaction with four samples of anatase TiO2 nanocrystals (TA, TO, TB and commercial P25) with different sizes, shapes and surface functionalization was evaluated. The interaction of nanocrystal surfaces with water, PBS and RMPI was evaluated according to ζ potential measurements: PCZ in water was shifted towards a more acidic pH for the synthesized nanocrystals compared to the commercial P25; in PBS, phosphate ion adsorption caused a decrease in Z potential and a PCZ shift for all the samples; in a RPMI culture medium supplemented with FBS, differences among nanoparticles disappeared due to a protein corona effect around the nanoparticles. For nanocrystals incubated with HSA in PBS, similar results were obtained for all nanoparticles, due to a protein corona masking effect. Moreover, the HSA-nanocrystal surface interaction was irreversible. The amount of HSA interacting with nanocrystals was evaluated and showed values lower than the theoretical monolayer for TA and TB, while for P25 and TO, HSA showed a higher affinity, presumably because a lower primary particle size led to nanocrystals' aggregation, reducing the HSA-nanocrystals interaction sites. Nanocrystals' functionalized silicon wafer-HSA interactions were studied by AFM and nanoparticle films of a few res were measured; HSA did not cover all the nanocrystals in the same manner. From the measurement of adhesion force curves, higher values were obtained for P25 and TO, compared to TA and TB, where the HSA protein was found to arrange in a more globular manner, as deduced from surface roughness measurements. Moreover the degree of hydrophilicity influenced the adhesion forces of HSA on nanocrystal surfaces.
The evaluation of protein adsorption was important, since it influences the biocompatibility of a material. The obtained data suggest that particle surface curvature may modulate the HSA amount interacting with the nanoparticles and possibly their surface affinity. Since albumin interaction with NPs has been shown to trigger inflammatory responses, the observed lower protein affinity for smaller TiO2 nanocrystals may correspond to their possibly higher biocompatibility when compared to bigger TiO2 nanocrystals.
Footnotes
5. Acknowledgements
This work was supported by PON, Avviso prot. n. 84/Ric. del 2 marzo 2012 NAnoMAteriali per l'edilizia SosTEnibile (NAMASTE) prot. PON04a3_00107 CNR-NANO.