
Abstract
In a hydrothermal preparation of crystalline magnetite (Fe3O4) nanoparticles, the influence of the experimental parameters (initial molar ratio of ferrous/ferric ions, initial concentration of ferrous ions, and heating time), and their interactions, on the particle formation was studied using response surface methodology (RSM), based on a statistical design of experiments (DOE). As indices indicating particle formation and crystallization, the variation in the particle diameter and crystallite size with the synthesis conditions was examined. The crystallite size was greatly affected by both the initial ferrous/ferric ion molar ratio and the heating time, whereas the particle diameter strongly depended on the heating time, and on the interaction between the initial ferrous/ferric ion molar ratio and the initial concentration of ferrous ions. The results from a statistical analysis suggest that the polycrystalline Fe3O4 nanoparticles form via crystal growth and/or thermal aggregation, after nucleation during hydrothermal treatment.
Keywords
1. Introduction
Nanometre-sized magnetic materials have received intensive attention because of their vital applications in numerous areas, such as ferrofluids, medical diagnostics, advanced magnetic materials, and catalysts [1-4]. In particular, magnetite (Fe3O4) nanoparticles are useful because of their potential in biomedical applications [5] (e.g., magnetic resonance imaging [6] and targeted drug delivery [7]). Various methods of preparing Fe3O4 nanoparticles have been developed [8]. Among them, liquid-phase synthesis methods, such as micro-emulsion [9], thermal decomposition of iron complex in organic solvent [10], and co-precipitation of ferrous ions and ferric ions in alkaline medium [11,12], are effective for obtaining Fe3O4 nanoparticles relatively easily. Notably, the hydrothermal technique can provide highly crystalline Fe3O4 nanoparticles with good magnetic properties, because the Ostwald ripening allows for crystal growth [13].
During the hydrothermal preparation, the formation of Fe3O4 nanoparticles is sensitive to the synthesis conditions – such as the reaction time, temperature, and concentration of the reactive species – since the activity of reactants can increase under hydrothermal conditions [14,15]. In our previous studies, we have experimentally investigated the size control of Fe3O4 nanoparticles under various hydrothermal conditions and found some interesting results [16-18]. For example, the iron hydroxides as a precursor of Fe3O4 were not co-precipitated, but sequentially precipitated to control the supersaturation and then hydrothermally heated, which demonstrated that the formation of iron hydroxides was one of the most important factors affecting the size of resultant Fe3O4 nanoparticles [18]. Therefore, to precisely control the crystal growth of Fe3O4 nanoparticles under proper conditions, the influence of hydrothermal conditions on particle formation must be fully understood. However, the details have so far remained unclear.
One powerful tool for analysing the degree of the effect of each experimental parameter is response surface methodology (RSM), based on a statistical design of experiments (DOE), which can lead to the optimization of synthesis conditions. A number of studies have applied the RSM approach to analyse the preparation of Fe3O4 nanoparticles. Forge et al. employed RSM to optimize the synthesis conditions in a co-precipitation method using aqueous and organic media, and determined the important factors for controlling the particle size in each medium [11]. To the best of our knowledge, however, the application of RSM to the modelling and analysis of hydrothermal synthesis has not yet been reported.
For this paper, the influence of the experimental parameters of a hydrothermal preparation of Fe3O4 nanoparticles on particle formation was studied using RSM. We focused on the variation in the particle diameter and crystallite size as indices for particle formation and crystallization under the synthesis conditions. Based on the results obtained using the statistical analysis method, the experimental parameters suitable for precisely controlling the particle formation are discussed.
2. Experimental
All chemicals of analytical reagent grade were purchased from Wako Pure Chemical Industries and used as received without further purification. Crystalline Fe3O4 nanoparticles were hydrothermally synthesized after co-precipitation of ferrous and ferric ions at room temperature. Predetermined amounts of ferrous sulphate (FeSO4) and ferric chloride (FeCl3) were dissolved in 40 mL of deionized and deoxygenated water in a stainless steel autoclave. In total, 20 mL of 1 kmol/m3 sodium hydroxide (NaOH) solution was added to the solution at a constant rate of 3 mL/min, under vigorous stirring with a magnetic stirrer in an argon atmosphere. The amount of NaOH added was excessive to the stoichiometric formation of iron hydroxides – Fe(OH)2 and Fe(OH)3 – to ensure that the pH value of the solution was higher than 13. Fe3O4 forms according to the following chemical reaction, which indicates that an initial Fe2+/Fe3+ ion molar ratio of 0.5 is stoichiometrically required for Fe3O4 to form:

In this study, however, the initial Fe2+/Fe3+ ion molar ratio was varied to alter the crystal growth of Fe3O4. After the air in the autoclave was replaced with argon to prevent oxidation, the sealed autoclave was maintained at 120°C in an oven, for a given heating time. The product was washed with deionized and deoxygenated water, and dried overnight under a vacuum at 30°C.
To model and evaluate the influence of synthesis conditions on the Fe3O4 nanoparticle formation, three independent variables – namely, the initial Fe2+/Fe3+ ion molar ratio, initial concentration of Fe2+ ions before addition of the NaOH solution, and heating time (denoted as A, B, and C, respectively) – were employed as the representative parameters. The experiments were designed using a central composite design (CCD) [19], which consisted of eight corners and one centre point of the cubic region, and two repetitions. Table 1 summarizes the levels and ranges of independent variables. The plus and minus signs indicate the upper and lower limits of each range, respectively. The zero corresponds to the centre point. Based on our previous study [16], the independent variables were determined as follows: A was varied from 0.5 to 2.0 by adjusting the amount of FeCl3 under a given FeSO4 concentration, and B and C were varied from 16.7 to 33.3 mol/m3 and from 1 to 20 h, respectively. The experiments of Run No. 10 and 11 were performed to confirm the reproducibility. To minimize unexpected errors, the order of experiments was randomized.
Levels of independent variables and experimental conditions

Notes: A = initial Fe2+/Fe3+ ion molar ratio, B = initial concentration of Fe2+ ions, and C = heating time
The powder X-ray diffraction (XRD) patterns of the products were measured with CuKα radiation ranging from 2θ=10 to 80°, at a scanning rate of 1°/min, using a Rigaku RINT-1500 powder X-ray diffractometer. The lattice constant was also determined as being between 0.838 nm and 0.841 nm from diffraction angles that exhibited high intensity peaks, which was closer to the standard value of Fe3O4 (0.840 nm) than that of maghemite (0.835 nm). The XRD analysis confirmed that the products had a single phase of Fe3O4 in all synthesis conditions. The average crystallite size was calculated from the full-width at half-maximum (FWHM) of the (311) diffraction peak of Fe3O4 observed at 2θ=35.5° using Scherrer's formula. The hydrodynamic size distributions (number basis) were measured by dynamic light scattering (DLS; Zetasizer Nano ZS, Malvern Instruments) for the colloidal solutions of well-dispersed nanoparticles by ultrasonication, and the median particle diameter was determined. Magnetic properties (i.e., magnetization hysteresis cycle) were analysed using a superconducting quantum interference device (SQUID) magnetometer (MPMS XL, Quantum Design) at 300 K, over a magnetic field range of −10 kOe to 10 kOe.
3. Results and Discussion
Table 2 lists the crystallite size and particle diameter of Fe3O4 nanoparticles obtained under each synthesis condition. To analyse the degree of the effect of each experimental parameter and their interactions on the crystallite size and particle diameter, an analysis of variance (ANOVA), based on a linear statistical model, was applied. First, the sum of squares was calculated from the experimental results, using commercially available software (Design-Expert, version 7.1.5, Stat-Ease). Then, the p-value was determined using the sum of squares and the degrees of freedom. The p-value indicates the probability used to determine statistically significant effects in the model. A p-value close to zero indicates that the effect of the experimental parameter is significant; however, if a p-value is larger than 0.1, then the effect is not significant.
Crystallite size and particle diameter of products

The p-values were calculated for various combinations of experimental parameters. In the ANOVA for the crystallite size, when A, B, C, AB and BC were selected (where AB and BC indicate the interactions between A and B, and between B and C, respectively), their p-values were in the lowest level compared to those for other combination sets (Table 3). The significant factors affecting the crystallite size can be determined based on a comparison between the p-values. According to Table 3, A showed the lowest p-value and C the second lowest. However, the interactions between A and B and between B and C were relatively small, and the effect of B was the smallest among the factors. Therefore, the order of efficacy of the factors on the crystallite size was found to be A > C > BC > AB > B. This result implies that A is the most important factor in obtaining Fe3O4 nanoparticles with high crystallinity.
ANOVA results for the crystallite size

In addition to the ANOVA, a polynomial model including interactions and quadratic terms was generated for all response variables, by using a multiple linear regression analysis (MLRA) approach [20,21] to construct the three-dimensional surface plot. A general form of the MLRA model can be represented as follows:

where β0 is the intercept representing the arithmetic average of all quantitative outcomes of 11 runs; β1 to β10 are the coefficients computed from the observed experimental values of the crystallite size Y; and A, B and C are the coded levels of the independent variables. The three-dimensional surface plots of the crystallite size versus A and C are shown in Figure 1, generated by the Design-Expert software. The response was represented by an increasing surface with increases of A and C. The obtained surface suggests that the crystallites gradually grow using the surplus Fe(OH)2 at high A regardless of B, which may be attributed to the Schikorr reaction [22]:

Three-dimensional surface plots for average crystallite size in initial Fe2+ ion concentrations (B) of (a) 16.7 mol/m3 and (b) 33.3 mol/m3

When B was high, however, the crystallite size varied slightly with variations in A and C when compared to the case of low B; nucleation rapidly occurred at high B, which might have reduced the effect of the crystal growth using surplus Fe(OH)2.
Subsequently, using the particle diameter data, the particle formation was analysed in an identical manner as described above. In this analysis, the smallest p-values were obtained when A, B, C, and AB were used (Table 4). The order of efficacy of the factors on the particle diameter was found to be AB > C > B > A. In contrast to its effect on crystallite size, the interaction between A and B was confirmed to have a large effect on particle diameter. Table 2 demonstrates that the particle diameter was larger than the crystallite size in all products, indicating that the Fe3O4 nanoparticles were polycrystalline. Thus, we can conclude that the size of Fe3O4 nanoparticles can increase under hydrothermal conditions not only as a result of crystal growth from the nuclei, but of thermal aggregation as well. Accordingly, particle formation by aggregation may be affected by the interaction between A and B.
ANOVA results for the particle diameter

Figure 2 shows the three-dimensional surface plots of the particle diameter versus A and C. A showed a large effect at high B, which was a similar result to that found for the crystallite size, shown in Figure 1. However, at low B, C had a remarkably large effect on the particle diameter. When B was low, even at high A the amount of surplus Fe(OH)2 was relatively small, resulting in a low effect of the crystal growth on the particle formation. By contrast, when both A and B were low, the surplus Fe(OH)2 had little effect and the Fe3O4 nanoparticles grew rapidly, via the thermal aggregation of Fe3O4 and/or iron hydroxides forming as a result of co-precipitation. When both A and B were high, however, the remarkable crystal growth of Fe3O4 nanoparticles might have occurred due to the surplus Fe(OH)2.
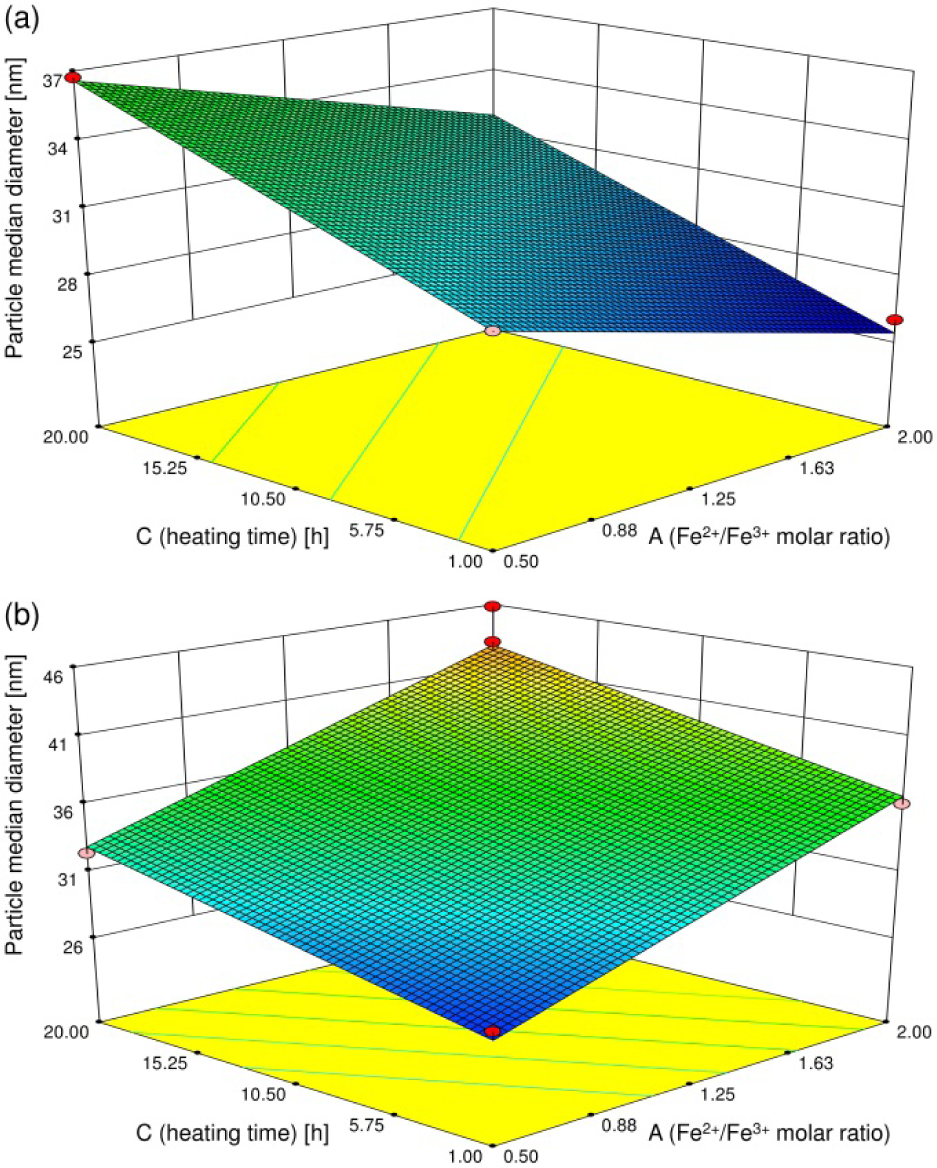
Three-dimensional surface plots for median particle diameter in initial Fe2+ ion concentrations (B) of (a) 16.7 mol/m3 and (b) 33.3 mol/m3
The results above suggest that polycrystalline Fe3O4 nanoparticles formed under hydrothermal conditions according to a possible mechanism that mainly consists of two phenomena – crystal growth and thermal aggregation – which varies remarkably depending on the synthesis conditions (in particular, the amount of ferrous ions). Therefore, we can conclude that the initial Fe2+/Fe3+ ion molar ratio (A) is one of the most important factors affecting the formation of Fe3O4 nanoparticles. In this paper, A was greatly varied from 0.5 to 2.0 according to the central composite design. Thus, experiments where A is varied by smaller amounts might lead to more detailed information relating to the crystal growth mechanism [16]. This analysis will be our future work and the results will be reported elsewhere.
Table 5 lists the saturation magnetization and coercivity of the products. Although the saturation magnetization values were lower than that of the corresponding bulk (92 emu/g) due to their smaller size, the products had a relatively high saturation magnetization compared with maghemite nanoparticles with a crystallite size similar to that of the products [23]. This suggests that the products are pure Fe3O4. In general, the magnetization tends to vary depending on the crystallinity. However, the saturation magnetization per unit mass obtained in this study shows no clear tendency, as the saturation magnetization is not so greatly affected by the crystallite size [24]. Furthermore, the products may contain a tiny amount of adsorbed water even after drying, which can increase the variation of the magnetization. Thus, the ANOVA for the saturation magnetization data showed no clear correlation with the experimental parameters, or their interactions. Therefore, using the coercivity data, the effect of the factors on the magnetic properties was analysed. After the p-values were calculated for various combinations of factors, the significant factors affecting the coercivity were determined to be A, B, C, and AC, and the order of efficacy was C > AC > A > B, as shown in Table 6.
Magnetic properties of products

ANOVA results for the coercivity

Figure 3 shows the three-dimensional surface plots of the coercivity versus A and C. As with the crystallite size (Figure 1), A and C both had a large effect on the coercivity, which was independent of B. When A and C were increased at low C and low A, respectively, the coercivity greatly increased due to increases in the crystallite size. However, when A and C were high, variation in the coercivity was slight. In general, the Fe3O4 nanoparticles with a crystallite size smaller than approximately 20–30 nm have a single-domain structure, and their coercivity increases when the crystallite size increases. However, as the crystallite size increases further, the magnetic domain structure changes from single-domain to multi-domain, resulting in a decrease in the coercivity [25]. Our products with relatively large average crystallite sizes can consist of both the single-domain and multi-domain Fe3O4 nanoparticles, which may lead to a slight variation in the coercivity.

Three-dimensional surface plots for coercivity in initial Fe2+ ion concentrations (B) of (a) 16.7 mol/m3 and (b) 33.3 mol/m3
4. Conclusions
The hydrothermal synthesis of crystalline Fe3O4 nanoparticles was performed under different conditions of initial Fe2+/Fe3+ ions molar ratios (A), initial Fe2+ ion concentrations (B) and heating time (C), to investigate the influence of experimental parameters on particle formation. The order of efficacy of the effective factors on the crystallite size was A > C > BC > AB > B, whereas the order for particle diameter was AB > C > B > A. This result implies that the formation of polycrystalline Fe3O4 nanoparticles progresses according to two phenomena – i.e., crystal growth and thermal aggregation – and is greatly affected by the synthesis conditions. The coercivity was closely correlated with A and C as well as the crystallite size. The dependence of the coercivity on the crystallite size was explained by the change in the magnetic domain structure. Consequently, the three parameters we employed were found to be important factors in the control of particle formation affecting magnetic properties.