
Abstract
There is a perception that engineers experience challenges in areas such as communication, conflict resolution, and leadership. Defensive routines are actions implemented as a result of being in an embarrassing or threatening situation. This research uses a case study approach to measure whether defensive routines are more common in engineering managers or non-engineering managers. Twenty-seven managers created case studies based on their unique experiences as managers. These case studies were scored, and the results of this research indicate that engineering managers employ defensive routines more commonly than non-engineering managers.
1. Introduction
Successful engineering managers are able to work in technology-based organizations with rapid production cycles [1]. Corporations consider success as delivering a quality product ahead of schedule and/or below cost, leading a team to be as efficient as they can, and motivating the team to reach their highest potential. Research indicates that to be an effective manager, communication and trust are key indicators that should be present [1, 2]. In addition, other skills such as leadership, collaboration, and active learning [1] are needed to be an effective manager.
There is considerable research on engineers and their behaviours, but there is a need for research that focuses on developing engineers to assume leadership roles in technology-based organizations [1]. It can be difficult for an engineering student to transition to being a working engineer or an engineer managing large projects and/or individuals. Much of the research supports that the engineering education has a direct effect on how engineers operate in the working environment. Some engineers believe that engineering education prepares them to take the data provided to them and calculate answers from the information [2]. However, universities are criticized for producing technically competent students, but not training them for the real world work environment [1]. In addition, when individuals are commonly rewarded for superior work, they may start to act defensively to save face when their work is considered average or less than superior. Research has shown that effort is needed to integrate recent engineering graduates into the work environment through socialization. This method allows new engineers to learn their roles, attain knowledge of job skills, and assimilate into the organization [3]. Furthermore, some believe that engineers move into management because the technical path is truncated once a certain level is achieved [3]. Research suggests that there are certain leadership skills needed to be productive and successful in these different phases such as communication, leadership, collaboration, and active learning [1].
Defensive routines are defined as ‘actions or policies that prevent individuals from experiencing embarrassment or threat’ [4]. According to Argyris [5], defensive routines are developed early in life, as early as 12 years old. Behaviours defined as defensive routines may vary; however, the approach is using these behaviours consistently [5]. Defensive routines are a result of ‘Model I’ behaviour, which is based on the desire to win and minimize negative feelings, while ‘Model II’ behaviour focuses on seeking valid information through inquiry and making an informed choice regardless of who wins or loses [6]. This research investigates whether engineering managers exhibit defensive routines more than non-engineering managers.
2. Literature review
The literature review is divided into four sections. Organizational defensive routines, individual defensive routines, self-monitoring behaviours, and engineering manager behaviours are each relevant to the research question of whether engineering managers exhibit defensive routines more than non-engineering managers.
2.1 Organizational Defensive Routines
Defensive routines are defined as ‘any policies or actions that prevent the organization from experiencing pain or threat and simultaneously prevent learning how to correct the causes of threat in the first place’ [7]. Organizational defensive routines often become rooted in the organizations, causing difficulty in the ability to change organizational cultures. Organizational traditions are familiar and can trigger resistance due to moving outside of organizational norms. The most common defensive routine used in organizations is the mixed message. Mixed messages are messages that are designed to be inconsistent [7].
2.2 Individual Defensive Routines
Defensive routines are often used when one feels the need to protect their integrity [8]. Some common defensive routines are self-censoring, face saving, unilateral control, bypass, mixed messages, protective support, and fancy footwork. Self-censoring is a routine used to keep negative thoughts to one's self [9]. Face-saving is used when an individual does not want to point out someone else's mistakes. This can be accomplished in several ways. One way is for someone to point out something negative about himself or herself as opposed to the other person. Another way to demonstrate face-saving is to disguise criticisms through ambiguity. Unilateral control is another routine that is used. This is performed by stating one's opinion in such a forceful way that the ability to question the validity of that opinion is eliminated [9]. Bypass is a routine to avoid dealing with threat. Bypass utilizes two methods. The first method is to be direct and ‘tell it like it is' [10]. The second method is to ‘ease in’. This is a strategy used when individuals want to appear passive when in actuality they are active [10]. Mixed messages are used when one wants to hide the true message [10]. Protective support is defined as a method used to appear supportive of individuals but still seeking control of the situation [9]. Fancy footwork is defined as switching one's viewpoint to defend his or her position but to act as if the switch did not happen [9].
Argyris is the founder of ‘Action Science’. Action Science is defined as a theory that explains individuals' interactions based on their espoused theories and theories-in-use [11]. Argyris and Schon [6] concluded that human action is based on theories of action. The theory of action is defined as the actual behaviour exhibited in a particular situation [5]. Espoused theory is defined as the theory that the individual wishes to execute, while theory-in-use is what is actually used. More often than not, the espoused theory is incongruent with the theory-in-use.
Argyris [12] states that Model I Theory-In-Use has four governing values, which include (1) define unilaterally the purpose of a situation, (2) maximize winning and not losing, (3) suppress negative feelings, and (4) be rational. The strategies that are often used with these governing variables are to advocate one's position to remain in control and to save face. The consequences of these actions are miscommunication, mistrust, protectiveness, self-fulfilling prophecies, self-sealing processes, and escalating error [9]. Model II has three governing values including (1) valid information, (2) free and informed choice, and (3) monitor effectiveness of one's actions [13]. The strategies that are often used with these governing variables are to advocate one's position and combine inquiry and testing in order to minimize face saving behaviour.
Defensive routines can inhibit ones learning, which is the ability to detect and correct errors. Learning can also take place when there is a match between one's intent and what actually happened [10]. There are two types of learning that can take place: single loop and double loop. Single loop learning corrects the problem, but does not address the underlying issues. Double loop learning corrects the problem by examining the underlying assumptions that created the problem [14]. There is a plethora of literature available on Action Science, defensive routines, and Model I and Model II behaviours that will be discussed next.
2.3 Self-Monitoring
Self-monitoring is similar to Argyris' espoused theory and theory-in-use. Self-monitoring is defined as ‘the process in which people manage their public impressions consistent with the demands of the situation or from their own stance [15]. Acute perception, discernment, and understanding of social behaviours are all characteristics of self-monitoring [16]. However, there is one key difference between self-monitoring and theory-in-use. Self-monitoring implies that the individuals are making an effort to modify their behaviour; whereas with theory-in-use, the behaviour is often times not realized and, therefore, not monitored. Considerable research has been performed on self-monitoring behaviours in an attempt to bring awareness to individuals who may need improvement and the opportunity for correction.
Self-monitoring behaviour is divided into two categories: high self-monitoring and low self-monitoring. High self-monitors are individuals who focus on their social context, are more responsive to social cues, and are very attentive to the behaviours of others [17]. High self-monitors attempt to impress others in order to win their approval and respect [16] and focus on the perception of how they are viewed in the image of others. Research has shown that high self-monitors' desire for social status can affect their decision-making [16]. High self-monitors are sensitive to situations, can adjust their behaviours accordingly, and typically have better communication skills.
Research shows that high self-monitors tend to perform better in jobs, emerge as leaders, and are more likely to solve problems through collaboration and compromise rather than avoidance and competition [18]. These behaviours are very similar to the governing variables in Model II behaviour.
Low self-monitors are a contrast to high self-monitors. Low self-monitors are not as sensitive and are less concerned with their impact on others. Low self-monitors operate according to their internal feelings instead of external factors [18]. This implies that low self-monitors may be more introverted, which is a common description of many engineers.
The most common tool for evaluating self-monitoring behaviour is the self-monitor scale. Mark Snyder developed this tool in 1974 [19]. The self-monitor scale is a multidimensional, complex scale that is composed of 25 items to be measured. In 1986, Lennox and Wolfe developed a revised shortened version of the self-monitoring scale. The shortened version focuses on items that are above 0.15 on the first un-rotated factor [19].
3. Engineering Managers
Considerable research has been conducted on engineering managers regarding the type of characteristics and behaviours that they should exhibit in order to be successful as managers. Engineering managers must not only be technically competent, but must also understand the business aspects of organizations.
There has also been considerable research on engineers and their behaviours, the majority of which supports that engineering education has a direct effect on how engineers operate in the working environment. According to Wyrick [20], the way engineering is taught dictates how engineers process information during his or her career as well as how technical organizations develop their cultures. Universities typically focus on the theoretical aspects of engineering versus preparing students for real-world engineering [1]. In order for engineers to be prepared for leadership and management, the training should occur early in their careers, as early as during undergraduate education [21].
Some believe that engineers move into management because the technical path is truncated once a certain level is received [3]. Roberts and Biddle [3] discuss the human resource perspective of why engineers move into management. Human Resource departments in organizations often believe that engineers move into management because the upward mobility of technical professionals is limited. Within the study, Roberts and Biddle ask a series of questions on the transition to management regarding who gets promoted, if technical workers make good managers, if individuals return to the technical track once they leave, and if the best technical workers leave because of limitations in upward mobility.
Research studies that focus on the learning styles needed to be an effective team leader and engineering manager have also been conducted [20]. Wyrick states that it is important to understand how engineers process information in order to make them more effective [20]. The research finds that engineers who take the Myers-Brigg assessment typically rely on introversion, intuition, thinking, and judging (INTJ). There is a belief that there is a connection between the major personality traits. Managers are expected to exhibit certain leadership styles that appeal to their teams. To explore this relationship in more detail, additional data can be collected from the managers using a short behaviour survey such as the Big Five. The Big Five survey measures factors of extraversion, agreeableness, conscientiousness, neuroticism, and openness to experience.
As discussed, there is literature that discusses defensive routines, engineering manager behaviours, as well as leadership and personality behaviours such as self-monitoring. However, there is little literature that examines how engineering managers exhibit defensive routines. Engineering managers and defensive routines are studied as separate entities. Therefore, there is a gap in the literature. This study serves as a means to fill that gap by examining whether engineering managers exhibit defensive routines more than non-engineering managers using the following methodology.
4. Methodology
4.1 Description of the hypothesis
The hypothesis of this study is whether engineering managers exhibit defensive routines more than nonengineering managers.
This hypothesis was developed for several reasons. For example, high pressure grading evaluations can contribute because the student does not want to fail. Often schoolwork consists of yes or no answers; this eliminates the ability to manage ambiguity. Since the ambiguity is not there, there is no reason to inquire. Model II behaviour is based on the ability to inquire. These are all factors that are related to defensive routines, and research exists that supports this behaviour. With high pressure grading, there is work on motivation that suggests that highly extrinsic motivation drives people toward only wanting to solve simple, unambiguous problems so they can get a reward, such as a good grade [22]. Secondly, engineering managers are more prone to product and process development as opposed to visionary thinking. Third, engineering managers often struggle with the acceptance of failures of system implementation [23]. To test this hypothesis, a packet was developed to distribute to the manager participants to complete.
4.2 Participant Packet
Upon confirmation of their participation, the managers were sent a copy of the participant packet. This packet was comprised of an introduction letter from the researcher, a consent form that was in alignment with the Institutional Review Board's (IRB) requirements to confirm anonymity, a questionnaire to capture more demographic information about the individuals, and the cases to complete. The participants were given two weeks to complete the packet.
The survey data are used to capture background information about the managers and to examine any commonalities and trends that might surface in the data. The survey asks the following questions:
What is your undergraduate degree in?
Do you have an advanced degree(s)? If so, what is it in?
How many years of experience in management do you have?
How many total individuals do you manage?
Do you manage engineers? If so, how many?
Do you manage other managers? If so, how many?
Have you received any in-house management and/or non-credited management training? If so, please describe briefly.
What is your age?
This research examines the results of a situation that the manager may have encountered with their manager, employee, or colleague. The case follows the structure of case studies from Argyris [24]. The case begins with the description of the problem as follows: describe a situation or problem that you have experienced in your time as a manager. The situation can be recurring or a onetime occurrence with your subordinates, peers, or manager. Who are the important people involved and what is your relationship to them? Feel free to use generic names (i.e., ‘Employee A’, ‘John Doe’). The case proceeds in the following format:
Cause of the problem – What do you think happened to cause the problem? Who or what is primarily responsible for the problem? (If someone or something is).
Goals – Describe the goals/objectives of the people involved. How certain of this are you?
Strategy – Describe what your strategy would be for obtaining these goals. Please be as specific as possible.
Scenario – This section is where the dialogue is captured using the Left Hand Column approach. On the left side of the paper, the managers are to write down their private thoughts and feelings, while writing what was actually said on the right hand side of the paper.
4.3 Participant Demographics
The participants of this study were all managers who were known to the researcher. These managers were selected because the assumption is they would be truthful in their responses to the case studies and be without fear of retaliation from their employer. The managers represent a diverse cross section of industries. The participants were contacted via email or phone call from the researcher requesting their assistance. The managers were requested to reach out to additional potential research participants. The engineering managers are classified as managers who have an educational background in engineering disciplines such as but not limited to electrical, mechanical, civil, aerospace, etc. The non-engineering managers are managers who have undergraduate degrees in areas such as finance, human resources, business, etc. However, there was a third category of managers that was considered. These are managers that do not have degrees in engineering, but they do have specific backgrounds in those two categories such as physics, mathematics, or computer science. As such they were analysed separately. For the study, 55 managers were contacted to participate, 41 managers confirmed their participation, and 27 packets were received. This yields a response rate of 49%. This study uses a small sample size in order to decrease the ability to draw broad conclusions. The scoring methodology was developed in order to measure the responses of the managers.
4.4 Scoring Packet
This section describes the scoring packet that was developed by the researcher to obtain quantitative measures. The scorer packet was provided to the scorers to score the completed packets. The packet contained an introduction from the researcher, categories to be scored, instructions on how to code the paragraphs, behaviour tally sheets, and an example of a case that was already scored. The data were scored based on the scoring method developed by Marasigan-Sotto [25] to determine whether an individual is operating under Model I or Model II behaviour. The process of scoring the packets was outlined in the scoring rubric for the scorers' reference. The packets were coded using roman numerals, capital letters, and numbers. The approach was to count the behaviours that were used. The two top categories were Model I Theory-In-Use and Model II Theory-In-Use. There are sub-categories that fall under Model I and Model II. The choices for Model I Theory-In-Use were bypass, face-saving, fancy footwork, mixed message, protective support, self-censoring, un-illustrated evaluation, un-illustrated inquiry, un-illustrated attribution, and unilateral control. The categories for Model II were advocacy, attribution, evaluation, inquiry, and testing. However, there were some enhancements made to the scoring categories to account for additional defensive routines. The scoring packet was enhanced to add the following categories: bypass, face-saving, fancy footwork, mixed message, protective support, self-censoring, and unilateral control.
The public dialogue section was the portion of the packet that was scored for the defensive routines. This section outlines the conversation that took place between the manager and the employee. Only the dialogue of the managers was scored. The dialogue of the employee was not scored because there was not enough background on the employee to make an accurate decision on which behaviour was being exhibited. Each line of the manager's dialogue was assessed against the defensive routine categories in the packet to determine which behaviour was exhibited and was recorded on the behaviour tally sheet. The sum of the Model I and Model II categories was then determined. The behaviour that had the most marks according to the behaviour tally sheet was the behaviour that was captured for that manager. To address the biasing in the scoring and determine interrater reliability, two additional scorers were recruited to score along with the researcher. The scorers were comprised of one graduate student and one undergraduate student, who both have about the same level of knowledge as one another regarding defensive routines. Inter-rater reliability is defined as the extent to which information being collected is collected consistently [26]. It focuses on ensuring that there is a certain level of agreement among those examining the data. The typical level of agreement is 0.7 [27].
There are some methods and best practices that can be employed to improve interrater reliability. The key measuring factor is the rater. Raters who are familiar with the constructs should be chosen and thoroughly trained in scoring and coding the data. Another best practice is to ensure that the raters understand the coding procedures [26]. Inter-rater reliability will be discussed in a subsequent section.
The scorers were provided with a two and a half hour training session with the researcher in which the scoring packet was reviewed in detail. The two additional scorers were not familiar with this type of data analysis. During this training session, the researcher reviewed the scorer packet with emphasis on the definitions and the types of categories that would be scored with the additional scorers. After reading through this information, the first case study response was scored together to ensure consistency in the scoring methods. The scorers agreed on this packet.
After the training session, the scorers were provided with copies of the case study as well as copies of the behaviour tally sheets to complete their scoring. The scorers were given a week to complete their scoring. During this week, there was a conference call with the scorers and researcher to review an additional case to ensure consistency, as well as answer any questions that the scorers may have had. At that time, the group scored packets 2 and 3 of the case study, and there was 100% agreement.
After gaining a clearer perspective of interrater reliability and reviewing additional literature, the initial approach of using percentage agreement was determined to not be the best approach. Percentage agreements do not take into account chance agreements, since chance is likely to inflate the agreement [28]. The key differences in the coding results stem from how each dialogue line was coded. Because the results were obtained from a count, there was no margin to account for those managers that fell on the borderline of Model I and Model II. To increase interrater reliability and reduce the level of chance agreement, the scorers met again to re-score the cases that were on the borderline between Model I and Model II to ensure that there is a common level of understanding of the data. Initially, the scorers scored the data separately. The scorers were provided with additional literature to review regarding defensive routines to supplement the scoring packet. The goal of scoring the cases together is to encourage open dialogue as to how the results were reached. Table 4 shows the final scores of the behaviours according to each scorer after meeting again.
This table shows a summary of the demographics of the manager participants.
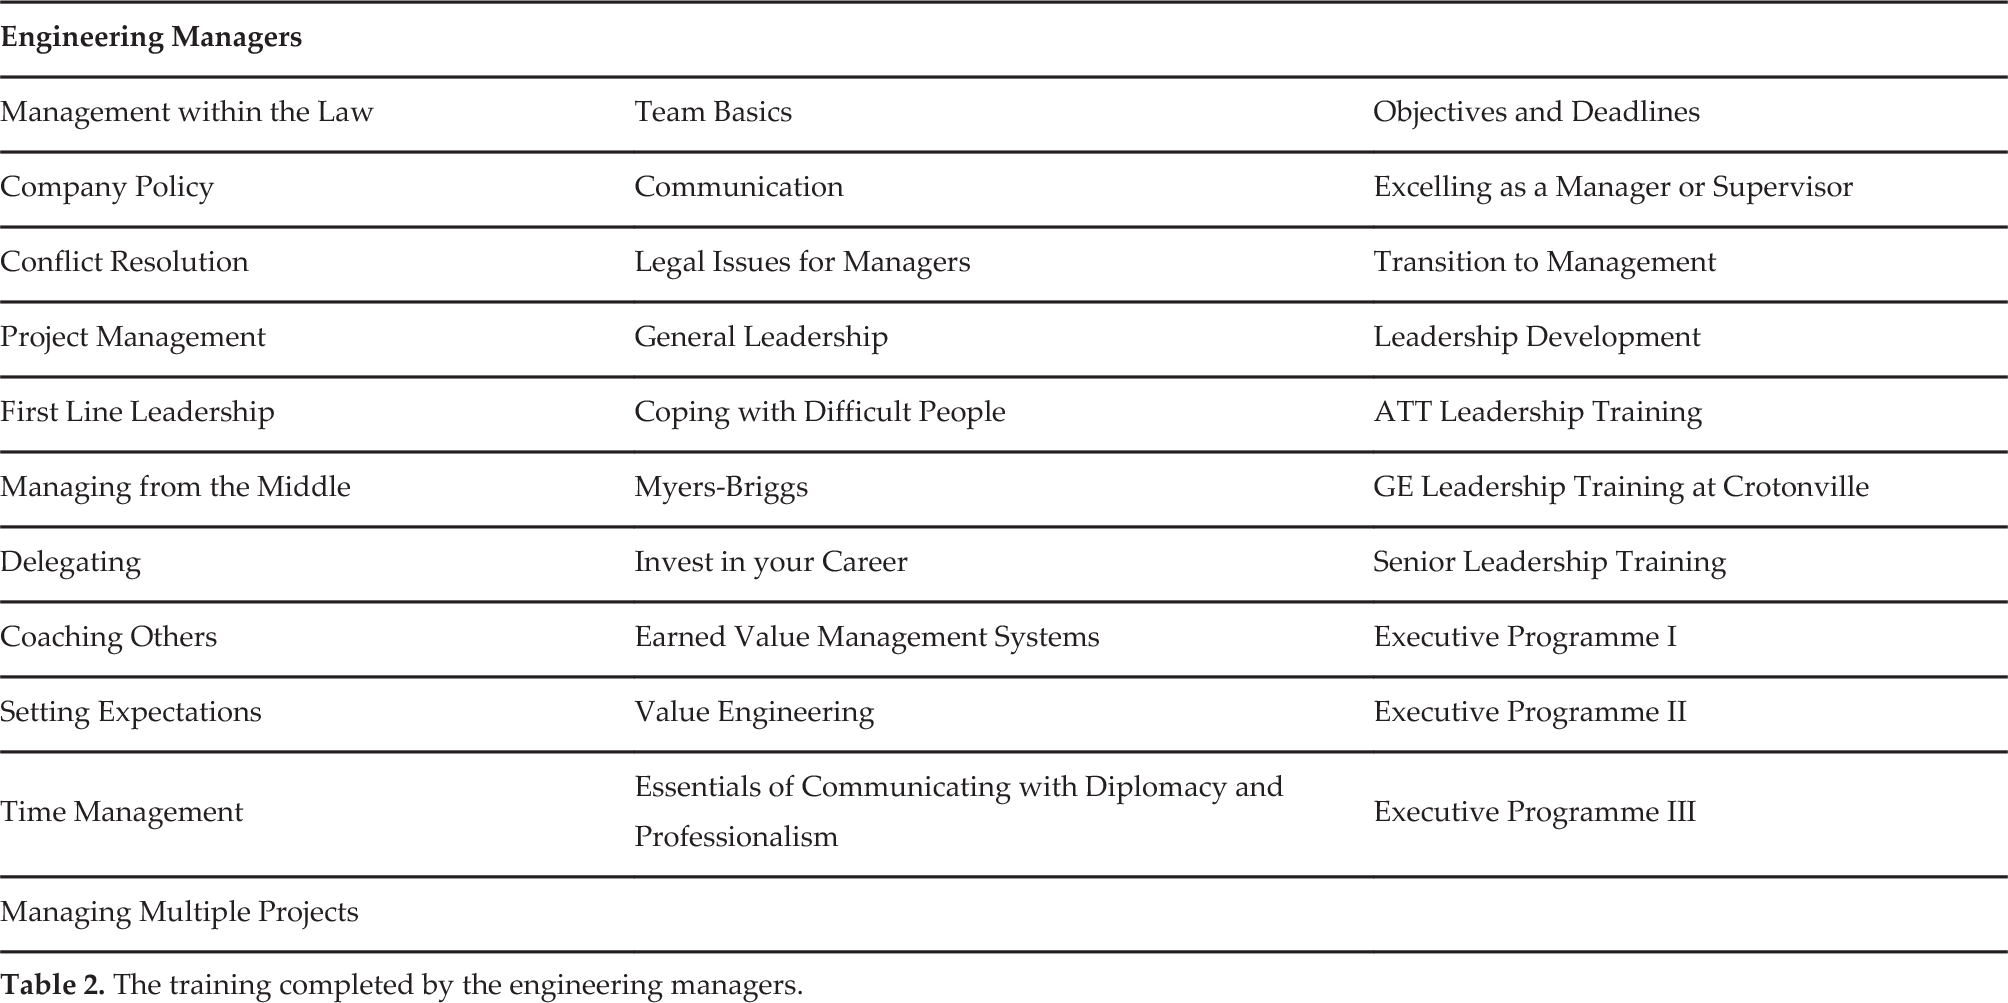
The training completed by the engineering managers.
The training completed by the non-engineering managers.

The training completed by the managers classified as ‘Other’.

Once the case studies were scored completely, the interrater reliability was calculated. The interrater reliability was calculated as shown in Equation 1:

4.5 Scoring Categories
This section outlines the scoring categories that were being measured. Below are categories that define the most common defensive routines. Under each category is an example of a type of tactic that might be used in the particular routine. The common cues can be described with key indicators or through certain types of examples. Some of the defensive routines are identified based on the perception of the reader.
5. Results
This section discusses the results of the case study and the demographics of the participants. This section also provides a summary of the responses to the questionnaire data to provide an overview of the type of managers that participated in the case study.
The first step was to determine how many respondents were engineering managers, non-engineering managers, or other. Engineering managers were defined as managers who had completed the requirements for a Bachelors degree in an engineering field such as electrical, mechanical, industrial, etc., while non-engineering managers were classified as those not holding an engineering degree. A third group called ‘other’ was developed for those managers who completed degrees in technical and scientific areas such as computer science, physics, information technology, mathematics, and others. Therefore, 17 of the managers managed other engineers, while ten of the managers did not.
5.1 Demographic Analysis
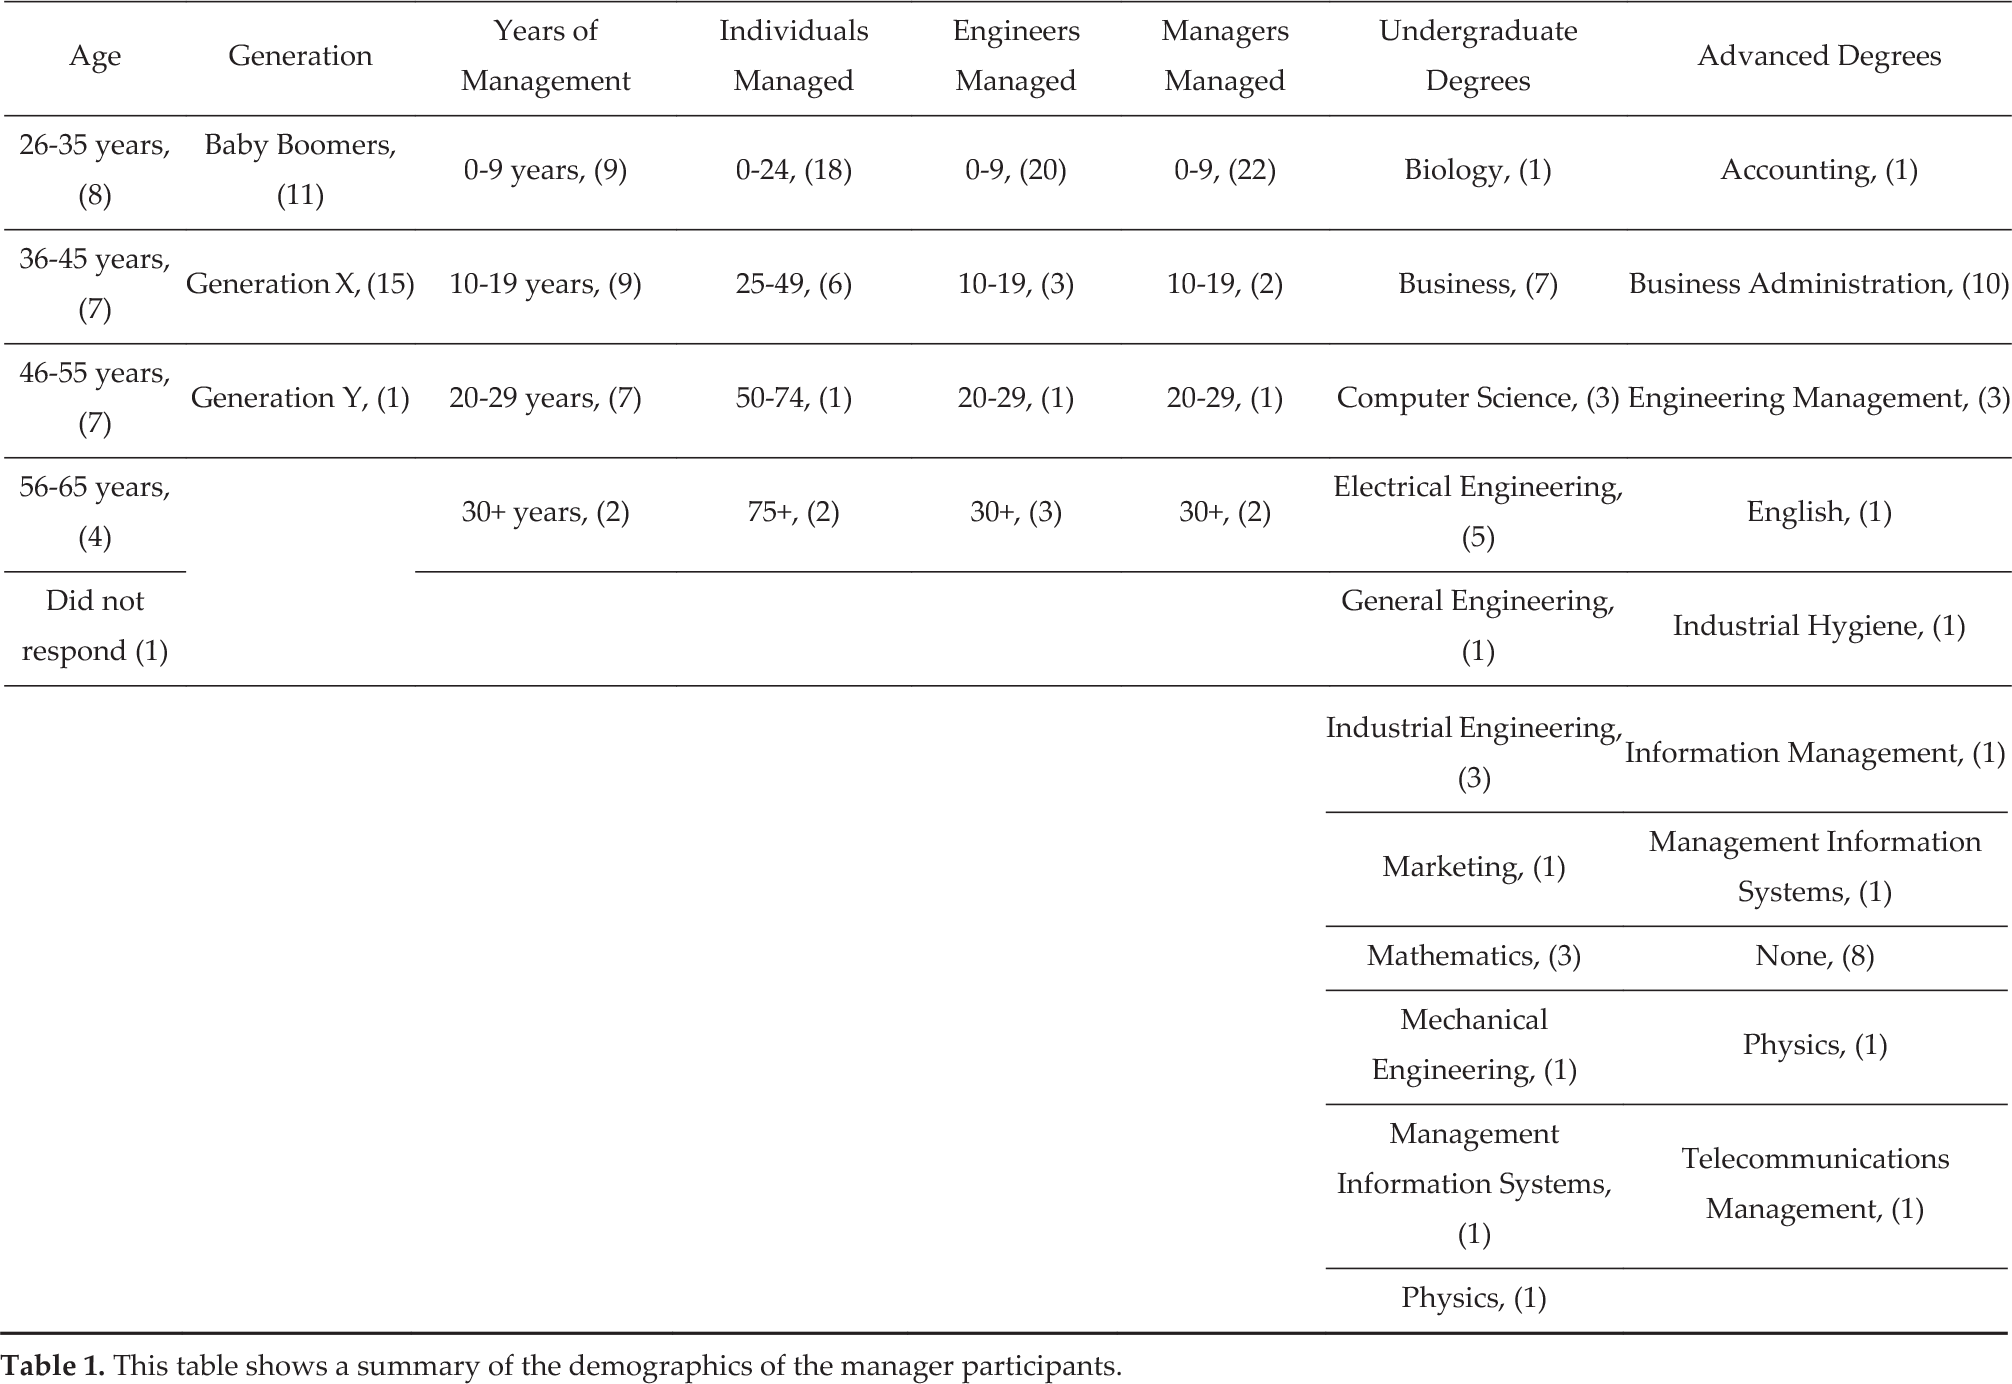
Table 1 shows a tabular view of the information received from the questionnaires. The number in parentheses represents the corresponding number of managers. The data from the questionnaire were analysed to determine if there were any patterns based on the various generations. Of the 27 packets submitted ten were male managers and 17 were female.
The age of the managers ranged from 26–62 years old as shown in Table 1. The average age was 44 years old. The median age was 45 years old and the standard deviation was 9.81. The 27 participants were categorized as Baby Boomers, Generation X, and Generation Y. The Baby Boomers are the managers that were born between 1946 and 1963 and the Generation X managers are those that were born between 1964 and 1980. The Generation Y managers, also known as millennials, are all those born after 1980.
After grouping, there were a total of 11 managers that would be classified as Baby Boomers, 15 managers classified as Generation X, and one manager classified as Generation Y (Table 1). For the Baby Boomers, there were seven that operated with a Model I Theory-In-Use and three that operated with a Model II Theory-In-Use. Model II Theory-In-Use behaviour was only shown in the NonEngineering or the ‘Other’ categories. All of the engineering managers in this generation operated in Model I Theory-In-Use. For the Generation X managers, there were 11 managers that operated in Model I Theory-In-Use behaviour and four that operated in Model II Theory-In-Use behaviour. Of the five engineering managers, four operated in Model I Theory-In-Use and one operated in Model II Theory-In-Use. For the Generation Y manager, this manager operated in Model I Theory-In-Use. Based on the information from the case study, this manager spent a lot of the dialogue trying to assert themselves to prove themselves worthy of being a manager.
The managers were asked about their educational backgrounds. The highest percentage of undergraduate degrees was in business at 26% and the highest number of graduate degrees was the Masters of Business Administration degree at 33%. There were three managers who were awarded PhDs in Nuclear Physics, English, and Organizational Leadership. A statistical analysis was performed on these data as well. The average number of years of management experience that the managers had was 13.85 years. The lowest number of years of management experience was one year. The highest number of years of management experience was 30 years. The median number of years of management experience was 14. The standard deviation of years of management experience was 9.00.
There was a large range in the number of individuals that the managers manage. This is due to the managers being at different levels of leadership within their respective organizations.
Additional statistical analysis was performed on the number of individuals actually managed by the managers. The average number of individuals managed is 27. The smallest number of individuals that the managers supervise is 0. The maximum number of individuals that the managers supervise is 250. The median number of individuals that the managers supervise is 12. The standard deviation of the number of individuals that the managers supervise is 48.06.
Those managers who managed engineers were asked for the number of engineers that they managed. Again, depending on the level of leadership and the type of organization, this number could vary. In addition, a statistical analysis was performed on the responses to this question. The average number of engineers that the participants manage is 15. The lowest number of engineers that the participants manage is 0. The maximum number of individuals that the participants manage is 250. This particular manager is a high-level manager, whereby they may have counted their entire organization. The median number of engineers that the participants manage is two. The standard deviation of the number of engineers that the managers manage is 48.
Depending on the level of leadership, there is a possibility that the managers could also manage other managers. Therefore, this question was asked. Eleven of the participants supervise other managers, while 16 participants do not supervise other managers; therefore, 41% of the participants supervise other managers. Additional statistical analyses were performed on the number of participants that are managed by the managers who participated in the study. According to the data received, the average number of participants that the managers manage is 5.40. The lowest number of participants that the managers supervise is 0. The maximum number of managers that the participants supervise is 45. The median number of managers that the participants supervise is 0. The standard deviation of the number of managers that the participants supervise is 11.89.
To gain an understanding of how the managers were prepared for their position as a manager, they were asked about the training they received both within their organizations and external to their organizations. There was a plethora of training that was reported from the managers, which was broken into three groups. The first is the training reported by those who are classified as engineering managers, and which is depicted in Table 2. The second group of training is that reported by non-engineering managers, as shown in Table 3. Finally, the third group of training reported is training from those who do not fall into the engineering manager group or the non-engineering manager group. They have been depicted as others and are shown in Table 4.
5.2 Case Study Response Overview
This section provides an overview of the qualitative responses that were required in the case study. The participants were given the following instructions: describe a situation or problem that you have experienced in your time as a manager. It can be a recurring situation or a onetime occurrence with your subordinates, peers, or manager. Who are the important people involved and what is your relationship to them? Feel free to use generic names (i.e., ‘Employee A’, ‘John Doe’). Again, this case study is open-ended and a variety of situations were discussed. There was some overlap, as several managers were experiencing similar situations with employees such as underperformance, undervalue of management, personal problems affecting work performance, insubordination, working with other employees, and training colleagues.
The managers were asked what they thought was the cause of the problem and who or what is primarily responsible for causing the problem. There was a range of responses to answer this question. Many managers made comments regarding employees not familiar with job duties stemming from not being adequately trained or transitioned. The managers who experienced insubordination believed the cause was due to company cultures and faulty organization reporting.
The managers were asked to describe the goals/objectives of the people involved and inquired how certain they were of this. The common themes in the responses were that the goal of the manager is to get the job done, delegate tasks, and find out what the problem is. Many of the managers had a goal to have a successful team and a smoothly running organization.
The managers were asked what their strategy would be for obtaining the goals that were listed in the previous section. Strategies included face-to-face meetings with employees, additional training, maintaining a level of transparency to their teams, compiling feedback, listening more, involving human resources, and redistributing workloads.
A tabular view of the managers and how their behaviour was classified is shown in Table 5. Eight of the engineering managers operated in Model I Theory-In-Use, five nonengineering managers operated in Model I Theory-In-Use, and six of the managers classified as ‘other’ operated in Model I Theory-In-Use. Only one engineering manager operated in Model II, three non-engineering managers operated in Model II Theory-In-Use, and three of the other managers operated in Model II Theory-In-Use.
Managers' behaviour classification based on Model I and Model II.

6. Conclusion
An understanding of how engineering managers behave when put in certain situations can be beneficial to an organization. This information can allow organizations to develop training and coaching methods to reduce undesired behaviours in their managers. The purpose of this research was to use the scoring method to determine whether engineering managers exhibit defensive routines more than non-engineering managers.
Based on the results of the scoring, defensive routines are more prevalent in engineering managers. As shown in Table 5, eight of the nine engineering managers operated in Model I Theory-In-Use, which was the highest of all the manager groups. Scorer 1 and Scorer 2 had an overall 80.77% scoring agreement among the scored cases. Scorer 1 and Scorer 3 had an overall 88.46% scoring agreement. Scorer 2 and Scorer 3 had 84.62% scoring agreement. The total average of scorer agreement is 84.62%. This is shown in the percentage agreement in Table 5. Because there was only the choice between Model I and Model II behaviour, there was either 0% agreement or 100% agreement.
In revisiting the original hypotheses, we would fail to reject hypothesis 1: that engineering managers exhibit defensive routines more than non-engineering managers. We would fail to reject this hypothesis because according to the results, engineering managers illustrated more defensive routines than non-engineering managers.
7. Future Work
To date there has not been a comparison study of engineering managers against other types of managers based on defensive routines. The study is important to the engineering management profession because awareness is brought to organizations, enabling them to be more proficient at ensuring their leadership is effectively leading and motivating their team. This research used methods to determine if there was a difference in the usage of defensive routines between engineering managers and non-engineering managers, and the data show that there is. This opens the door to several areas of future work.
Intervention methods could be developed specifically for engineering managers to help bring awareness to their behaviours and how to improve upon them. In addition, a training curriculum could be developed for organizations and universities to bring awareness to this area as well. The literature illustrates that there is a clear gap in the training of engineering students that prepares them for entry into organizational environments. There could be more research performed to analyse the personality traits of the managers.
As mentioned in a previous section, the Big Five Survey is an instrument that could be used to capture these data. In order to collect these data at a later time, a plan would need to be put into place. The biggest challenge would be for the managers to find time to complete the survey. The approach would be to develop a link and send to the managers who completed the case studies to obtain the additional information on their personality traits. Lastly, because this was a qualitative study, statistical analysis was not conducted on the dialogues of the case studies. Therefore, future work could develop statistical tools to further validate the scoring method used.