
Abstract
The prevailing trend of integrating inertial sensors in consumer electronics devices has inspired research on new forms of human-computer interaction utilizing hand gestures, which may be set-up on mobile devices themselves. At present, motion gesture recognition is intensely studied, with various recognition techniques being employed and tested. This paper provides an in-depth, unbiased comparison of different algorithms used to recognize gestures based primarily on the single 3D accelerometer recordings. The study takes two of the most popular and arguably the best recognition methods currently in use - dynamic time warping and hidden Markov model - and sets them against a relatively novel approach founded on distance metric learning. The three selected algorithms are evaluated in terms of their overall performance, accuracy, training time, execution time and storage efficacy. The optimal algorithm is further implemented in a prototype user application, aimed to serve as an interface for controlling the motion of a toy robot via gestures made with a smartphone.
Keywords
1. Introduction
With our dependency on computers growing day by day, human-computer interaction (HCI) is assuming an utmost importance in our daily lives. It is a common belief that as computing, communication and display technologies evolve further, traditional keyboard and mouse interaction will become a bottleneck in the effective utilization of information flow between humans and computers. Hence, a great attention and interest in recent years have been directed towards attempts to introduce human-to-human communication modalities in HCI, in order to make interaction with computers more natural, efficient and pervasive. This can be further extended to human-robot communications and research into new modalities of presenting input commands to the robots. Hand gestures are one of these modalities that have been considered for this purpose.
A gesture can be termed as an expressive form of nonverbal communication, involving movements of the fingers, hands, arms, face, head or body with the intent of conveying meaningful information or interacting with the environment. Gesture recognition is the process by which the gestures made by the user are recognized by the receiver, and to date it has been used in a wide range of applications. Typical examples include: daily activities detection [1], medical rehabilitation and assistance [2], user identification and authentication [3], sign language interpretation [4], computer games [5], augmented reality [6], user interfaces [7] and robot control [8].
In general, there are two prevailing approaches for detecting and tracking the user's movements: i.e., computer vision-based and motion sensor-based. Vision-based techniques have been at the focus of gesture recognition research for many years. However, their applicability is seriously affected by their limited range and wearability, their high computational and processing requirements and their sensitivity to lighting conditions, camera facing angles and calibration, which renders them unsuitable for use in a truly mobile context. By contrast, motion sensors are low cost and low power and can be used in much less constrained conditions, offering users more freedom in their interaction with computers or microprocessor controlled robots, as will be the case in this study.
The massive influx of mobile devices, integrating a wide variety of built-in sensors, including accelerometers, gyroscopes and magnetometers, has spurred new possibilities for interacting with different applications. In particular, accelerometer-based gesture recognition has gained increased popularity lately, since the 3D accelerometer has become commonplace in almost all recent portable devices, where it is mainly being used for detecting changes in screen orientation.
In accelerometer-based gesture recognition, gesture refers to an action or motion made by the user when holding the device; for example, a movement describing a circle, which is attributed a meaning. Such gestures are captured by an accelerometer and are further represented by an acceleration vector stream. Once these acceleration vector streams are obtained, they can be used to identify gestures intended by the user.
Accelerometer-based gesture recognition methods have been studied in a number of publications [9], [10], [12–20]. In these works, two popular algorithms, dynamic time warping (DTW) and hidden Markov model (HMM), both taken form the field of speech recognition, have been most frequently discussed. DTW is the algorithm for measuring the similarity between two time series, and HMM is a statistical generative model for analysing time varying signals. Despite their proven effectiveness in gesture recognition, these two algorithms exhibit shortcomings that hinder the progress of accelerometer-based gesture interaction.
The objective of this research is to compare different gesture recognition algorithms and to determine which is the most appropriate to be implemented on a resource-constrained platform, with regards to recognition efficacy, computational complexity and overall resource consumption. In addition, it goes to show that limitations existing in the two current benchmark algorithms, HMM and DTW, can be eluded by employing a relatively novel technique based on distance metric learning [11], without the losses in performance or recognition accuracy.
This paper is organized as follows. Section 2 provides an overview of the related work on gesture recognition based on acceleration sensing. In section 3, relevant background material is presented. Section 4 outlines the key steps in the data acquisition and processing pipeline. Section 5 explains the experimental setup and discusses the results. A simple application enabling users to control the motion of a toy robot by performing gestures with their smartphones, is described in section 6. Finally, section 7 summarizes the paper with a few concluding remarks.
2. Related Work
In the seminal work on dynamic gesture recognition [12], Hofmann et al. were the first to propose using discrete HMM for the recognition of ten gestures of German sign language based on their velocity profile. Their approach consisted of two levels and stages of recognition: a low-level stage that aimed to reduce the complexity of input data by applying vector quantization and a high-level stage that followed immediately after and fed the gesture data to the discrete HMM. The experiments were built using a training set of ten samples per gesture, each sample representing hand orientation, acceleration data and finger joint angle. Here, the number of states in HMM varied from one to ten and the observation alphabet size equalled 120. The comparison between ergodic HMM and left-to-right HMM showed similar results with 95.6% correct recognition rate.
Similar results are reported in [13–15]. In [13], Kalio et al. used a five-state HMM and a discrete alphabet size of eight on a vocabulary of 16 gestures with four degrees of complexity. The authors stressed that the recognition performance deteriorated significantly, dropping from 95% to 75%, when four sequences were used for training compared to 20 sequences. Kela et al. [14] studied a 37 multi-user case with a vocabulary of eight gestures, where they focused on exploring the effects of data quality - more specifically, gesture sampling rate and vector quantization - on recognition performance. Their experiments yielded a 96.1% correct classification rate with five-state HMM and a discrete alphabet size of eight. However, this study can be seen as biased, since the quantization codebook used in it was constructed based on the entire dataset and not only the training data. Schlömer et al. [15] estimated the performance of a left-to-right HMM with eight states on five simple gestures, given the classical recognition pipeline. A Wii controller was used as the input device and the recognition results varied between 85% to 95%, depending on the discrete alphabet size. They showed that, using an alphabet with size k=14, their algorithm performed best.
Taking into consideration that gesture data are correlated in time, Pylvänäinen [16], on the other hand, proposed building a system that would use continuous HMM with normal output distribution, to recognize gestures recorded utilizing an accelerometer embedded in mobile phone. The output distributions were assumed to have diagonal covariance matrices and each of the models employed had eight states. The data were normalized by rotation so that the estimate of the gravitational constant, g, points in the direction of the negative y-axis. Again, the results were very convincing, with 96.76% accuracy obtained on a dataset providing 20 samples for ten gestures, realized by seven persons.
Unlike the studies mentioned earlier, Liu et al. [17] presented. μ Wave, an efficient user-dependent system that supports personalized gesture recognition. The core of μ Wave is DTW supported with a template adaptation scheme for coping with gesture variation over time. It is claimed that μWave functions by utilizing only one training sample, stored in a template, for each gesture pattern. μ Wave was evaluated on the gesture dictionary identified by Nokia research [14]. The gesture database consisted of more than 4,000 samples, collected from eight users over multiple days. The system yielded an accuracy of 98.6% and 93.4% with and without template adaptation, respectively, thus proving DTW to be very effective in coping with limited training data and being amendable for implementation on resource-constrained devices.
Likewise, Choe et al. [18] suggested an optimized method for the online gesture recognition based on the DTW and modified clustering algorithm that reduces the number of templates, while preserving the diversities of the given training patterns. The method was validated on 20 types of gestures, designed for mobile content browsing, where it yielded better performance, in terms of its accuracy and processing time, than other conventional algorithms with the same number of templates. Akl et al. [19] employed DTW in combination with affinity propagation and compressive sensing algorithms for efficient 3D gesture recognition. A near perfect accuracy was achieved for user-dependent recognition with the minimum of three repetitions used for training and for a dictionary size of 18 gestures.
Finally, Niezen et al. [20] have compared DTW to the artificial neural network (ANN) and HMM-based strategy. Their experimental results showed that DTW is very efficient for accelerometer-based gesture recognition. The authors have demonstrated that DTW has very low computational overhead and low memory requirements for a reasonable amount of gestures. Furthermore, it does not require extensive training, as is the case with both other algorithms.
Recently, Marasovic and Papic [11] experimented with a different strategy for recognizing 3D gestures based on distance metric learning for nearest neighbour classification. Their performance analysis on single user data yielded very promising recognition accuracies higher than 90% with 12 gesture training samples. Moreover, it showed that their approach has a low computational overhead, which makes it amendable for use in human-robot interaction via mobile devices. Here we extended and improved on their baseline algorithm by introducing a more complex feature scheme.
3. Background
This section briefly reviews the basic terminology and theory behind each of the three examined gesture recognition techniques in order to provide context for the remainder of the paper.
3.1 Dynamic Time Warping
Dynamic time warping (DTW) is a popular classical technique for matching the temporal sequences of varying duration or speed. The rationale behind DTW is, given two time series, to stretch or compress them locally in order to make one resemble the other as much as possible. The alignment between the two is expressed by the accumulative distance measure, which is optimized to be minimal [21].
Assume that there are two similar but temporarily distorted time sequences p= {p1,…,pn} and q={q1,…,qm}. In order to align these two sequences, a Dmxn matrix is designed, where the element at the certain position Di,j represents the matching cost between pi and qj. This cost can be computed very efficiently using dynamic programming, as the composition of the Euclidean distance d(pi,qj) between vectors pi and qj and the minimum cost of the adjacent elements of the cost matrix up to that point:

The output of the DTW algorithm is an optimal total cost Dn,m that indicates how much two input time sequences differ when best aligned. This so-called DTW distance has a straightforward application in pattern recognition and classification. Given a set of known pattern templates, an unknown pattern can be recognized by calculating the DTW distances between it and each of the known templates, and choosing the template which best ‘fits’ the test pattern as the recognition result.
3.2 Hidden Markov Model
The hidden Markov model (HMM) is a mathematical tool used to characterize statistical properties of spatio-temporal time series. A HMM consists of two stochastic processes: one being an underlying first-order Markov chain with a finite number of states that can only be observed through another stochastic process, which generates a sequence of output observations O. Assume that S={S1,…,SN} is the set of states in the model and qt,1≤t≤T is the state at time instant t, where T is the length of observation sequence. Using a compact notation, a hidden HMM is defined as the triplet λ=(π,

and

Otherwise, if the observations are continuous variables, the output model is given by a mixture of Gaussian probabilistic density functions (pdfs):

where M denotes the number of components in Gaussian mixture model, ci,k is the mixture coefficient for kth component in state Si and N(Ot,μi,kσi,k) is a Gaussian pdf with the mean vector μi,k and the covariance matrix σi,k.
The goal of HMM training is to improve the model parameters, based on the ensemble of training samples. There is no known method for obtaining the optimal or most likely set of parameters from data, but a good enough solution can always be obtained by using a Baum-Welch iterative training procedure, sometimes also referred to as a Forward-Backward algorithm. The recognition is performed by computing the likelihood P(O| λ) of the new observation sequence with respect to each class HMM and associating it to the most likely generative model in a maximum likelihood sense.
HMM can have different topologies, defined by the transition probability matrix A. The most general topology is the fully connected or ergodic HMM that allows arbitrary state transitions between any states. However, when analysing chronological sequences, such as gesture data, it is preferable to use a model that describes the observations in a successive manner. The topology that fulfils this request is the left-to-right model, which, in contrast to the ergodic model, does not allow jumps to be made to the previous states.
3.3 Distance Metric Learning
By far the simplest way to recognize an unknown pattern is to compare it with a group of known patterns and assign it to the class most common among k known patterns ‘closest’ to the new pattern. Needless to say, the efficacy of this approach depends strongly on the manner in which the similarity between different patterns is determined. Without prior knowledge, the closeness between patterns is usually measured by applying Euclidean distance.
Viewing the Euclidean distance as a non-adequate measure of similarity, many researchers have begun to explore how to improve on ad-hoc or default choices of distance metric. Distance metric learning is a new, emerging technique, where the goal is to adapt the underlying metric in order to achieve better results of classification and pattern recognition. In a large number of applications, a simple yet effective strategy is to replace the Euclidean metric with the so-called Mahalanobis distance metric, which computes the squared distance between vectors x and y as:

where the matrix
To ensure a robust nearest neighbour classification, two simple intuitions have to be met: first, that each training input xi should share the same label yi as its k nearest neighbours; and second, that training inputs with different labels should be widely separated [23]. The following cost function neatly balances these objectives through two competing terms:
with μ∈[0,1] being a parameter used to weigh the trade-off between them.
The first term in (7) pulls closer together neighbouring inputs sharing the same label, while the second term acts to alienate each input xi from differently labelled inputs by an amount equal to one plus the distance from xi to any of its k similarly labelled closest neighbours. The cost function thereby favours distance metrics in which differently labelled inputs maintain a large margin of distance and do not threaten to ‘invade’ each other's neighbourhoods.
The optimization problem in (7) can be cast as an instance of convex programming. Convex programming is a generalization of linear programming in which linear costs and constraints are replaced by their convex counterparts. The convexity property makes the optimization immune to the possibility of getting trapped in local optima. Due to recent advances in numerical analysis, convex programs can now be solved efficiently (with polynomial time convergence guarantees) on modern computers.
4. Data Collection and Analysis
In contrast to the speech recognition, gesture recognition has much more flexible inputs, because the user can compose gestures without the constraints of a ‘grammar’ or ‘syntax’. Therefore, there is no publicly available gesture dataset for the evaluation of 3D gesture recognition techniques. The decision on what gestures to use is a far-reaching one, as it can significantly affect all performance aspects, i.e., recognition accuracy, processing time, computational complexity, etc; not to mention user experience. Using more complicated gestures may seem to be an appropriate choice, since they are more likely to have more features that distinguish them from each other, resulting in a higher accuracy. However, complicated gestures pose a burden on human users, forcing the users to remember how to perform them in a proper manner. The solution is to use simpler gestures that produce diverse inertial stimuli, such as changes in direction and motion axes information.
Learning gestures is analogous to learning a new language. It can be difficult for the users to memorize a large number of gestures and to associate them with some unrelated functionality. Previous work on gesture recognition systems has typically considered from eight to ten gestures to reach a compromise between the possible set of actions that can be triggered by the system and the number of gestures that needs to be remembered. Here, we have utilized a collection of nine simple reference gestures, which are depicted in Figure 1. This definition of the gesture dataset is taken from [11] and is, according to its authors, largely inspired by the gesture vocabulary identified in [14] as preferred by users for interaction with home appliances. The meaning of each gesture is dependent on the application.

Reference gestures
For this discussion, a user coordinate system is defined as the one with the origin in the user's palm and the x, y and z axis pointing right, pointing upward and going through the hand, respectively. Governed by the fact that it is more common for the users to use spatial 2D gestures than to utilize all three dimensions in one gesture, all the defined gesture motions are confined to the vertical (x − y) plane in front of the user. Hence, the accelerations along x and y axis are sufficiently adequate to distinguish each gesture and the acceleration along z axis can be neglected to reduce computational requirements.
4.1 Device and Sensing
The gesture data have been captured on a Samsung i9000 Galaxy S smartphone, running Android operating system. The phone features a built-in Bosch BMA-023 MEMS triaxial, digital accelerometer with a nominal range of ±2g. To ensure that the sensor's axes are aligned with the axes of the user coordinate system, the defined gestures were supposed to be performed by holding the phone upright, oriented so that the screen is readable by the user in a normal fashion. A standalone Android application has been used to access accelerometer data and write them to text file. The acceleration data values, including gravity, were measured in units of metres per second squared (m/s2) and were delivered in the form of three-valued vectors of floating point numbers.
4.2 Data Processing
Filtering: Raw gesture data, received from the sensor was preprocessed by applying the so-called ‘directional equivalence’ filter, a simple threshold filter eliminating all vectors that are roughly the same as their predecessor and thus only weakly contribute to the characteristic of the gesture. Vectors were omitted if none of their components a={ax,ay,az} were all too different to the corresponding component of their predecessor, i.e., if |ai − ai−1| < ε. In our case, ε was empirically set to 0.3.
Linear Interpolation: Due to the Android API, accelerometer values arrive at irregular time intervals, controlled only by a suggested qualitative delay (fastest, game, normal and UI). The Android platform dictates when an acceleration sampling application will receive updates of sensor values and there is no public method for determining the rate at which the sensor framework will trigger sensor events. Running background services, which increase the CPU load, influences the time spread between two of these events. As a result, a linear interpolation is needed in order to provide regular sampling intervals. We have found that the average time delay between subsequent readings for our dataset was approximately 21 milliseconds, and we have continued our analysis with this baseline sampling rate. By doing so, we aimed to ensure that not too much data were calculated via interpolation, which could result in a false recreation of the original signal.
Smoothing: In general, the signal returned by the accelerometer is quite noisy. In order to reduce the effects of noise that may adversely affect the recognition results, the gesture data were further smoothed by using a five-point moving average filter with unweighted mean. This algorithm runs through the signal, point-by-point, replacing each point with the average of its four neighbouring points, the two preceding and the two following. The five-point smooth was chosen so that signal spikes with an observable, steady progression would be preserved, while anom-alous, sudden spikes would be eliminated.

Raw vs. processed acceleration signals (in m/s2) along (a) x-and (b) y-axis, defining a straight, left-to-right line gesture
4.3 Vector Quantization for Discrete Output
Vector quantization (VQ) is one of the preferred methods for ‘downsizing’ large sets of input vectors onto a manageable number of prototype vectors. The goal of VQ is to produce a more compact representation of the data with as little information loss as possible.
A vector quantizer Q is defined as mapping of k-dimensional vector space ℝ k onto a finite subset of vectors Y={y1,y2,…,yN}:

The prototype vectors yi are sometimes also referred to as characteristic vectors or codewords and the set Y is referred to as a codebook. N denotes the size of the codebook. This mapping is done according to the nearest-neighbour condition, meaning that each input vector is translated to the index of its nearest prototype vector in a given codebook, based on the Euclidean distance.
There are two problems to be solved regarding vector quantization. Firstly, the number of prototype vectors needs to be decided upon. This number is a key parameter for characterizing a vector quantizer. It has a major impact on its quality, as using a small codebook may result in losing of essential information, while using a large codebook may cause the loss of distinctions in the features. The second problem concerns the selection of prototype vectors from the input data space.
The first problem about codebook size is very much application dependent. There is no general algorithm to determine this number. Mäntyjärvi et al. [24] have empirically identified N=8 to be a good value, delivering satisfying results for 2D gestures. In accordance with their work, a codebook of size eight was chosen for our experiments as well.
For solving the second problem of finding appropriate prototype vectors, k-means++ algorithm was employed. The k-means++ algorithm [25] partitions M input vectors into N centroids. The algorithm initially chooses N cluster centroids among the M input vectors at random, where the probability of choosing vector x is proportional to its squared distance from any of the previously chosen centroids. Then each input vector is assigned to the nearest centroid, and the new centroids are calculated. This procedure is repeated until a stopping criterion is met, that is until the mean square error between input vectors and cluster centroids does not drop below a certain threshold, or until there is no more change in the cluster-centroid assignment. Since k-means++ algorithm only finds a local minimum, it is executed five times, and the best clustering in terms of distance between each input vector and the closest prototype vector (i.e., cluster centroid) is selected.
4.4 Feature Extraction for Nearest Neighbour Classification
The main purpose of feature extraction is to simplify recognition by compiling the vast amount of gesture data and obtaining the motion properties that define gestures individually. The feature extractor converts the digital accelerometer signal into a sequence of numerical descriptors, called feature vectors. The features provide a more stable, robust and condensed representation than the raw input signal. Feature extraction can be considered as a data reduction process that attempts to capture the essential characteristic of the gesture with a small data rate. Finding a compact, yet effective set of predictive features can greatly reduce the data sensitiveness to intra-class variation and noise, thus improving the recognition performance. Here, two types of features, statistical and structural, were combined. These features were chosen based partially on the results of prior work [9], [26] that dealt with triaxial accelerometer feature extraction and partially on insights gained from exploratory observations of the data.
Statistical Features: For each of the preprocessed acceleration signals, a set of ten statistical features was generated. These included the mean (μ), energy (ε), entropy (δ), standard deviation (σ), Pearson's correlation coefficient (γ) and total time (d). The first four features summarize the acceleration signal information for each dimension separately, and thus comprise eight features in total. The last two features are summarized meta-information about the signal - the strength of the linear relationship between two axis and the duration of the signal, respectively. It is worth noting that our analysis has treated each acceleration signal corresponding to a gesture as a single entity and has extracted features that describe the entity as a whole.
Motion Histogram: The histogram describes the distribution of angles (movement directions) that is very characteristic of the gesture shape. For instance, the Square gesture can be decomposed into four separate strokes with distinctive motion trends: down (↓), right (→), up (↑) and left (←). After analysing all other reference gestures from Figure 1, it became obvious that they all have unique stroke patterns for classification.
The direction in which the input device has been moved is determined by the angle that its resultant velocity vector forms with the horizontal axes. From elementary physics, velocity is an integral of acceleration. However, owing to the random noise associated with accelerometer measurements, an error-reduction technique, known as zero velocity compensation (ZVC) [27], needs to be employed, prior to direction detection, to compensate for integration-drift. Velocity compensation is achieved by adding or subtracting a slope, connecting two successive stationary points of the signal, to make velocity at these points the same as zero, since the velocity obtained by integrating acceleration must be identical to zero when there is no motion (i.e., when the phone is stationary).
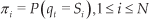
When creating the histogram, each time sample in the acceleration signal casts a weighted vote for the direction histogram channel based on the orientation of the resultant velocity vector and the acceleration magnitude at that particular time instant. The votes are accumulated in n direction bins spread uniformly over 0 to 360 degrees. We found that for n=8 the recognition process can clearly distinguish between nine reference gestures (cf. Figure 3). In order to account for the noise and variation of gesture data, the histogram is further normalized by using the L2-norm. This in turn produces a relatively simple gesture representation with an easily controllable degree of invariance to geometric transformations: tilts of the input device make no difference as long as they are smaller than the orientation bin size.
Distribution of direction bins during motion histogram forming for n=8
These two types of features are combined as follows: firstly, the statistical features are extracted from the gesture acceleration data. Secondly, the gesture sample is represented by its motion histogram. Finally, the two obtained feature sets are fused together, resulting in a single, 18-dimensional feature vector.
5. Experimental Results
5.1 Setup
To evaluate the statistical performance of the selected gesture recognition techniques, the gesture samples were collected from seven different participants, two male and five female, aged between 24 and 58 years, all but one of whom were right-handed. None of the participants were physically disabled, nor did they have much practice in performing gestures with a smartphone. On a daily basis, a single participant was allowed to make no more than five repetitions of each gesture. In total, each participant contributed with 270 samples for all gestures (30 repetitions per gesture), resulting in a grand sum of 1,890 segmented gesture samples from all participants.
The reported results were obtained by employing a ten-fold cross validation. For each participant, we divided the 30 samples of a single gesture into ten partitions, with three samples per partition. At each turn, a training set was created by randomly choosing m partitions for each gesture. The testing set was formed by putting together all the remaining partitions that were not used for training. This procedure was repeated ten times, after which an average recognition rate was computed. The final results were then averaged over all participants.
All algorithms were tested by running simulations over the collected database in MATLAB. A HMM solution utilized an eight-state left-to-right topology with a jump limit of one (at most one state can be skipped). One HMM was used to represent each gesture that needed to be recognized. Both discrete and continuous HMMs were examined. The discrete HMM (DHMM) used quantized gesture information, while in case of the continuous HMM (CHMM), the observation distributions for the processed gesture data were modelled by a mixture of two Gaussians. The HMM training and recognition were performed by making use of the Kevin Murphy's MATLAB toolbox [28].
For the DTW solution, two template selection strategies were adopted. The first strategy used a standard single template method (ST-DTW). DTW distance was computed for all pairs of training samples of a certain gesture type. The samples were ranked according to the sum of their DTW distances from other samples and the one with the lowest sum was selected as the reference template. The second strategy was to use a crosswords reference template matching technique (CWT-DTW). To create a crossword reference template for each gesture, an average length of all training samples corresponding to a particular gesture was calculated. Then, a sample with the length nearest to the average length was chosen as the best template candidate and has been considered as the initial reference template. Next, the other samples were time aligned by the DTW process such that their lengths are equal to that of the chosen initial template. The final reference template was obtained by averaging the time-aligned samples across each frame.
Mahalanobis distance metric for k-nearest neighbour classification was learnt, based on the extracted feature information, by using semidefinite programming, a method its authors named large margin nearest neighbour (LMNN) classification [23]. The LMNN training was achieved by utilizing a Weinberger-Saul special-purpose solver [29], which iteratively re-estimates Mahalanobis distance metric to minimize the objective function for LMNN classification. The amount of computation is minimized by careful book-keeping from one iteration to the next. In all the experiments, both DTW and LMNN classification was performed by looking at k=3 nearest neighbours. Figure 4 depicts the experimental setup for all three examined algorithms.

Experimental setup flowchart
5.2 Results and Discussion
Global performance: Figure 5 illustrates the global performances of each of the classifiers described above for varying number of per gesture samples used in training dataset composition. As is shown in this figure, the LMNN based classifier produces the best results, regardless of the training set size, reaching an overall average recognition accuracy of 98.26±1.22% versus 94.44±1.72% of CHMM classifier that achieved the second best performance before the CWT-DTW and the ST-DTW based ones. In nearly all of the experiments, the DHMM classifier provided the lowest performance in mean recognition rate, which is mainly due to the input data variability and the complexity to determine the automatic discriminant codebook. It should be noted, though, that in the final two sets of experiments, DHMM made up a lot of ground on its contenders, managing to overtake the ST-DTW based classifier for N=21 training samples per gesture. The two DTW based classifiers finished comfortably in the middle, with respectively 89.89±3.28% (ST-DTW) and 92.18±2.72% (CWT-DTW) accuracy. They started off pretty evenly; however, with the increase of the training set size, the CWT-DTW began to pull away performance-wise, leaving the ST-DTW based classifier behind. This can be explained by the fact that the ST-DTW uses only one of the provided per gesture training samples as the reference template, which makes it hard to cover user gesture variations.

Reported accuracies (%) of the tested classifiers for variable amount of per gesture training samples
Training set size impact: The LMNN based classifier yields a recognition accuracy well above 90% already with N=6 per gesture training samples, while with the same amount of training samples (most of) its contenders are struggling to reach that mark. With N=9 training instances, the LMNN accuracy is over 98%. This seemingly unimportant fact has far-reaching consequences application-wise. Asking the users to train nine gestures with more than six or nine training repetitions before they will be able to use the system with a satisfactory recognition performance is obviously a great nuisance and might just be the reason that will put them off accelerometer-based gesture interaction.
The effects of training set size can be studied further by examining the lowest recognition accuracies for particular gesture types achieved among the selected five classifiers, Table 1.
The lowest per gesture type recognition accuracies, depending on the number of training samples

Execution time: In order to ensure platform independence, the execution time of the selected classifiers was measured on a Thinkpad R50e laptop with an Intel Celeron M CPU running at 1.4GHz with 1GB of RAM. This older model laptop computer was deliberately chosen to mimic with its hardware the specifications of today's mid-range smartphones. The tests were performed on Windows XP with SP3. The execution time presented in the results was broken down to the time needed to train the classifier, so-called training time, and the time it takes the algorithm to recognize one gesture, so-called recognition time.
Figure 6(a) and Table 2 indicate that, compared with both HMM and DTW based classifiers, LMNN's average training time is generally shorter and, furthermore, it remains more or less constant (i.e., around 12.5 seconds), unaffected by the changes in the number of training instances. The training time of all other classifiers increases substantially as the size of the training set gets bigger. The ST-DTW based classifier has proved to be by far the slowest of all. In order to select the reference templates, the ST-DTW requires all per gesture training samples to be compared with one another. This is why its training time raises exponentially in terms of mean from 61.76 seconds for N=6 per gesture training instances to 783.38 seconds when the maximum of N=21 per gesture training instances were used. The differences between classifiers become even more apparent by examining their average recognition times (Table 2). With the training stage built completely off-line, the LMNN based classifier needs only about six milliseconds to recognize one data sample. On the contrary, the DTW solutions need to compare the input data with all nine reference templates to determine the final recognition result, and with each matching cost calculation taking approximately 80–90 milliseconds, it takes them, 751.25 (CWT-DTW) and 902.46 (ST-DTW) milliseconds, respectively, to reach a verdict on one data sample. Therefore, it can be concluded that LMNN has relatively low computational overhead and that it outperforms HMM and DTW-based solutions with regards to the execution time.
Comparison of LMNN, DTW and HMM based classifier performance characteristics. Recognition time refers to single gesture data sample.


(a) Training time (in seconds) and (b) recognition time (in milliseconds) vs. number of per gesture training instances
Storage space: When it comes down to the memory requirements, it can be seen that the LMNN classifier storage space consumption is comparable to that of HMM solutions and is significantly smaller in comparison with the two DTW based algorithms. In order to function properly, the LMNN classifier requires the existence of a Mahalanobis distance metric definition matrix, accompanied by the database of gesture data training samples feature vectors. For a maximum number of N=21 per gesture training instances, the two of them combined consume less than 22 kilobytes of available memory space, which is negligible.
6. Robot Manipulation Application
In this section, we present an implementation of the distance metric learning-based method on an Androidoperated smartphone to effectively turn it into a remote control for a LEGO Mindstorms NXT 2.0 robot. Our aim was to control the robot's behaviour through the use of gestures performed with the smartphone.
LEGO Mindstorms robots are fun to play with, but they are also educational. Many science-popularization programs use these robots to teach elementary and middle-school children program-solving skills and to introduce them to engineering and computer programming. These robots are easy to construct and run, and with a price of around $500 they can be considered relatively inexpensive.
The main unit in the NXT programmable robotics kit is a brick-shaped computer, called NXT Intelligent Brick. It can control up to three motors and take input from up to four sensors. The brick has a 100 × 60 pixel monochrome LCD display and four buttons that can be used to navigate user interface using hierarchical menus. It has a 32-bit ARM7TDMI-core Atmel AT91SAM7S256 microcontroller with 256 KB of FLASH memory and 64 KB of RAM, plus an 8-bit Atmel AVR ATmega48 microcontroller, and Bluetooth support. It also has a speaker and can play sound files at sampling rates up to eight kilohertz.
NTX 2.0 base kit additionally includes:
three identical interactive servo motors that have builtin reduction gear assemblies with internal optical rotary encoders that sense their rotations with one degree of accuracy;
two touch sensors capable of detecting whether they are currently pressed, have been bumped or released;
one colour sensor with a triple functionality: it distinguishes between six colours, detects the light level in one direction and functions as a lamp; and
an ultrasonic sensor that can measure the distance from the sensor to something that it is facing, and detect movement.
The application presented herewith is designed to work with a robot incorporating wheels and a colour sensor. The process goes as follows (Figure 7). Whenever the user inputs one of the predefined gestures, the accelerometer gesture data is recorded by the phone. The gesture start and finish are signal by pressing a designated button in the application screen. After the gesture data is obtained, it is being processed, as described earlier, and then, depending on the current mode of the program, which can be either training or recognition, it is stored in memory as the training data or it is sent to the recognizer to work out which gesture it represents. The recognizer, running on the smartphone, identifies the gesture type using previous training with a classification algorithm. At any point, the users can switch back to training, if they suspect that training data may not be enough to correctly classify a gesture. Once the recognition phase is completed, a command corresponding to the recognized gesture is sent to the robot for execution via Bluetooth. The gestures and the associated actions, utilized in the current application, are listed in Table 3.
Gestures and the corresponding actions for controlling the robot


Robot manipulation application overview. i) The user inputs the preferred gestural command that is being picked up by the phone's built-in accelerometer; ii) The algorithm identifies the most likely gesture and passes the corresponding command to the robot via Bluetooth; iii) The robot executes the command that he has been sent.
The complete application was evaluated in several laboratory experiments to examine the system recognition accuracy and latency. The experiments were conducted by a single user, with a robot placed on a flat (table) surface. The recognition rate obtained in this series of tests was in accordance with the results achieved by using LMNN to recognize gestures. The system computational efficacy was examined by computing the delay (time interval) between the time instant in which the user has finished performing the gesture and the instant in which it has been recognized. To measure this delay, the events shown in Table 4 were defined. Whenever a specific event occurred, our software invoked a system call in order to obtain system time. During experiments, we made sure no other applications were running on the phone simultaneously. The resulting average recognition time measured on the phone was 7.85 milliseconds, which is only slightly higher than the simulated recognition time for LMNN algorithm, given in Table 3. The overall average system response time from the end of the user gesture to the beginning of the appropriate robot action was under 100 milliseconds, which is the limit for having the user feel that the system is reacting instantaneously.
Two event types. Ti denotes the time the i-th event is recorded

7. Conclusion
Using physical gestures as intuitive expressions is a promising approach that could change the way users interact with computers. This is especially true for mobile devices whose shrunken form factors can make interacting with them a rather cumbersome task. In this paper, we have proposed a solution based on an LMNN distance metric learning algorithm for accelerometer-based gesture recognition, and we have compared it to two classical pattern recognition methods: the geometric approach using DTW and the statistical approach based on HMM, with an aim of addressing the limitations of these algorithms, that have not been satisfactorily addressed in the previous work. The cross validation results we have presented indicate that LMNN exhibits good generalization performance, achieving an overall average recognition rate of 98.26% versus 94.44% of CHMM classifier that finished as close second. Besides, the results show that LMNN reaches recognition accuracy well above 90% already with N=6 per gesture training samples, something other examined classifiers are struggling to do.
By evaluating the LMNN classifier's execution time, we have demonstrated that it has relatively low computational overhead, invariant of the number of training samples used, and that recognition is performed much faster than in the case of both HMM and DTW. This fact could be beneficial for devices with a low computing power, as they could achieve real-time gesture recognition. Furthermore, since LMNN's standard gesture patterns are simple feature vectors represented by 18 numbers for each gesture, such a recognition system would not require big database and would therefore not eat up to too much of the available memory resources.
In addition, we have developed a simple, prototype, human-robot gesture-based interaction system using Android smartphone and the proposed solution. The system worked smoothly and produced a satisfactory performance, with fast recognition times and without introducing any human perceptible lag between expected and final robot action. The experiments conducted showed that our method holds promise as an intuitive user input interface for applications in which users want to control external devices or equipment through gestures performed with their smartphones.
For future work, we will carry out user-independent experiments to see how the LMNN performs in such cases. With respect to the developed human-robot interaction system, we will explore how to extend it to include gesture spotting, since the fact that the user needs to signal when a gesture starts and ends can have a negative impact on its usability. Furthermore, we plan to run a full-scale systematical evaluation of the said system performance in terms of interaction intuition, response delay and error tolerance.