
Abstract
This paper presents the design and real-time decoding of a color symbol that can be used as a reference marker for optical navigation. The designed symbol has a circular shape and is printed on paper using two distinct colors. This pair of colors is selected based on the highest achievable signal to noise ratio. The symbol is designed to carry eight bit information. Real time decoding of this symbol is performed using a heterogeneous combination of Field Programmable Gate Array (FPGA) and a microcontroller. An image sensor having a resolution of 1600 by 1200 pixels is used to capture images of symbols in complex backgrounds. Dynamic image segmentation, component labeling and feature extraction was performed on the FPGA. The region of interest was further computed from the extracted features. Feature data belonging to the symbol was sent from the FPGA to the microcontroller. Image processing tasks are partitioned between the FPGA and microcontroller based on data intensity. Experiments were performed to verify the rotational independence of the symbols. The maximum distance between camera and symbol allowing for correct detection and decoding was analyzed. Experiments were also performed to analyze the number of generated image components and sub-pixel precision versus different light sources and intensities. The proposed hardware architecture can process up to 55 frames per second for accurate detection and decoding of symbols at two Megapixels resolution. The power consumption of the complete system is 342mw.
1. Introduction
An Automatic Guided Vehicle (AGV) or robot must able to measure its own current position for safe localization and navigation within indoor environments. In an outdoor environment Global Navigation Satellite System (GNSS) provides an effective solution for measuring the current position and also gives guidance for navigation. In an indoor environment GNSS signals are attenuated by multiple reflection from roof, walls etc. By this attenuation the accuracy of the GNSS becomes very low. Several indoor localization techniques have been developed e.g. Ultra Wideband based indoor localization [1], Wireless Local Area Network (WLAN) based localization [2] etc. Optical methods have evolved for the accurate positioning of an object in indoor environments.
Position sensing using cameras is based on methods for finding and mapping references in the surrounding environment. These reference structures can be obtained from the natural surroundings [3] or from reference symbols planted into the surrounding environment. Visual Simultaneous Localization and Mapping (VSLAM) provide a solution for indoor navigation based on exploiting natural references [4]. Finding natural reference structures in the surrounding environment while searching a large database of related reference positions becomes a very demanding task on any computational platform. On the other hand, a well coded reference symbol that can be planted into any indoor environment can be made so that it can be found easily and will require less computational burden.
There are several application areas of mobile robotics that provide a structured environments and opportunities for coded reference structures. This includes harsh indoor environments such as chemical, nuclear and biological plants with applications such as robotic inspection, maintenance and repair. Mobile robotics is also well suited for logistics and transport applications in well-structured environments such as warehouses, factories or transport terminals. Applications also include similar outdoor environments that are either GPS-denied (e.g. due to structures blocking satellite line of sight, or in underwater environments) or where GPS does not provide sufficient accuracy and reliability. Visual navigation based on coded symbols could be used as a standalone navigation system in some cases when there will always be at least one symbol in sight, or when the robot is able to move relatively accurately in dead reckoning mode between the symbols. Such landmark-based navigation would require a map with known location of the symbols, which must be assumed to be available in the structured environment [6]. In order to increase accuracy, robustness and to extend to a situation or where symbol locations are sparser or the robot motion accuracy is low, an integrated navigation system with sensor fusion could be made. The coded symbols can be used to aid navigation by means of inertial sensors and odometry [7].
In this paper, the design of a reference symbol and a corresponding method for real-time symbol detection and decoding will be presented. The symbol is composed of two distinct colors and this pair of colors is selected based on the highest achievable Signal to Noise Ratio (SNR) [8]. The circular shape of the proposed reference symbol makes it rotationally independent. The decoding of the proposed symbol is much simpler as compared to QR codes. QR codes were designed to store large amounts of data on a limited spatial area. QR codes have a complex detection process, require long processing time and feature extraction is not stable [12].
Optical methods for real-time position sensing have become feasible due to substantial technological progress and commercial market growth for high resolution imaging detectors [9]. In addition to new detectors, there has also been a remarkable development of programmable hardware platforms providing resources for massive parallel embedded computation [10]. Exploiting this parallelism for the computation of position and orientation requires more research on hardware architectures that can efficiently mapped onto heterogeneous combinations of FPGA circuits and processor kernels. This has provided the motivation to develop an implementation centric method for real-time detection and decoding of a color symbol.
An overall data-flow graph of operations for decoding the symbol that is proposed is presented in Figure 1. The front-end data flow intensive image processing tasks are modeled at the Register Transfer (RT) level for implementation on the programmable hardware FPGA. The back-end control-flow intensive parts are captured by imperative programming in C for computation on a micro-controller. The image sensor MT9D112 from Aptina, operating at 13 frames per second at a resolution of 2 Mega pixels, is used to capture images. The captured color images are preprocessed, where all possible regions of interest are separated from the background. The preprocessed and segmented images are labeled such that each image object is assigned a unique label. In addition to the labeling process the image object features area, bounding box and Centre of Gravity (COG) are accumulated. These extracted features provide sufficient information to detect the sets of image components defining our Regions of Interest (ROI) from the remaining set of spurious components. After successfully determining the regions of interest, the component features defining all ROI via Serial Parallel Interface (SPI) are transmitted to a second chip. This second chip is a 32bit Atmel AVR micro-controller, which is finally used to decode the 8 bit coded symbol identities. The designed symbol is shown in Figure 2. The symbol consists of an outer red color circle that can be used to identify the ROI in a segmented image. Inside the ROI there are ten circles, two of them are bigger than the reset of circles. The small eight circles are code bit circles that can be used to encode 256 distinct values. The two reference circles can be set as a reference to direction of decoding. In this paper, the present the experiments and results for the camera distance in which the symbol can be accurately detected will be presented. The will also be a discussion with regards to the sub-pixel precision under different illumination conditions.
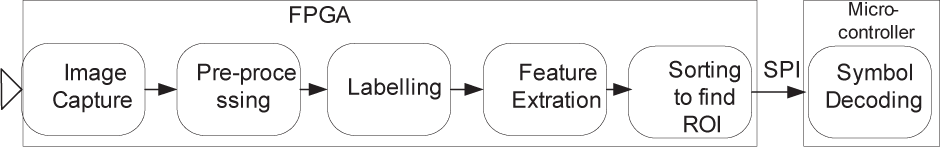
Dataflow operation for symbol decoding

Designed symbol
The key requirements for the proposed reference symbol and its corresponding method for real-time detection and decoding are:
Symbol must provide a unique identity code and allow for an easy and efficient segmentation method. Hence, it should be possible to segment the symbol from a complex image background without generating too many spurious image objects. This requirement has already been verified in a previous publication [8], Algorithm for detection and decoding should allow for an efficient implementation achieving high frame speed, low latency and low power, The symbol should provide an accurate spatial reference in the image plane with highest possible sub-pixel accuracy, Detection and decoding of the symbol must, to the largest possible extent be independent of illumination, projection angle, scale, position and rotation in image plane.
The main contribution of this article is a method for real time detection and decoding of a reference symbol used for optical navigation. This symbol is designed while maintaining the focus on the hardware architecture. The proposal is for a parallel and pipelined hardware architecture that can provide high throughput at low power consumption, ensuring high frame speed for real-time detection and the decoding of symbols present in a complex image background. The insensitivity to variation in illumination, scale and rotation while providing good spatial sub-pixel accuracy makes the designed symbol, in combination with proposed method for real-time decoding, suitable for optical navigation. The proposed symbol and method for real time decoding is a valuable scientific contribution within the area of robotics.
2. Related work
Reference markers used in navigation systems are specially designed patterns, for pose estimation of the machine vision system. The advantage of using markers is that it can be easily extracted from its background if compared to the extraction of natural features. The related research on reference markers used in indoor positioning of machine vision system is as follows:
Jian-tung Wang [13] used QR code, combined with the idea of augment reality (AR). A prototype system called QRAR was implemented. The advantage of using QR code is that it provides error correction and carries an abundance of information. The drawback of QR decoding is that it involves geometrical pixel transformations to compensate for the variation in projections. These transformations are different for each symbol and must be performed before data can be read. The average processing time per frame for detection only and not including decoding is 0.4s.
StarGazer sensor system [14] analyzed images of infrared rays reflected from a passive landmark attached to the ceiling in an indoor environment. The land marker consists of different point patterns, which can be arranged as a 3×3 or 4×4 matrix. The land marker is associated with location, direction and ID information. The maximum localization range of the system is between 440 and 630 cm and the accuracy of the system for pose estimation lies in the sub-desimeter range.
Mulloni et al. [16] implemented a real time indoor navigation system by using a fiduciary marker and off-the-shelf camera phones. Markers are attached to walls or posters in an indoor environment. These markers can be encoded for 36 bits data but they used 9 bits at each of marker's sides in black and white squares. The 2D markers are used to estimate the pose in three degrees of freedom, 3DOF. The maximum tilt angle for decoding of the markers is 70 degrees, which is relatively small and also affects the accuracy of the system. The system can determine its position with a the precision of a few centimeters.
Nakazato et al [18] proposed a user localization system based on invisible markers for wearable augmented reality. The user can estimate its pose by recognizing the markers using an infrared camera. The invisible markers are affixed to the ceiling by means of wallpaper. The markers are square and contain a unique pattern of dot points. The system is designed to a cover large area but the author found it difficult to assign a unique identity to all markers. The accuracy of the system localization is in centimeters.
The study of related work shows different approaches adopted by various researchers for optical positioning. Using coded symbols as a reference structure is not a novel idea [12,14]. Our accumulated scientific contribution in optical position sensing is, instead, focused on providing real-time and power performance at a speed that has not been seen in any of the related research works. This high performance is achieved by co-designing a symbol and its corresponding method for detection and decoding.
The main contribution of this article is a method, and its related hardware architecture for real time detection and decoding of a reference symbol.
3. Image processing operations
In this section, the different image processing operations as presented in Figure 1 along with the design of a coded symbol will be presented.
3.1 Image capturing
The Aptina MT9D112 is a 1/4-inch 2 Mega pixel CMOS image sensor. This camera system features a microcontroller (MCU) and a sophisticated image flow processor (IFP). The microcontroller manages all the components of the camera system and sets the key operation parameters for the sensor core in order to optimize the quality of raw image data entering the IFP. The sensor core consists of an active pixel array of 1616 × 1216 pixels, programmable timing and control circuitry including a PLL and support for an external flash. The camera can be programmed through an I2C interface for different image resolutions and PLL settings. For all experiments presented in this paper, the camera was set to operate at the maximum resolution i.e. (1600×1200) and at a frame speed of 13 frames per second.
3.2 Image preprocessing
Captured pixel data from the image sensor is preprocessed before the symbols can be detected. This preprocessing includes the following three steps:
Color model conversion
Dynamic Segmentation
Thresholding
The primary spectral components Red Green and Blue (RGB) can be coded from an interpolation filter operating on pixel responses from a Bayer pattern image sensor. However, the wide wavelength light spectrum intensity is represented on all three color components RGB resulting in information redundancy.
The YCbCr color model is merely another way of encoding the RGB color model such that the intensity and color information becomes less redundant. The Y channel of YCbCr carries information regarding luminance while Cb and Cr represent color. The Cr component of the YCbCr color model has been used in this case. A pair of background and foreground colors is then selected such that the highest possible SNR is achieved on the Cr channel [8]. The Cr channel output is then further processed at a dynamic segmentation step. High SNR for the symbol leads to fewer segmented spurious image components. Consequently, a printed label can be highlighted within a complex image background such that the total number of components after segmentation is reduced. Less image components will ease the workload on the computational platform [8].
We have also studied other segmentations techniques presented in literature. A fuzzy color classification base image segmentation in presented in [15]. The presented method is based on human perception of colors using fuzzy logic. The process need many iterations before pixels can be assigned to a search space. The author also presented rule base approach which is more robust. The presented approaches give good result in simulations. For time-critical machine vision applications we need simplified algorithms that can be parallelized for efficient hardware implementation. The presented approach in [15] is not suitable for direct hardware implementation. Another segmentation method base on people counting application is presented in [16]. The authors used the approach of taking frame difference, applying morphological operations and then region growing technique. The applied technique require frame buffer to store intermediate frames, thus increasing memory utilization and power consumption.
The 2-dimensional Gussian filter is designed in MATLAB and convolves with the input image as shown in Figure 3. The details of designed filer can be found in [27]. A final thresholding is applied to segment the filtered Cr channel of its input image and convert it into a binary image. One way to determine this threshold value is to find global maximum pixel intensity in a gray scale image and set the threshold depending on this value e.g. 25 percent of the maximum pixel intensity. This method for dynamic thresholding is too sensitive to image noise and generates a great deal of spurious image objects. Instead, in this case, a more exhaustive approach to dynamically set the threshold value has been developed. Instead of computing the threshold based on a global maximum gray scale value, an average of maximum gray scale values from eight consecutive rows is computed. The threshold value is then experimentally set to a percentage of that average maximum. The proposed method for dynamic thresholding is less sensitive to noise if it is compared that when using a global maximum.
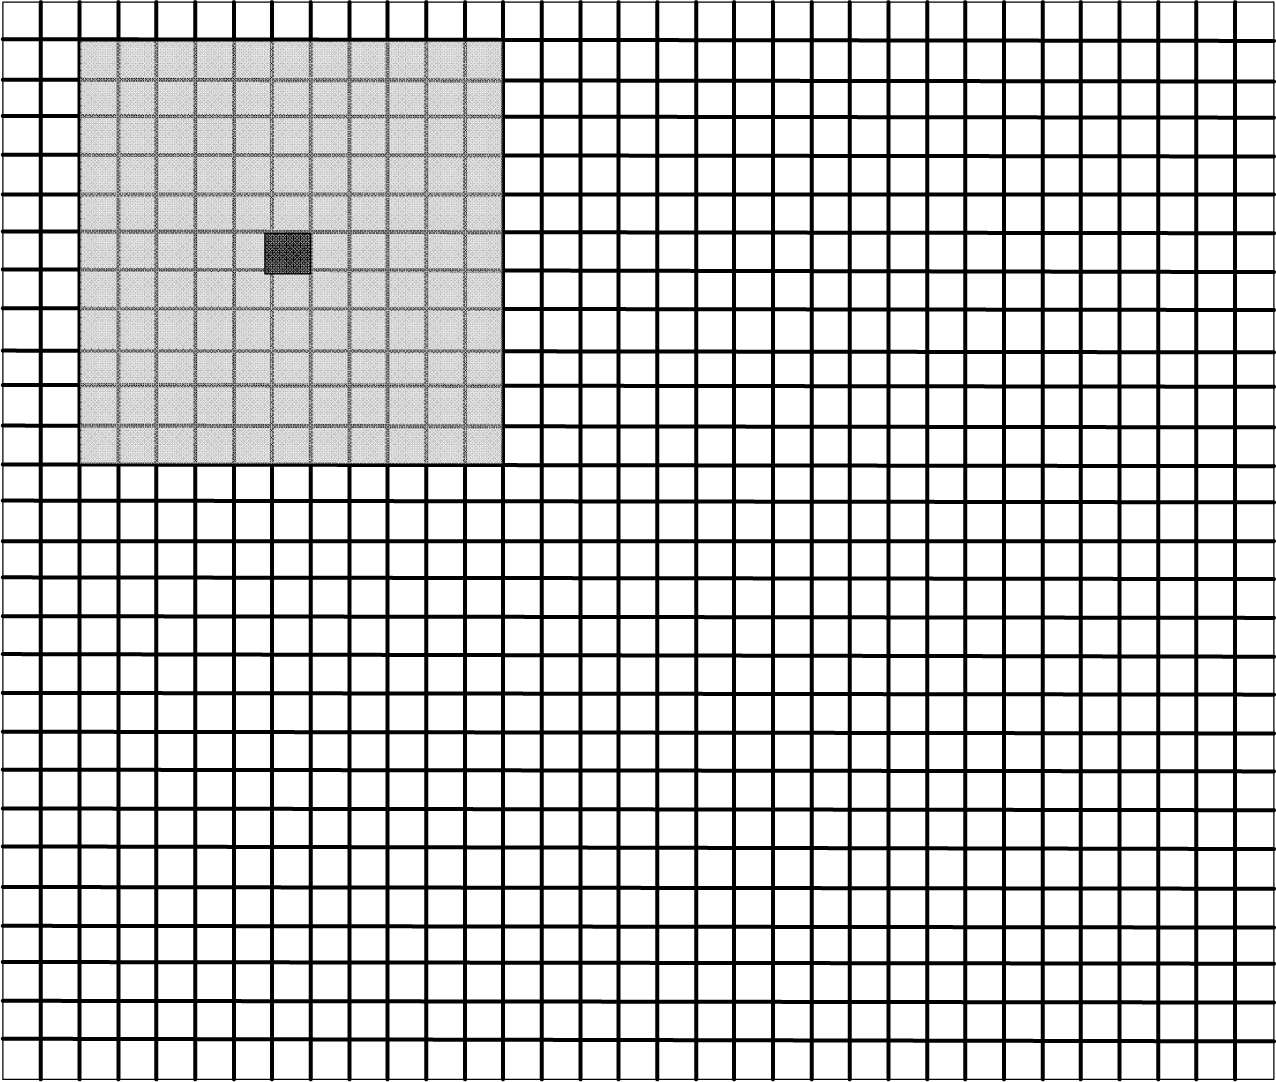
The computation of the 2-dimensional convolution required for the 11 by 11 pixels filter, shown in Figure 6, involves massive access regarding the pixel data stored in the memory. Implementation of such a large convolution would thus lead to an exploding requirement regarding the memory bandwidth if special care is not taken. An application specific memory hierarchy is therefore introduced to exploit the reuse of data such that the requirement with regards to the memory bandwidth is kept to a minimum. Figure 4 shows a memory hierarchy that provides access to a 3 by 3 pixels neighborhood. This 3×3 memory hierarchy is just an example, actual memory hierarchy will be of 11×11 Input pixel data is continuously shifted into this memory hierarchy, providing fast register access to a neighborhood of pixels. For our experiments, line buffers are implemented in the FPGA block memories while registers are located close to the data path of computations. This design technique is not novel, but it's extremely important in order to allow for high frame speed and low power consumption [11].

Dynamic segmentation

(A) Pixel neighborhood (B) Memory architecture for preprocessing
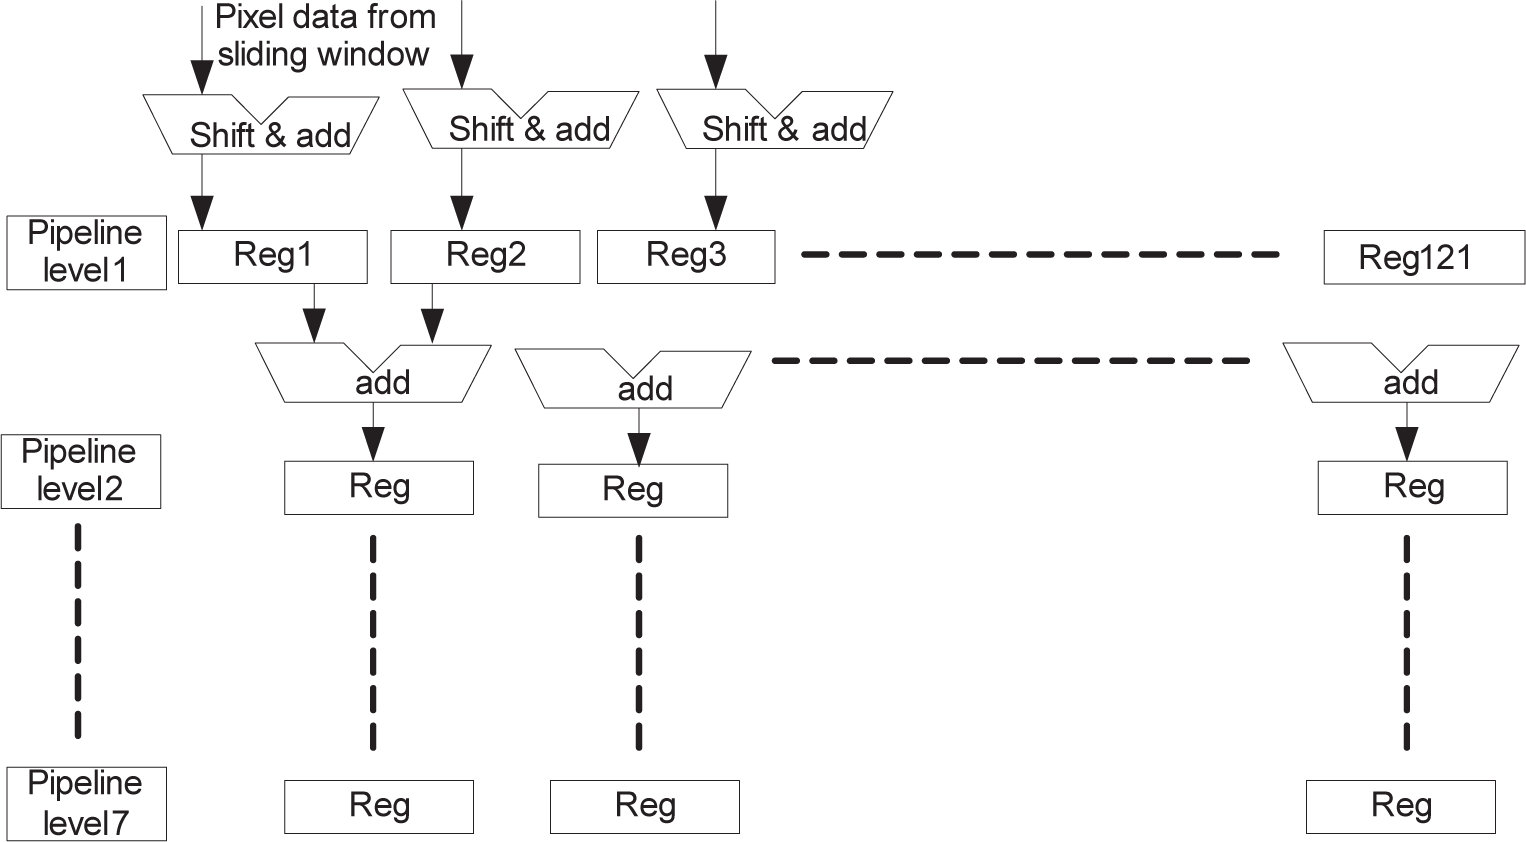
Pipeline architecture for shift and add operations
For the RT level modeling of dynamic segmentation, the filter coefficients are obtained from MAT AB. These floating point values are quantized into 12 bit fixed point coefficients. The typical neighborhood of a pixel is shown in Figure 5. To compute the output of a single pixel, 121 multiplications and 120 additions are required. At the RT level, these costly multiplications are replaced by shift and add operations. To efficiently model the shift and add operations for an 11×11 convolution, the data path is pipelined into 7 stages. The architecture for the shift and add operations is shown in Figure 5. This pipelined architecture minimizes the delay paths from register-outputs to inputs such that the maximum clock frequency on which the whole system can run is increased. This increase in maximum clock frequency will, in turn, result in the higher possible frame rate.
Neighborhood for convolution process
A binary image is input to a process often referred to as blob analysis. All pixels belonging to a connected image component (blob) are assigned a unique set of labels during the scanning of the input binary image. Data for the computation of features are, at the same time, accumulated into a set of memories. The hardware architecture for image component labeling and feature extraction is shown in Figure 7(b). For the labeling process of a typical image, the neighborhood is shown in Figure 7 (a). The pixel P5 is assigned a label based on its neighboring pixels P6 to P9. A delay line of one FIFO-buffer and two registers hold the labels assigned to the previous row [20]. The kernel for labeling and feature extraction is depicted in Figure 7 (b). The labeler assigns labels to P5 depending on its neighbors. If the labeler does not find any labeled pixels in the neighborhood, a new label is assigned to P5. If the labeler finds two different labels in the neighborhood of P5, then P5 is assigned to one of these labels and the detected pair of labels must be recorded as equivalent. This reason for this is that all the connected pixels must be recognized as belonging to the same image component. The equivalences are recorded in Table A or B based on an odd or even frame. Equivalences are resolved after labeling the whole frame such that all labels in an image component should have the same value. This label assigning and resolution runs in parallel in Table A or B. Along with the labeling process the data for feature extraction is also accumulated in Data table A or B. When all equivalences are resolved in Table A or B, the Table ready signal is sent to the feature extraction unit e.g. COG calculation in Figure 7 (b). For symbol decoding experiments, three features are extracted: area, bounding box and COG. However before the symbol can be decoded it must firstly be detected.
3.3 ROI and symbol detection
After sorting all image components by means of their feature data, the ROI for all symbols present in the binary input image is extracted. The bounding box feature is used in this case to locate the outer big circle of the symbol. The difference between the width and height of the bounding box around the outer circle should be within a specific threshold value to qualify as being an ROT In our experiments, this value is set at to 30 pixels. Once the outer circle is located, a check is made for exactly 10 components to be located inside the ROI, otherwise detected ROI is not belonging to a valid symbol. The feature data of objects present in all ROIs belonging to the symbols are sent to a micro-controller for further decoding of the symbols. An SPI link, operating at 8 MHz is used for this communication. In the experiments with three symbols in a video frame, the number of segmented image components varies from one to two hundred. To avoid this communication overhead, the ROI in the segmented image is determined and only features related to the detected symbol are sent from the FPGA to the micro-controller.
The design of the reference symbol is based on the selection of a pair of foreground and background colors to allow for efficient image segmentation. [8]. The structure of the color symbol is simple, but, it is still able to carry one byte of encoded information. The symbol consists of one large circle (ROI), which contains two reference circles and 8 bit circles as illustrated in Figure 2. The distance from a bit circle to the origin is used to code its value to either one or zero. A threshold distance from the origin defines the value of an encoded bit circle. If the distance from the origin to the bit circle is less than the threshold value then the bit circle is assigned the value of zero, otherwise it is one. Two reference circles are used to define the weight of the other eight bit circles used to carry information. During decoding, the bit circles are scanned in a clockwise manner, starting from the vector defined by the two reference circles at zero degrees. This mechanism allows the symbol to be decoded independently of its rotation. Eight bit binary encoded data are represented by eight bit circles. For the experiments presented in this paper, the code size carried by the symbol is limited to eight bits. However, this code size could easily be extended if required.
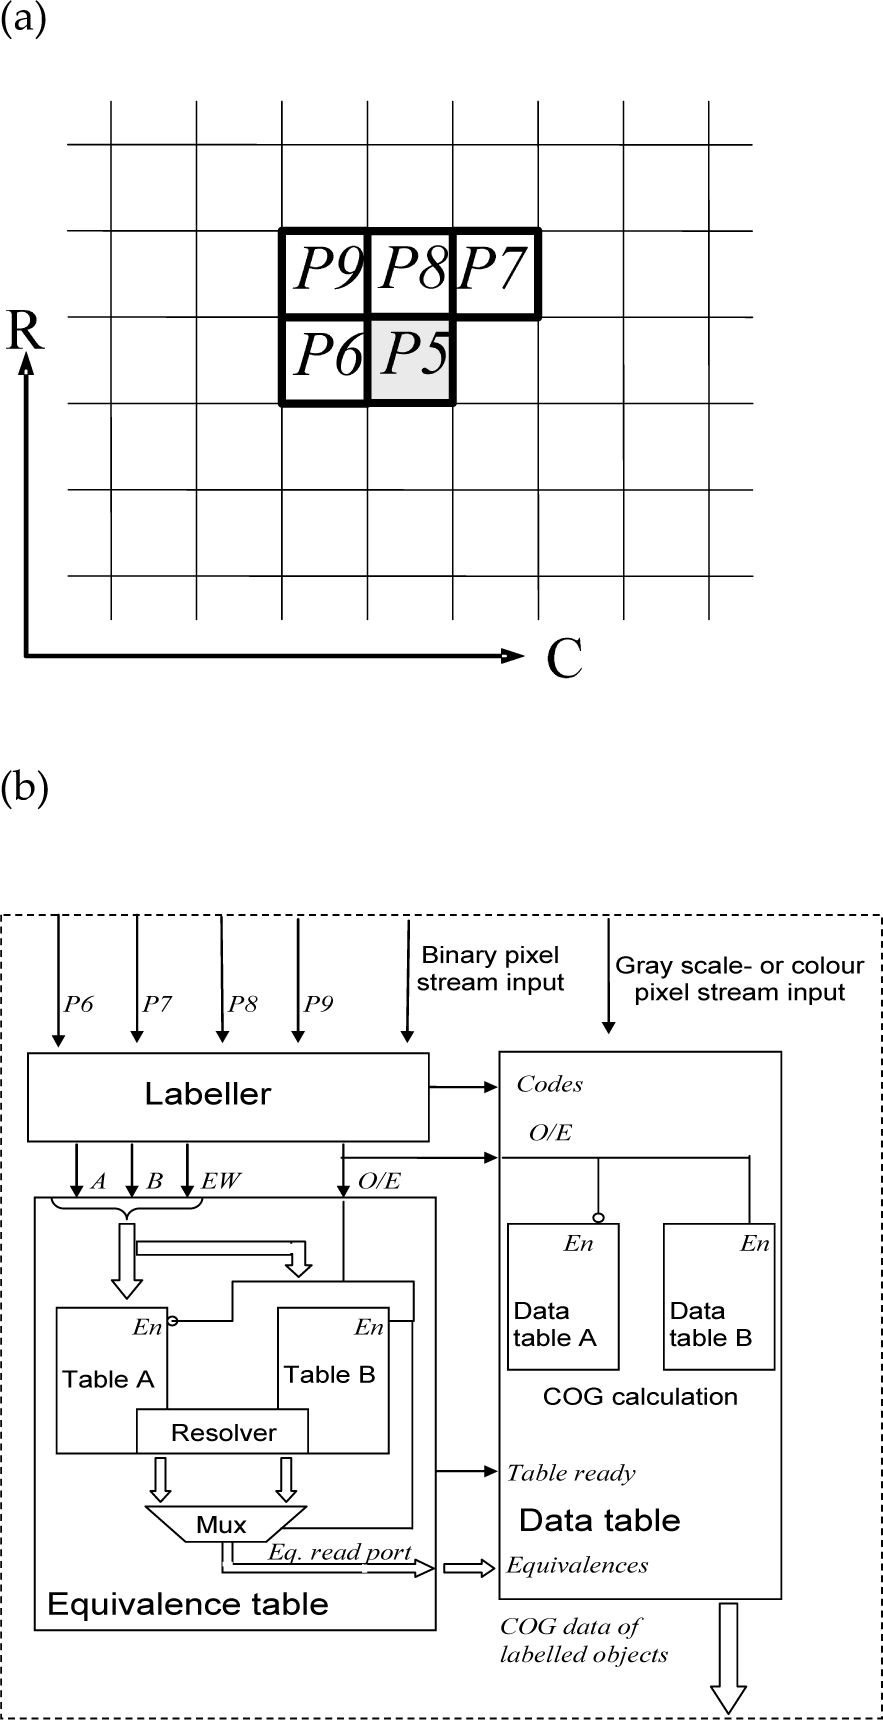
a) Pixel neighborhood, b) Hardware architecture for component labeling and feature calculation.

Experiment on rotational independence
3.3.1 Encoding
A Matlab script for assigning the information data to the labels has been developed. The circles of different radii have been defined. The big outer circle (AOI) is followed by the smaller reference circles and the bit circles. For the correct detection of the label at maximum distances, the space between the bit circles is fixed. Input data, which ranges from 0 to 255 decimal numbers, can be given and the identity code is assigned to the label as shown in Figure 2.
3.3.2 Decoding
The decoding of the symbols is computed by the microcontroller. Once the feature data for the symbols are transferred into the micro-controller, the angles and distances with respect to the origin and for all image objects within the ROI, are computed. Two reference circles are detected based on their area being larger than for the eight bit circles. The reference circle, located at the center of the ROI, is defined as the origin while distances and angles are computed using a polar coordinate system. The two reference circles define zero degrees. For rotationally independent decoding of the symbol, the least significant bit will always be detected first, when scanning clockwise starting from zero angles.
4. Experiments and results
In this section different experiments and results for symbol detection and decoding, maximum frame speed and power consumption are presented.
4.1 Rotational independence and maximum camera distance from symbol
The circular nature of the proposed symbol and the method used for decoding makes the symbol rotationally independent. Experiments were performed in order to to check this rotational independence as well as the correct detection and decoding of the symbol at different distances and viewing angles. A 1/2 inch Aptina CMOS sensor, having a 3.1 mega pixel resolution attached to a lens with a focal length of 24mm was used for these experiments. The experiments were conducted in different complex backgrounds. The results from decoding a symbol at arbitrary rotations are shown in Figure 8. The second type of experiment deals with recognizing the symbol at maximum distances and at various viewing angles as shown in Figure 9. The results from this experiment are summarized in Table 2. The Maximum distance for the successful detection and decoding of a symbol and, at a viewing angle equal to 90° is 10.7 m.

A), B) Detection and decoding of the symbol at 10.7 m having 90o view angle. B), C) Symbol located at 7 m having 45o view angle. E), F) Experiment for the recognition of the symbol at 10 m having view angle of 60o.

Experimental setup
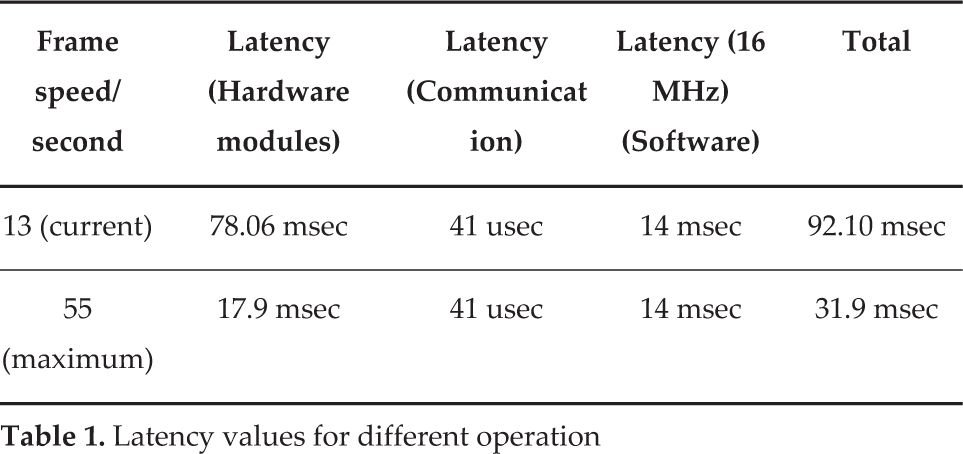
Latency values for different operation
Distance and angle of camera from reference symbol

4.2 Maximum frame speed and latency
The latency and frame speed are very important design metrics for reactive machine vision systems such as optical navigation. The modeling of data image processing tasks on an FPGA will enable short latency and high frame speed. The experimental setup for real time decoding of the reference symbols is shown in Figure 10. The Aptina image sensor MT9D112, operating at a frame rate of 13 frames per second with a two mega pixel resolution, is used to capture the images. The micro-controller is operating at 16 MHz. Captured images are fed to the FPGA to perform data intensive image processing operations. The binary image generated after thresholding is sent through an HDMI interface for displaying on an external monitor. Figure 10. The total latency of the proposed system is calculated from the accumulated measured latencies caused by hardware modules on the FPGA, communication and software on the microcontroller for decoding. The latencies are measured at a throughput of 13 frames per second and estimated for a system running at maximum frame speed. See Table 1. The maximum frame speed is calculated based on the maximum clock frequency that the Xilinx toolset gives after synthesis of the design. In order to calculate this maximum frame speed, any camera synchronization overhead is excluded. This is possible for the proposed system since the developed hardware architecture has no dependency on row synchronization. Latency for the hardware modules on the FPGA and the software on the microcontroller were measured using a logic analyzer.
4.3 Power consumption
The estimated power consumption for the proposed system is presented in Table 3. The power consumption for the FPGA is obtained after post place and route simulations using the Xpower tool, provided by the Xilinx tool set. DC current measurements for the microcontroller are made using the digital multi-meter 34410A from Agilent [21]. This digital meter can sample the data at 10 KHz and store samples on a host computer. The micro-controller only remains in active mode for 14 msec out of 92 msec. For the remainder of the time, the micro-controller can be put into sleep mode, where it only draws 75 uA of current. The power consumption for the microcontroller, presented in Table 3 is the mean power calculated by taking the sleep mode into account.
Power consumption @ 13 frames/second

4.4 Sub-pixel precision using different light sources
In this section, the results from the experiments on sub-pixel precision using different light sources will be presented. The centeroid value of the symbol's central circle was used for this experiment. The key idea for these experiments is to determine the variation of the computed centeroid values, using different light sources and under different light intensities. Four different light sources were used for this experiment: incandescent lamp 40W, fluorescent lamp 17W, LED lamp 7w and halogen lamp 1KW. The wavelength spectrums from these light sources are shown in Figure 11 and Figure 12. These spectrums are measured using a KVANT spectrometer [22]. Experiments were also performed at different light intensities in order to observe how this was affecting the sub pixel precision and the number of segmented image components. Light intensity is described as Luminance and was measured using the LUX meter LM-120 at a position close to the symbol [23]. For all these experiments, only one source was used to illuminate the symbol. The Aptina image sensor MT9D112 was configured for automatic control of exposure and gain. The result from computing the standard deviation of a series of centeroid values and the corresponding generated number of segmented image components is presented in Table 4. It can be seen that high luminance will result in a lower standard deviation of the computed centeroids. High luminance will also result in a reduced number of segmented image components. For approximately the same luminance, but using different light sources, the number of generated image components as well as the precision of the centeroid values, remains almost the same.
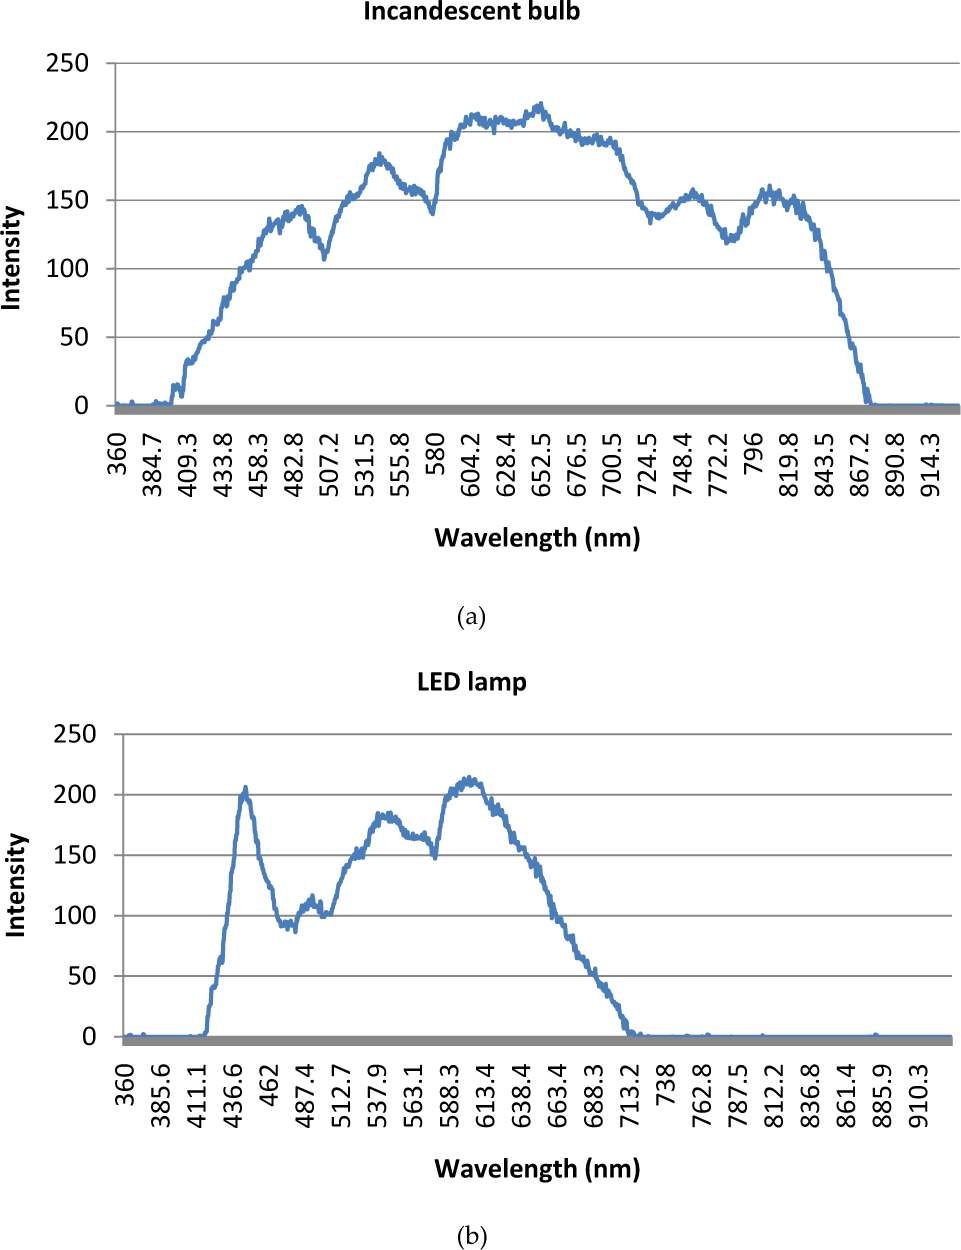
Light sources spectrum a) Incandescent bulb b) LED lamp

a) Light sources spectrum Fluorescent light b) Halogen lamp
Experiments on sub pixel precision using different light sources

5. Discussion
Camera based optical position sensing plays an important role for indoor navigation of robots and AGV. Optical methods become particularly interesting for environments where GPS signals are attenuated or their accuracy is low. Reference symbols with known locations in the environment can be used for the computation of the camera pose in 3DOF or more [14]. In this paper the design and real-time decoding of one such symbol has been presented.
The proposed symbol has a circular shape printed using two distinct colors. Experimental results show that designed symbol is rotationally independent and can be detected and decoded correctly at distances from 0.9 to 10.7 meters. Closer than 0.9 m, the symbol is out of field of view and cannot be detected. If a camera lens having a focal length less than 24mm is used then it becomes possible to detect it for distances less than 0.9 m but, then, the maximum range will be reduced.
For time critical vision systems such as optical navigation the latency should be low. This latency value is dependent on the frame speed of the video signal generated by the image sensor and the time necessary for computing the 3DOF position. In order to keep a low latency of the computational platform, hardware architecture has been developed for data intensive image processing tasks. The maximum clock frequency reported by Xilinx toolset is 107MHz. This clock frequency corresponds to 55 image frames per second when using a two megapixel image sensor. The latency value at this maximum achievable frame speed is 17.9 ms. The maximum frame speed and latency is also dependent on the image resolution. If a lower resolution results in an acceptable image quality, the frame speed can be increased further and the latency will decrease correspondingly. The latency for decoding symbols in software running on the micro controller is 14 msec. This latency was measured when the micro-controller was operating at a 16 MHz clock frequency. This latency can be reduced to 3.6 msec if the AVR32 micro-controller is operated at its full speed i.e. 60 MHz.
Power consumption is an important issue when the camera and image processing platform is operated by a battery e.g. camera aid for visually impaired persons [24]. The same requirement can be seen in camera based indoor robotic navigation. It can be noticed from Table 3 that the Aptina image sensor is the major source of power consumption [25]. Researchers are actively working to reduce the power consumption for image sensors. A characterization of different CMOS image sensors is presented in [26]. They report that in the active state of an image sensor, the analog read-out circuitry consumes 70–85% of the total power. The digital controller and image processing consumes 5%. The I/O controller that manages external communication consumes 10–15%. They also propose strategies to lower the power consumption for image sensors i.e. by clock scaling and putting image sensor into standby mode when possible. The energy reduction is about 30–40 % by applying these techniques.
In section 4.4 the result on sub-pixel precision using different light sources has been presented. It has been shown that the proposed system is able to correctly decode the symbol using different light sources having a different spectral distribution. A reasonable standard deviation can be obtained after computation of the centroid values. A standard deviation of 0.06 means that the precision of the centeroid values is equal to or less than+/-1/17 of a pixel at the 68 percent confidence level. 1/80 of a pixel was reported in [27] for experiments using near infrared LEDs as reference objects and at an SNR of 20. Lower sub-pixel precision was reported for a lower SNR. SNR is known to be dependent on many parameters: light intensity, pixel size, aperture of optics and exposure time. For the experiment using a 1 kW halogen lamp, the expectation was that better sub-pixel precision could be obtained. We think that the reason for the lower precision was that the automatic exposure control reduced exposure times when the light intensity was increased. There was no possibility to measure the exposure times for the Aptina MT9D112 image sensor. For a robot in motion, short exposure times are of equal importance as SNR. This is because, motion and long exposure times will eventually cause a blurring of images which, in turn, will lead to reduced precision.
The total number of segmented image components at different light intensities has been reported. Experimental results show an increase in the number of segmented image components, as the light intensity decreases. It can be seen in Table 4 that, in general, it is the number of image components less than eight pixels that increases. This is expected since a lower light intensity leads to more image noise and a lower SNR, which generates small spurious image components stemming from the noise. What is most important is that symbol was correctly detected and decoded for all test cases reported in Table 4. Thus, the conviction is that the proposed color symbol and its related method for detection and decoding are reasonably robust with respect to spectral distribution and intensity of illumination.
6. Conclusion
This paper presents the real-time decoding of a color symbol for optical navigation in a GNSS denied indoor environment. The results show that the designed symbol can be detected and decoded within a distance between 0.9 and 10m from the image sensor. The results also show that the segmentation process is robust and that the proposed symbol provides good spatial reference under different light sources and intensities.