
Abstract
This work investigates robots' perception in underground terrains (mines and tunnels) using statistical region merging (SRM) and the entropy models. A probabilistic approach based on the local entropy is employed. The entropy is measured within a fixed window on a stream of mine and tunnel frames to compute features used in the segmentation process, while SRM reconstructs the main structural components of an imagery by a simple but effective statistical analysis. An investigation is conducted on different regions of the mine, such as the shaft, stope and gallery, using publicly available mine frames, with a stream of locally captured mine images. Furthermore, an investigation is also conducted on a stream of dynamic underground tunnel image frames, using the XBOX Kinect 3D sensors. The Kinect sensors produce streams of red, green and blue (RGB) and depth images of 640 × 480 resolution at 30 frames per second. Integrating the depth information into drivability gives a strong cue to the analysis, which detects 3D results augmenting drivable and non-drivable regions in 2D. The results of the 2D and 3D experiment with different terrains, mines and tunnels, together with the qualitative and quantitative evaluations, reveal that a good drivable region can be detected in dynamic underground terrains.
Introduction
The mining industry forms a crucial part of the South African economy. In 2009, according to the Chamber of Mines of South Africa [1], the industry contributed:
93% of the country's electricity generating capacity. about 18% of gross investment (10% directly). over 50% of merchandise exports. about one-million jobs (500 000 directly). approximately 30% of capital inflows into the country's economy. 8.8% directly, and 10% indirectly, to the country's gross domestic product (GDP). about 30% of the country's liquid fuel supply. between 10% and 20% of direct corporate tax receipts (worth R10.5-billion).
Thus, mining remains crucial for the country's economy. However, the twin needs for safety and efficiency in the mining industry have called for the serious attention of researchers and practitioners in recent times. Figure 1 shows the death rate of miners, per million hours worked. According to a report in 2011 [2], fatalities are still unbearable in line with the trend experienced in the recent past. Much effort has been directed to mine safety in the past decade as the consensus is that one death is one too many.

Fatality Rate of Miners Per Million Hours Worked
In the quest to address safety issues in mines, it is widely recognised that autonomous robots could play a key role. Robots can be used for checkpoint and safety inspection tasks [3] in a mine. This information would serve as cautionary or danger information for situation awareness and decision-making purposes in mines. Figure 2 shows a general overview of what robots can achieve in underground mine safety. However, an effective vision model (robots' perception) is critical for safe autonomous navigation within an underground terrain.
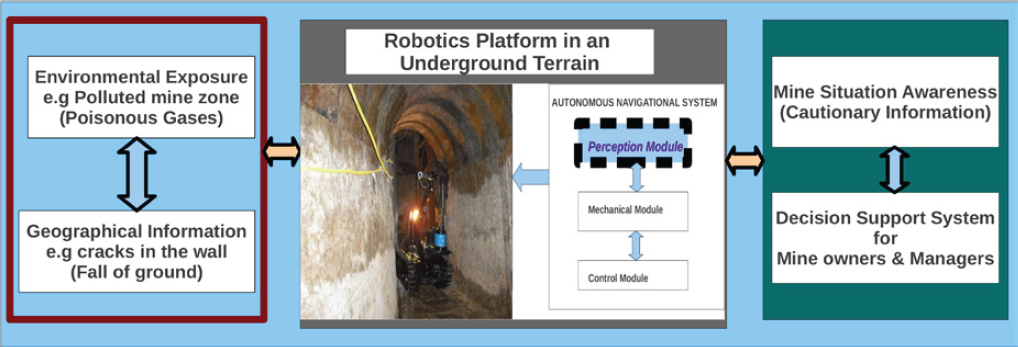
Overview of Robotics Potential in Underground Mine Safety
A good perception of robots is part of the critical ingredients that often formulates safe autonomous navigation. How the robot perceives and interpret its immediate environment is crucial [4]. However, several research efforts have been directed towards autonomous navigation in underground environments and research continues in this area. The use of sensor fusion in 3D visualisation of underground terrains is currently gaining much attention from researchers [3]. Figure 3 depicts a robot navigating a mine environment. This research focuses on the perception module (which comprises sensors with high-quality visual capabilities), a critical component in autonomous navigation, while the mechanical and control modules fall beyond the scope of this study. The perception module aims to capture observations of the environment (standard and high-resolution imagery), based on the robot's current position (x, y, z), and to specify which region is safe for the robot's navigation. A major focus in this research is the enhancement of robots' capability of identifying drivable regions in underground terrains.

Overview of Autonomous Robot Navigation in a Mine
Robots' ability to perceive and interpret its immediate environment adequately is central to an effective and safe autonomous navigation. However, drivability analysis of underground environments, with visualisation results in 3 dimensional view is still an ongoing research. In this work, we conducted an experiment using publicly available underground mine images with images captured in a local mine and on a stream of dynamic and rough underground tunnel images captured with the aid of the 3D XBOX kinect sensor device. Using the SRM and entropy models together with data fusion from the two kinect (laser and infrared) sensors, we obtained promising results where drivable region and non-drivable region are clearly distinguished. Evaluation is also carried out for useful qualitative and quantitative conclusions and future adoption. The major goals of this paper are as follows:
Modelling and application of the entropy and SRM in drivability analysis of underground terrains using publicly available mine images with a stream of images captured locally in an underground mine. Experiment is also conducted on a stream of dynamic underground tunnel images captured with an XBOX 3D Kinect sensor. The augmentation of 2D results with 3D drivability maps for autonomous robots, which would need to climb steps in the mines, and benchmarking the proposed model with related methods and images.
To the best of the researchers' knowledge, though being widely used in computer vision, the entropy and SRM models have never been applied to underground terrains.
The rest of the paper is organised as follows: Section 2 presents some related work. In section 3, the methodology and framework is presented in detail. Section 4 follows with experimental results and a review of the outcome measures for qualitative and quantitative performance evaluation. Section 6 concludes the paper and future work is also presented.
Background Studies
Related Work
The problem of improving the vision of robots for autonomous navigation has gained significant attention over the years [5]. Notably is the DARPA grand challenge [4] which is intended to spur innovation in unmanned ground vehicle navigation. The goal of the challenge was to develop an autonomous robot capable of traversing unrehearsed off-road terrain. Several approaches have been adopted to address the aforementioned problem, most of which are domain-specific. However, research on autonomous navigation in underground environments continues. Underground mines, which present unique and terrain-specific human hazards, still call for the serious attention of researchers.
Joaquin et al. [6] propose an approach to a visual-based sensory system for an autonomous navigation through orange groves. They used colour camera with auto iris and VGA resolution for the image capture and a neural network (multilayer feedforward network) to classify the ensembles together with hough transform. The aim of their work is to establish the desired path for autonomous robot within an orange grove. For example, in agricultural robotics where autonomous robots are used for weed detection or spraying fungicides. The findings from their research show promising results that could assist autonomous navigation.
Derek et al. [7] address the issue of recovering surface layout from an image. Their work presents a partial solution to the spatial understanding of the image scene (environment), which aim at transforming a collection of an image into a visually meaningful partition of regions and objects. Using statistical learning based on multiple segmentation framework they constructed a structural 3D scene orientation of each image region. They went further to conduct experiments on indoor scenes which correspond to underground tunnel images in this research.
Zhou et al. [8] put much effort into road detection using a support vector machine (SVM) based on online learning and evaluation. The focus in their work is on the problem of feature extraction and classification for front-view road detection. According to Jian et al. [9], the SVM is defined as a technique motivated by the statistical learning theory, which has shown its ability to generalise well in high-dimensional space. SVM attempts to separate two classes by constructing an N-dimensional decision hyper-plane that optimally maximises the data margin using the training sample. In the problem of road detection, the SVM classifier is used to classify each image's pixel into road and non-road classes based on the computed features.
Angelova et al. [10] put much effort into fast terrain classification by using a variable-length representation approach to build a learning algorithm that is able to detect different natural terrains. They used a hierarchy of classifiers to classify different natural terrains, such as the sand, soil and mixed terrain. Their ultimate goal was to classify different terrains for autonomous navigation.
One of the few studies on 3D imaging is the work of Andreasson et al. [11] They focus on methods to derive a high-resolution depth image from a low-resolution 3D range sensor and a colour image. They use colour similarity as an indication of depth similarity, based on the observation that depth discontinuities in the scene often correspond to colour or brightness changes in the camera image. This work hinges on the work of Thrun et al. [12], which deals with acquiring accurate and very dense 3D models in excavation sites and mapping of underground mines using laser range finders.
From the literature, it is observed that much research on improving robots' vision in different scenarios/environment has been conducted. However, Underground terrains have received little attention, probably owing to their roughness and environmental/technological constraints [13], compared to structured and unstructured surface terrains. Thus research on the topic continues.
In this work, we aim to enhance robots visual capability in an underground mine by exploring drivability analysis of the mine in dynamic scenarios. The entropy and SRM models are used for extracting features (colour and texture), thereafter image region segmentation and classification is carried out. The goal is to accelerate autonomous mine safety inspection tasks and consequently improve mine productivity.
While autonomous navigation in an underground mine environment has been studied for more than twelve years [14], a robust algorithm that is applicable in different terrains is yet to emerge. Thus, it remains an ongoing key challenge. Several segmentation algorithms exist, such as the k-means, entropy and edge detection based methods, but in this research a statistical approach based on the entropy and SRM models is adopted. Our choice of the entropy and SRM models is motivated by the existence of interesting statistical and probabilistic properties, such as separability, homogeneity and measure of randomness, in the models. The aforementioned properties appear promising for the segmentation task in this research.
Entropy Model
Entropy is defined as the number of binary symbols needed to code a given input given the probability of that input appearing on a stream. Entropy of an image is a statistical measure of randomness that can be used to characterise the texture of the input image [15, 16]. High entropy indicates a high variance in the pixel values while low entropy is associated with fairly uniform pixel values. Since entropy is a measure of randomness, it provides a way to compare different regions (drivable and non-drivable regions) of the mine frames. The entropy of the mine images is computed using Equation (1) such that every pixel in the entropy filtered image (EFI) is measured within a fixed window (9 × 9 window in our case) which accounts for a reasonable percentage of the textural distribution of each pixel region [17].
The entropy for the pixel neighbourhood window is computed as shown in Equation (1).

where qv represents the probability that a random pixel, say p, chosen from the window centered at pv will have intensity i. The computation is done using the non-zero values of the histogram samples probability, say qv, for every point, say h, in the sample histogram as shown in Equation (2).

The entropy filter measures the relative change of entropy in a defined or sequential order [18]. For each pixel p(i, j) in the EFI, there exists corresponding pixels p1, p2, …, pN, (N = 9, in our case), for each mine image. The local entropy ki measured within a fixed window, for each pixel pi in each image, is computed and the weighted average p is computed as shown in Equation (3).

A region is a group of connected pixels with some homogeneity in feature property. Image segmentation refers to the process of partitioning a digital image into multiple regions (sets of pixels). Segmentation is a collection of methods allowing to interpret parts of the image as objects by transforming the pixels into visually meaningful partition of regions and objects. The object is everything that is of interest in the image and the rest of the image is considered as the background. For an image I and homogeneity predicate Hp, the segmentation of an observed image I is a partition K of I into a set of G regions, R1, R2, … RG, such that the following conditions hold [19]:
Hp(Rg) = true ∀g Hp(Rg ∪ Rh) = false ∀ adjacent(Rg, Rh) ∪
G
g=1 Rg = I with g ≠ h and Rg ∩ Rh = Ø
Statistical region merging (SRM) models segmentation as an inference problem by performing a statistical test based on a merging predicate and has been widely used in medical imaging and remote sensing imagery [20–23]. Nock et al. [21] present an elaborate theoretical analysis of the SRM algorithm in order to analyse the underlying principles. SRM is applied to skin imaging technology in [22] so as to detect borders in a dermoscopy image, in an attempt to analyse a skin cancer (melanoma).
In region merging, regions are iteratively grown by combining smaller regions or pixels. SRM uses a union-find data structure or merge-find set that is defined as follows:
Find: Determines if two elements (pixels) are in the same subset. Union: Merges two subsets (sub-region) into a single subset (region) based on some criteria.
A major limitation of SRM is overmerging, where an observed region may contain more than one true region. It has been shown that the overmerging error is more or less insignificant as the algorithm manages an accuracy in segmentation close to optimum [21]. The idea is to reconstruct the statistical (true-similar) regions of an observed image instance.
The algorithm relies on the interaction between a merging predicate and the estimated cluster, Q, specified. The merging predicate, P(R, R_), on two candidate regions, R, R', is depicted in Equation (4) with an extension in Equations (5) and (6).


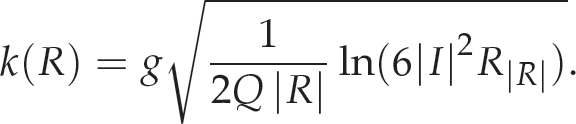
Rc is the observed average colour channel c in region R and R|R| represents the set of regions with R pixels.
Let I be an observed image with pixels |I| that each contains three (R, G, B) values belonging to the set {0, 1,…, g − 1 pixels} where g = 256. The observed image I' is generated by sampling each statistical pixel for the three RGB channels. Every colour level of each pixel of I' takes on value in the set of Q independent random variables with values of [0, g/Q]. Q is a parameter that describes the statistical complexity of I', the difficulty of the problem and the generality of the model [23]. The optimal statistical regions in I' satisfy the property of homogeneity and separability.
Homogeneity property: In any statistical region and given any colour channel, the statistical pixels have the same expectation value. Separability property: The expectation of any adjacent statistical region differ in at least one colour channel
Equation (7) defines the sort function [21], where pa', pa represent pixel values of a pair of adjacent pixels of the colour channel.

Proposed System Model for Drivability Analysis
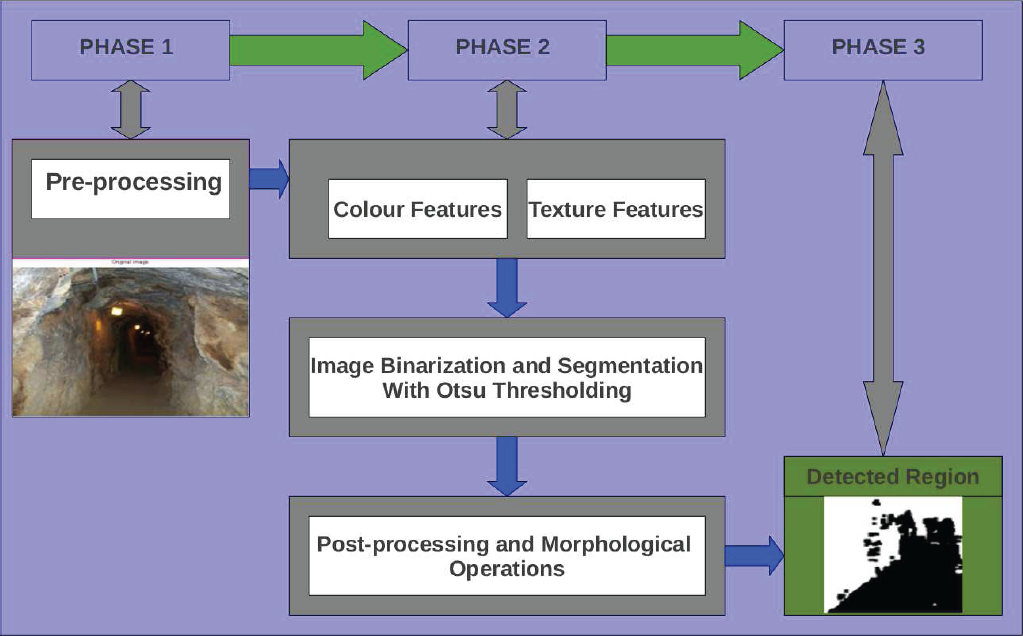
This work conducts a drivability analysis of underground terrains for autonomous robots by devising means through which drivable regions can be identified in underground terrains. This consequently improves the vision of a robot, allowing it navigate only on drivable regions in a mine frame, thereby minimising accidents while executing its tasks. Figure 4 depicts the proposed system model for robots' perception.

Depiction of the Proposed System Model (Perception Module) for Robot's Drivability
In this work, the tested mine frames are a combination of those captured from a local mine, as well as those available on public online repositories [24]. The underground tunnel image frames are captured with the 3D XBOX kinect sensor device as shown at the top left of Figure 6. Figure 5 shows the general layout of the capturing cycle.

Overview of the Kinect Frames Capturing Cycle.

Experimental Setup - Robot Sensor Data Capturing Platform
The 3D kinect sensor device, with the XBOX 360 console, consists of two major sensors, which are the RGB sensor and the Depth sensor. The RGB sensor produces RGB images while the depth sensor produces the corresponding depth information/images as shown in Figure 6. The depth sensor consists of the infrared laser projector and an infrared sensor. The laser projector projects the data while the infrared sensor calculates the time taken for the laser rays to hit the target environment. The experimental setup is moved along the underground pathway for image capture as perceived by an autonomous robot. To capture underground surface environment, the sensor is mounted with a small tilt angle θ.
The XBOX kinect sensor simultaneously produces depth and RGB images of 640 × 480 resolution at 30 frames per second (fps). The depth data from the device calculates, in millimeter (mm), the distance of each pixel's location relative to the sensor device. We might also get unknown depth pixels especially if the rays from the sensor are hitting a shadow, window etc, the depth data returns zero under such situation. Furthermore, unknown depths may be partly due to the limitation in the precision or accuracy of the depth sensor. The depth images indicate how far or near each pixel's region is perceived by the sensor in the target underground environment. The fusion of the multi-sensory data (RGB & Depth) enhances our knowledge of the image structure and allows our system to obtain an additional information about the vanishing points which might have occurred as a result of the perspective effect [25].
Entropy Approach to Drivability
Figure 7 describes the interlinked streams of the entropy approach used in this work.
Sequential Block Diagram of the Entropy Model
Image downsampling has become a regular operation during image processing for computational efficiency. However, conventional image downsampling methods do not accurately represent the appearance of the original image, and the perceived appearance of an image is altered when the resolution is lowered [26]. An image downsampling filter that preserves the appearance of blurriness in the lower resolution image is needed. Several downsampling options exists and the choice of downsampling varies for different applications but in this work, we use an appearance preserving downsampling filter called spatial antialias. Spatial anti-aliasing is the technique of minimising the distortion artifacts known as aliasing when representing a high-resolution image at a lower resolution. The choice of resolution for an image depends on the application at hand. The images used in this work were down-sampled to 300 × 225 resolution as part of the pre-processing stage.
Initial processing is usually carried out on raw data prior to data analysis. This is necessary to correct any distortion due to the characteristics of the imaging conditions and imaging system. The grayscale image used as the input is obtained by averaging the three RGB (reg, green, blue) colour channels for each pixel p in image I. In order to aid visual interpretation, the image contrast is enhanced with a histogram equalisation as shown in Figure 8 and features were computed at each pixel location, Pi. Figure 8 shows the graphical representation of the number of pixels in an image as a function of their intensity. The x-axis are the pixel intensity levels while the y-axis represents the number of pixels corresponding to each intensity level.

Image histogram and the Corresponding Transformed Histogram
Let I be a given image represented as a Pr by qr matrix of integer pixel intensities ranging from 0 to L–1, where L is the number of possible intensity values, often L = 256. Let k denote the normalised histogram of I. Then

The histogram equalised image, say k', will be defined as

The floor of x depicted ⌊x⌋ is defined as the nearest integer ≤x. Equation (9) is equivalent to transforming the pixel intensities, p, of I by the function

In this research, the purpose of segmentation is to identify the navigation area in the mine images, that is, the image classification in two types of objects: drivable and non-drivable areas. Figure 9 shows a mine frame and the corresponding entropy filtered image obtained according to the description in Section 2.2. One way to apply the entropy concept to image segmentation is to calculate the gray-level transition probability distributions of the co-occurrence matrices for an image and a thresholded bilevel image, respectively, then find a threshold which minimises the discrepancy between these two transition probability distributions, i.e. their relative entropy. The threshold rendering the smallest relative entropy will be selected to segment the image.
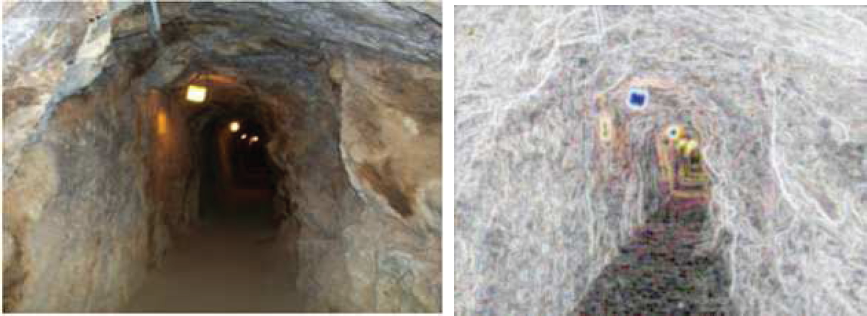
Original Frame and the Corresponding Entropy Filtered Image
In this work, after pre-processing the image and computing colour and texture features, we begin the search for an ideal threshold using a segmentation technique proposed by Otsu [27].
In general, the thresholding process is seen as the partitioning of pixels of an image in two classes: P1 (object) and P2 (background). This method is recursive and searches the maximization for the cases: P1 (0,1,…, T) and P2 (T + 1, T + 2, …, L − 1), where T is the chosen optimal threshold and L the number of intensity levels of the image. Otsu thresholding method exhaustively search for the threshold that minimises the intra-class variance σ2ω(t) defined in Equation (11) as a weighted sum of variances of the two classes.

Morphological operations are often used to understand the structure of an image. In this work, the main morphological operation utilised can be likened to flood-filling which are referred to as erosion and dilation.
The initial assumption is that the entropy would return similar probabilistic distribution for pixel regions sharing the same textural properties (i.e. drivable area) within a mine frame. However, this cannot be guaranteed in its entirety as there could be some interference (noisy pixels) in the processed mine frame. Morphological operations help in reducing such interference by removing isolated blocks within a mine image and thereafter revealing large area of connected pixels. The erode/dilate filter helps to remove small wrong areas (areas with some noise). Figure 10 shows an example of the effect of morphological operation on a mine frame.

Morphological Operation on Image Classification
The SRM algorithm has two important criteria: the merging predicate and specified cluster Q, which determines the number of segments/regions, for the input image. SRM is noted for its computational efficiency, simplicity and good performance as seen in Section 4.1. The flexibility of Q is a major advantage as a trade-off parameter that is adjusted to obtain a compromise between the observed results and the strength of the model. In our experiment, after testing with different values of Q, the value Q = 32 gave the optimal result for the image classification. Figure 11 presents the segmentation results of a mine frame at different Q levels. Q is a parameter that controls the coarseness and busyness of the classification.

Stages of Region Merging/Segmentation on a Mine Frame at Different Q Levels.
The algorithm uses a 4-connectivity scheme to determine adjacent pixels relative to the center pixel (in green) as shown in Figure 12. The pixels are sorted in ascending order based on the sort function in Equation (7). Thereafter, the algorithm considers every pair of pixels (p, p') of the set DI, which is the set of 4-connectivity adjacent pixels, and performs the statistical test based on the merging predicate. If the regions of the pixels differ and the mean intensity are sufficiently similar enough to be merged, then the two regions are merged.

Depiction of the Four-Connectivity Scheme
The SRM method presents the list of pixels belonging to each segmented region with their average mean intensities. We focus on the pixels region which forms clusters at the base of each observed image I towards the midpoint when scanning from the left. This forms the pixel region closer to the robots view and thus, the drivable part as can be seen in the test cases presented.
Pseudocode for SRM Algorithm
We give a qualitative and quantitative (confusion matrix) evaluation approach as a measure of performance of the two methods described in this work. The qualitative evaluation which is the visual comparison is presented in Sections 4.1 and 4.2. The quantitative evaluation is presented in Section 4.3. In this work, we considered the confusion matrix validation technique. We repeated the confusion matrix procedure n times, with n ∊ {3, 5}, where each n subsamples are used exactly once as the validation data [28]. The idea is to evaluate the accuracy level (hit rate) of the algorithms (entropy and SRM) in the following context.
True positives (TP): The number of drivable pixels correctly detected (correct matches). True Negatives (TN): The non-matches pixels that were correctly rejected. False Positives (FP): The proposed pixel matches that are incorrect. False Negatives (FN): The proposed pixel matches that were not correctly detected.
Thus, the accuracy (acc %) is given as;

The focus of this work is to enhance the visual capability of autonomous robots in dynamic underground terrains, by identifying drivable regions through cummulative processing of mine frames.
Experiment 1: 2D Qualitative Observations on Underground Mine Terrains
In the experiment, different test cases of mine frames were carefully chosen from publicly available mine frames [24] and on a stream of images captured from a local mine using common photo cameras. The test cases are representative of different regions, such as the shaft, stope and gallery, in an underground mine environment.
Figure 13(a) presents the intermediate and final results obtained using the entropy model. The first row of Figure 13(a) comprises of original mine frames, the second row presents the observation using the entropy filter while the third row consists of the corresponding thresholding results using the Otsu method. The last row presents the RGB representation of the final classification with the upper part (red region) as non-drivable and the lower part (green region) as the drivable part.

2D Drivability Results on Underground Mine Terrain
Figure 13(b) presents the qualitative detection results on mine frames using the SRM algorithm. The first row presents the original mine frames. The second row presents the results of the clusters generated for regions with homogeneity, with the drivable part mostly at the base region. The third row presents the RGB representation of the drivable regions extracted for corresponding frames. The base (green colour) region indicates the drivable region while the upper (red colour) region represents the non-drivable region. It is clear from these results that SRM has the ability to reconstruct the structural components and retain clusters of the mine images that are closer to the robot's view. One can see that pixel regions closer to the robot's view tend to form most of the drivable region.
Figure 13(c) presents the qualitative comparison of entropy and SRM on some mine frames. The first row presents the original mine frames while the second row are the detections using the entropy model. The last row presents the results obtained using the SRM algorithm for corresponding mine frames.
Experiment is conducted on a stream of underground tunnel images captured with the aid of the 3D XBOX kinect sensor. The underground images comprise rough and dynamic tunnel images as presented in Figures 14 and 15 respectively. For space management, only a few frames are presented. Figures 14 and 15 show the 2D and 3D qualitative results of rough and dynamic tunnel images using the entropy and SRM models.

2D and 3D comparison of Entropy and SRM Models on Rough Tunnel Frames

2D and 3D Qualitative SRM Results on Tunnel Frames
It is important to note that when constructing 3D imagery of a scene, the 2D information provides a valuable starting point. The cartesian coordinate in three-dimensions (x, y, z) helps to specify each pixel point uniquely and reveals the ground truth of the image classification in reality. On a three-dimensional cartesian coordinate system, the x and y axis gives the pixel value information while the third, z, axis depicts the depth information.
The depth cue provides useful information about the 3D scene of the image classification as regards the floor, wall and roof region of the tunnel frame. Thus, it creates an accurate understanding of where an autonomous robot should navigate in real time.
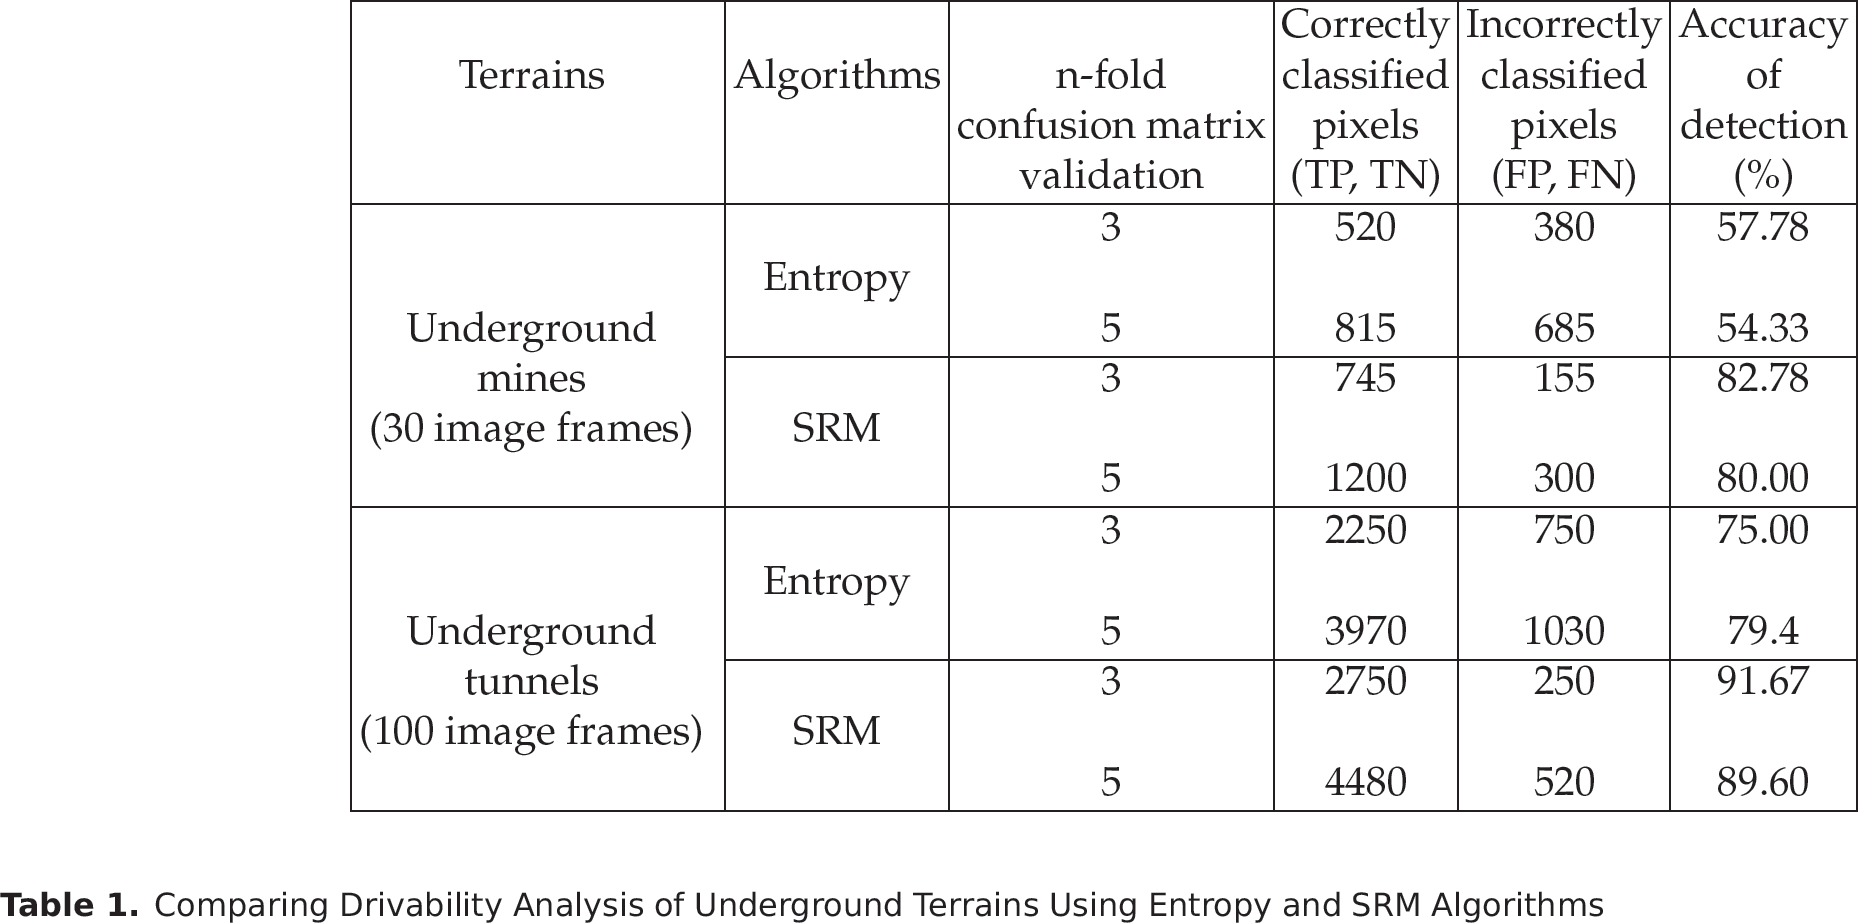
In this section, we present the quantitative results of the two terrains (mine and tunnel), based on the applied algorithms. We conducted experiments to evaluate the quantitative performance of both entropy and SRM approaches to drivability. We utilised the confusion matrix validation process n times (n ∊ {3, 5}). In the experiment conducted, we randomly hand-labelled pixel positions with the aid of an automated code (10 pixels per time for n-fold validation, making 30 pixels per frame [30 frames = 900 pixels] for 3-fold and 50 pixels per frame [30 frames = 1500 pixels] for 5-fold). The correctness of the pixel (i, j) is evaluated based on its current classification position(x, y) in the detected frame relative to its position (x, y) in the original frame. The estimated confusion matrix validation accuracy is the overall number of correct classification divided by number of instance in the image-data Id. Table 1 shows the quantitative performance of the algorithms with n = 3 and n = 5. One can see that the entropy method has a higher accuracy in underground tunnels classification than in underground mines classification. This is partly due to the fact that underground mines are very unstructured compared to tunnels, which are relatively smoother. However, one can arguably conclude that the SRM method outperforms the entropy method in almost all scenarios.
Comparing Drivability Analysis of Underground Terrains Using Entropy and SRM Algorithms
Comparing Drivability Analysis of Underground Terrains Using Entropy and SRM Algorithms
Since there is no common set of image data of similar terrain for the different existing techniques, comparison between different detection approaches may be difficult. However, we compare some existing techniques relating to image segmentation and drivable detection systems and explain how our proposed approach show promising results. The detail is presented in the subsequent sections.
Experiment 1: Benchmarking the Proposed Model with Publicly Available Images and Methods
To validate the performance of our detection algorithm, publicly available images and methods are used as a benchmark [7, 9]. Figure 16 shows the input images (tunnel frames and ground based unstructured road frames) and their corresponding detection results using the entropy and SRM methods. It is worth mentioning that our results for the input images, using the entropy and SRM algorithms, provide an alternate method for drivable region detection on the frames. Furthermore, there are no 3D results for the tested frames as we did not have access to depth maps of the images which provide critical information for the 3D image visualisation.

Validating our Approach with Publicly Available Image Frames and Methods
We also evaluated the quantitative performance of related existing approaches to detection and compare with our proposed methodology. Table 2 presents the quantitative evaluation result of the images used for benchmarking in Figure 16. It also shows that our proposed approach shows improvements on the study of drivable detection systems.
Quantitative Results of Validating SRM and Entropy with Existing Approaches

Quantitative Results of Validating SRM and Entropy with Existing Approaches
We compare existing methods of detection systems with our proposed approach. Table 3 presents the features comparison of related detection approaches with our proposed method. It also reveals how our proposed approach contributes to the body of knowledge on drivable region detection in underground and ground-based terrain, as earlier revealed in Figure 16.
Comparison of Existing Detection Systems with the Proposed Approach

Comparison of Existing Detection Systems with the Proposed Approach
This work has demonstrated the feasibility of enhancing robots' capability of identifying drivable regions in underground terrains. The statistical approaches, entropy and SRM algorithms, are investigated as means of identifying drivable regions in underground terrains because they show promise in their statistical feature property. These methods, especially SRM, exhibit a peculiar mix of statistics and algorithmics with a low segmentation flaw, both quantitatively and qualitatively as revealed in the experiment. The methods also have the tendency to offer a reasonable overhead for robots' memory in real time. Different regions of the mines representing a wide variety of terrains ranging from the stope, shaft and gallery were investigated. We also conducted an experiment on a stream of underground tunnel image frames captured using the XBOX Kinect sensor and further benchmarked our approach with publicly available images and methods.
Using the entropy approach, the computed local entropy gives useful textural information about the pixels' distribution. The entropy returns probabilities of the randomness of the pixel, pi, grey tone within a fixed window. The probabilistic textural information was used in the underground image classification together with Otsu thresholding. The SRM algorithm, on the other hand, is able to re-construct the main structural components of the underground mine imagery by a simple but effective statistical analysis. The SRM method worked well on a variety of mine and tunnel frames tested as shown in Figures 13(b), 14 and 15. The detection accuracy of our approach is reliable with over 80% accuracy as shown in Tables 1 and 2. It can be seen from the results that the two regions (drivable and non-drivable) were most clearly distinguished with the SRM method. Furthermore, integrating the depth maps from the XBOX Kinect 3D sensors in the 3D visualisation representation also reveals the level of accuracy of the image classification as shown in Figures 14 and 15.
The major focus in this work is feature extraction and classification for front view drivable region detection in 2D by augmenting with 3D results. This would enhance autonomous robots' visual capability to identify drivable regions in underground environments. This research work is an advancement on an earlier conducted research [29] in terms of 3D visualisation with the aid of the 3D XBOX kinect sensor, usage of a better real life tunnel observations as well as benchmarking and comparison of features in existing detection systems.
The result of this work is a useful application that would accelerate further motion and path planning (control and mechanical decisions) for autonomous robot navigation in underground environments. However, the current classification can still be improved upon by utilising more machine learning algorithms and more sophisticated cameras, for example a laser scanner, for better performance and future adoption.
Footnotes
7. Acknowledgment
The authors gratefully acknowledge resources made available by UCT and UNISA, South Africa