
Abstract
Robots are expected to be operated in environments where they coexist with humans, such as shopping malls and offices. Both the safety and efficiency of a robot are necessary in such environments. To achieve this, pedestrian behaviour should be accurately predicted. However, the behaviour is uncertain and cannot be easily predicted. This paper proposes a probabilistic method of determining pedestrian trajectory based on an estimation of pedestrian behaviour patterns. The proposed method focuses on the specific behaviour of pedestrians around the robot. The proposed model classifies the behaviours of pedestrians into definite patterns. The behaviour patterns, distribution of the positions of the pedestrians, and the direction of each behaviour pattern are determined by learning through observation. The behaviour pattern of a pedestrian can be estimated correctly by a likelihood calculation. A robot decides to move with an emphasis on either safety or efficiency depending on the result of the pattern estimation. If the pedestrian trajectory follows a known behaviour pattern, the robot would move with an emphasis on efficiency because the pedestrian trajectory can be predicted. Otherwise, the robot would move with an emphasis on safety because the behaviour of the pedestrian cannot be predicted. Experimental results show that robots can move efficiently and safely when passing by a pedestrian by applying the proposed method.
1. Introduction
Robots are expected to be operated not only in factories, but also in environments where they coexist with humans, such as shopping malls and offices. The safety of robots that work in environments where humans exist needs to be guaranteed; that is, collision with pedestrians should be avoided. In order to avoid collision with pedestrians, robots need to control their velocity. However, keeping the velocity of the robot low reduces its efficiency. On the other hand, increasing the velocity of the robot reduces safety. This requires a trade-off between the efficiency and safety of the robot.
Predicting the trajectories of pedestrians is an effective method of solving this problem. If the trajectory could be predicted, robots would be able to perceive the probability of collision. By controlling its velocity according to the probability of collision, the robot can satisfy both safety and efficiency. Since the 1980s, many researchers have studied collision avoidance in dynamic environments [1–4]. In most of these studies, however, pedestrians were regarded as “moving obstacles”, and very simple predictions of the behaviours of pedestrians were conducted. The behaviours of pedestrians are affected by the existence of robots. Therefore, the behaviour of pedestrians in human-robot environments must be different from that in environments where no robots exist. An accurate prediction cannot be achieved without considering the behaviour of pedestrians in environments where robots exist.
Therefore, it is necessary to consider the behaviour of pedestrians in environments where robots exist to operate robots safely and efficiently. Pacchierotti et al. carried out an experimental survey of some optimal parameters such as the robot speed and passing distance between a robot and human [5]. Although the study is beneficial in certain circumstances, it cannot answer the question of how robots move in human-robot environments. A mathematical model that can be used to predict pedestrian behaviour is necessary. Mathematical models of pedestrians have been actively studied. There are roughly two types of pedestrian models. One is based on cellular automaton [6–8], and the other on social forces [9, 10]. Kirkland et al. used the social force model to simulate the influence of robots on crowd dynamics [11]. Their study showed the possibility that properly controlled robots could control human crowds. The social force model can simulate crowd behaviour, although the microscopic behaviours produced by the model are less human-like. Zanlungo et al. expanded the social force model by explicitly considering the prediction of collision in generating human-like behaviours [12]. Guy et al. expanded the concept of velocity obstacles for planning the motion of mobile robots [13] to modelling the collision avoidance behaviour of virtual humans [14, 15]. Ondřej et al. proposed a pedestrian behaviour model that considers the vision of the pedestrian [16]. Although these models can simulate human behaviour, they cannot appropriately predict human behaviour. This is because the models were not developed to predict human behaviour, but crowd simulation.
In the real world, pedestrian behaviours are essentially uncertain. To predict pedestrian behaviour, a pedestrian model that considers the uncertainty is required. Although there have been some studies on probabilistic pedestrian behaviour models [17–20], they focused on long-term prediction for planning the path of mobile robots and did not deal with the specific behaviour of pedestrians around the robots.
The objective of this study is to develop a probabilistic model that can predict the behaviour of a pedestrian in a human-robot environment. Our proposed model deals with the behaviour of a pedestrian around a robot. The model considers the behaviour of the pedestrian as probabilistic in order to cope with its uncertainty. In addition, the proposed strategy for generating the trajectory of the robot is given below. If the behaviours of pedestrians can be accurately predicted, a robot would be able to perceive the probability of collision. In that case, the robot may move with an emphasis on efficiency. However, if the behaviours of pedestrians cannot be predicted, the robot would not be able to perceive the probability of collision, therefore, the robot must move with an emphasis on safety. Robots can achieve both safety and efficiency using the proposed strategy.
In section 2, some parameters related to the behaviour patterns of pedestrians are defined and a model of the behaviour patterns is presented. Section 3 proposes a method for generating the trajectory of a robot based on the prediction of the behaviour of pedestrians. In section 4, experiments for learning the model parameters and verifying the proposed model are described and discussed. The paper is concluded in section 5.
2. Pedestrian Model
2.1 Behaviour Patterns
How do human pedestrians pass by each other on pavements? Individuals usually decide their trajectory based on the prediction of the position and velocity of the other person. If the prediction fails, they would get stuck and not be able to smoothly pass by each other. It is natural to consider an extra process in the prediction, namely, the prediction of the behaviour pattern. Here, we assume that the behaviour patterns of pedestrians express their intention and that there are a finite number of patterns of how a human passes by a robot. Based on these assumptions, we propose a pedestrian behaviour model of a situation in which a human and a robot pass by each other.
2.2 Modelling
The proposed model is described by M = (Q, S, O, A, B), where Q, S, O, A and B are respectively a set of behaviour patterns q; a set of positions s; a set of output directions o;a set of position output distributions aq (s); and a set of direction output distributions bq (s,o), respectively.
These terms are explained in detail below.
2.2.1 Behaviour Pattern
Behaviour pattern q describes the alternatives to select from in the bypass situation. The behaviours of pedestrians are classified into certain patterns according to the different ways of passing by a robot, such as “swerving to the left” and “walking straight without avoidance.” Here, we assume that pedestrian behaviours can be classified based on their position and travel direction relative to the robot.
2.2.2 Position
Pedestrian position s is the position of the pedestrian in the robot-centred coordinate system, which moves with the robot. In the rest of this paper, we basically consider the pedestrian position and velocity in the robot-centred coordinate system. Here, the y-axis is defined as the travel direction of the robot. A space is discretized into square cells. When the pedestrian position is determined as (xp, yp) by a sensor, s is described using the cells as follows:

where X α ≤ xp < Xα+1 and Y β ≤ yp < Yβ+1 (Fig. 1).
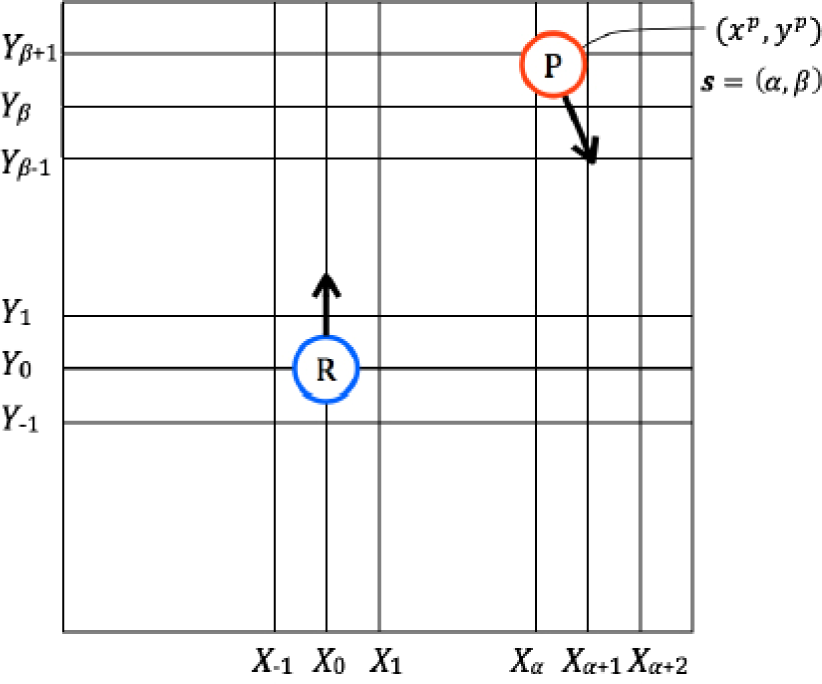
Discretized
2.2.3 Output Direction
The output direction o is the travel direction of a pedestrian relative to the robot. The direction is also discretized into a finite number of directions (Fig. 2). The definition of o is as follows:

where

Discretized output direction.
2.2.4 Position Output Distribution
The position of the pedestrian relative to the robot is an important factor in estimating pedestrian behaviour pattern, therefore, the set of position output distributions is defined as A = {aq(s)} · aq(s) is the distribution to the output s when the behaviour pattern is q · aq(s) satisfies the following conditions:


Figure 3 shows an example of the position output distribution. In this example, the pedestrian is often on the right side of the robot. The example corresponds to a single behaviour pattern, therefore, the number of distributions is equal to the number of behaviour patterns.

Example of position output distribution.
2.2.5 Direction Output Distribution
The pedestrian travel direction varies with the behaviour pattern. The direction output distribution is defined as B = {bq (s,o)} · bq (s,o) is the probabilistic distribution that outputs the direction o when the pedestrian is at position s in pattern q · bq (s,o)satisfies the following equation:

Figure 4 shows an example of direction output distribution. In this case, the pedestrian is likely to move toward the lower left. The distribution is defined for each cell of each behaviour pattern.

Example of direction output distribution.
2.3 Learning Model Parameters
Learning the model parameters consists of the following three steps:
Behaviour data collection by the robot. Classification of the collected data. Determination of the distributions of the position and direction outputs.
Pedestrian walking trajectories are collected from the moving robot. The collected trajectories are used for pattern classification and the determination of the distributions. For parameter learning, the input data

Here, q is a behaviour pattern; m is an ID of the collected trajectory, and τ is a time step.
The obtained trajectories are classified into a finite number of patterns. Here, the classification is manually performed.
For each behaviour pattern q, the position output distribution aq (s) is determined. The distribution is basically produced by determining the frequency of the existence of pedestrians in each cell. To compensate for insufficient learning data, the following calculations are performed for each cell. For each learning data

where


Here, s′ = (α′, β′) and S is a covariance matrix, which is a free parameter of the model. The calculations (Eqs. (6), (7) and (8)) are performed in each cell for each behaviour pattern.
The direction output distribution B ={bq (s,o)} is also determined for each behaviour pattern. The distribution is produced by a procedure similar to that of the position output distribution. First,


where g(θ,μ) is a wrapped normal distribution [24] and c is the number of directional partitions. These calculations are performed for each behaviour pattern.
3. Trajectory Generation of Robot
3.1 Strategy
Robots should satisfy the requirements of both safety and efficiency. In other words, if a robot can accurately predict pedestrian behaviours, they should move with an emphasis on efficiency (efficient mode), otherwise, they should give priority to safety (safe mode). If a pedestrian walks according to a modelled behaviour pattern, the robot would be able to predict the trajectory of the pedestrian. If the pedestrian does not follow any of the modelled behaviour patterns, or the behaviour pattern cannot be determined, it would be difficult for the robot to predict the trajectory. For example, the trajectory of somebody that does not perceive the robot, or of a tottering person, cannot be predicted, and such a person is very dangerous to the robot. Therefore, the robot must give priority to safety. In these cases, our strategy is for the robot to move as if the unpredictable person walks according to the behaviour pattern of the highest likelihood. This may enable the robot and the pedestrian to smoothly pass by each other.
3.2 Estimation of Pedestrian Behaviour Pattern
If the robot observes a pedestrian behaviour and obtains the trajectory data

Based on the above equation, the candidate pattern

If the likelihood ratios
3.3. Prediction of Pedestrian Trajectory
If the pedestrian behaviour pattern is identified, the robot would predict the walking trajectory of the pedestrian according to the direction output distribution of the identified pattern. Here, we assume that the pedestrian walking speed does not vary significantly during a short period, and therefore predict the future position of the pedestrian as follows;


where pt is the pedestrian position in the continuous coordinate system at timet, and pt corresponds to the cell s in the discretized space; Δt is the time interval; ô and
3.4. Velocity Control and Robot Trajectory Generation
As mentioned earlier, a robot decides on either the safe or efficient mode based on the estimation of the pedestrian behaviour pattern. That is, if the behaviour pattern is identified, the robot selects the efficient mode, otherwise, it selects the safe mode.
3.4.1. Efficient Mode
If the pedestrian behaviour pattern is identified, the robot can predict its future trajectory as mentioned in section 3.3.
In the efficient mode, we set the ellipse-shaped warning area (the lengths of the minor and major axes are a and b, respectively) around the future robot position t steps after the current situation. If the predicted pedestrian positionpt is within the warning area at time step t, a virtual repulsive force

The repulsive force acting on the robot in efficient mode.
3.4.2. Safe Mode
If the pedestrian behaviour pattern cannot be identified, the robot would select the safe mode. There are two situations in which the robot cannot identify the pedestrian behaviour pattern. One is when the pedestrian behaviour is similar to two or more patterns. Another is when the behaviour is not similar to any pattern. In both situations, the pedestrian may begin to follow a certain behaviour pattern at the next time step. In these situations, and for this study, the robot implicitly guides the pedestrian to follow the behaviour pattern of the highest likelihood at the present time. This may enable the robot and pedestrian to smoothly pass by each other because the learned behaviour patterns are the natural pedestrian trajectory for bypassing the robot.
In the safe mode, we set a larger ellipse-shaped warning area (the lengths of the minor and major axes are a′(> a) and b′(> b), respectively). If a pedestrian is in the warning area at the present time, the repulsive force in the vertical direction of the current predicted pedestrian trajectory would act on the robot, as shown in Fig. 6. The robot would move according to the resultant of the repulsive force

The repulsive force acting on the robot in safe mode.
4. Experiments
To verify the proposed model, three experiments were conducted. The first experiment was to determine the model parameters. The second one was to verify the methods of estimating pedestrian behaviour patterns and predicting pedestrian trajectories. The trajectory generation method was implemented on a robot and verified by the third experiment.
4.1 Experimental Setup
All the experiments were conducted in a hallway of width 5 m and length 12 m. To analyse the trajectories of the robot and pedestrians, two laser range finders (LRFs; UTM-30LX, Hokuyo Automatic) were installed at diagonally opposite corners of the experimental environment. The sensors were at a height of 60 mm. The detection of the robot and pedestrians was based on the algorithm of Zhao and Shibasaki [21], and the registration of the two range images was based on that of Okatani and Deguchi [22]. The omni-directional mobile robot ZEN of width 450 mm, length 450 mm and height 720 mm was used for the experiments. The robot was equipped with an LRF, which was the same as those installed in the environment.
The experimental environment was divided into 48 × 20 cells, each measuring 250 mm × 250 mm. The number of partitions for the pedestrian output direction c was 72. These parameters were determined by considering the balance between computational time and prediction accuracy. The time interval Δt was set at 100 ms for experiments 1 and 2, and 300 ms for experiment 3.
4.2 Experiment 1: Learning Model Parameters
The purpose of this experiment was the determination of pedestrian behaviour patterns and the model parameters. Eight healthy volunteers participated in the experiment.
4.2.1. Experimental Procedure
First, a participant and the robot stood at the middle of opposite ends of the hallway (Fig. 7). The participant then started walking toward the other end (the starting point of the robot). The robot simultaneously started moving in the opposite direction. In the experiment, 15 different robot velocities were tested. The different velocities were achieved by combining the following values of

The 15 velocities were contained in a single experimental set, and two sets were used for each participant. In each experimental set, the order of the velocities was randomly determined. As a result, a participant and the robot passed by each other 30 times.

The experimental environment for learning model parameters (experiment 1).
4.2.2. Results
By the observations of the experiments, six behaviour patterns were confirmed. The patterns were as follows:
Participants walked head on and swerved to the left side of the robot. Participants walked head on and swerved to the right side of the robot. Participants walked straight on the left side of the robot. Participants walked straight on the right side of the robot. Participants crossed in front of the robot from the right to the left. Participants crossed in front of the robot from the left to the right.
Figure 8 shows examples of the six observed trajectory patterns. In the figures, the trajectories were plotted in the robot-centred coordinate system. All the obtained trajectories were classified into the six patterns by the experimenter based on the relationship between the robot and the trajectories of the participants. Based on the results of this experiment, the position and direction output distributions were determined.

Observed pedestrian behaviour patterns.
4.3. Experiment 2: Estimation of Pedestrian Behaviour Pattern and Prediction of Pedestrian Trajectory
The purpose of this experiment was to verify the proposed method for estimating pedestrian behaviour pattern. Four healthy volunteers participated in the experiment.
4.3.1. Experimental Procedure
Unlike in experiment 1, there were three starting points of a participant and his goal point was anywhere at the opposite end of the hallway (Fig. 9). The participant was given instructions about his starting point and how to avoid the robot (by moving to the right or left) before each trial. The instructions prompted the six behaviour patterns of experiment 1 shown in Table 1. The participant and the robot started moving at the same time. In the experiment, three different robot velocities (
Experimental conditions and corresponding behaviour pattern.


Experimental environment for estimation of behaviour patterns (experiment 2).
4.3.2. Results
Figure 10 shows the variation in the rate of correct estimations. Here, correct estimation means that the determined candidate pattern was the same as the experimental one. The behaviour pattern was correctly estimated by 10 steps, or in 1.0 s, from the beginning of about 90% of the trials. When the participants started from S2, the time required for correct estimation was longer. In these patterns (A and B), it was difficult to judge whether the participant would swerve to the left or right until he began avoidance.
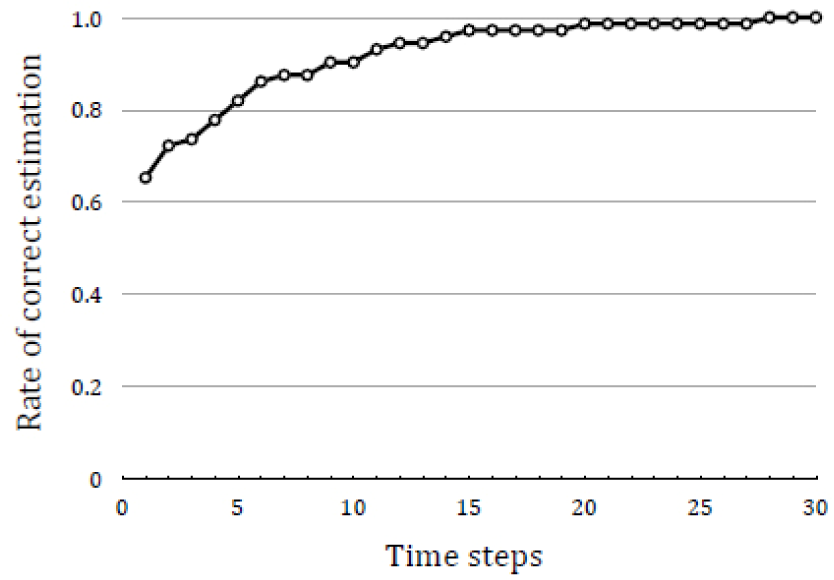
The variation in the rate of correct estimation with time.
To identify the behaviour pattern, a threshold value needed to be determined, as stated in Section 3.2. The value was determined to be 1.0 × 10³, which was higher than the maximum likelihood ratio when the candidate was not correct (3.4 × 10²).
Figure 11 shows the variation in the difference between the real and predicted participant positions. In the figure, three prediction timings (five, 10 and 15 steps from the beginning) are compared. When the participant trajectories were predicted at five steps from the beginning, the difference between the real and predicted positions increased with time and reached about 1.0 m at 60 steps from the beginning. On the other hand, when the predictions were made at 10 and 15 steps from the beginning, the differences did not exceed 400 mm until 60 steps from the beginning. This verified the effectiveness of the proposed trajectory prediction method based on estimating the pedestrian behaviour pattern. As shown in Fig. 10, the rate of correct pattern estimation was about 80% at five steps, and 90% and 97% at 10 and 15 steps, respectively. This correct pattern estimation resulted in accurate trajectory prediction.

The variation in the difference between real and predicted experimental participant positions with time.
4.4. Experiment 3: Robot Trajectory Generation
The purpose of this experiment was to verify the usefulness of the proposed model of pedestrian behaviour patterns and the trajectory generation method of the robot from the viewpoints of safety and efficiency. Five healthy volunteers participated in this experiment.
4.4.1. Experimental Procedure
To simulate a variety of situations in this experiment, the participant was given instructions about his starting point(S1, S2 or S3) and goal point(G1, G2 or G3), as shown in Fig. 12. The starting point of the robot was the middle of the bottom end (G2). The robot moved parallel to the wall, unless it had to control its velocity to avoid a participant.

Experimental environment for robot trajectory generation (experiment 3).
The participant and robot started moving at the same time. Two maximum speeds of the robot were used, 600 mm/s and 800 mm/s. The robot observed its surrounding environment using the installed LRF and determined the position of the participant by the method presented in [23]. Here, the LRF detected the waist of the participant, whereas the legs of the pedestrians were detected in [23]. a,b, a′ and b′, which are the lengths of the minor and major axes of the warning areas, were empirically set at 500, 2000, 1000 and 6000 mm, respectively. The magnitude of
To verify the usefulness of the proposed method, we compared it with the trajectory generation algorithm based on a simple prediction of the pedestrian trajectories. The simple prediction assumed that the pedestrians moved in a straight line at a constant speed after the moment of prediction.
Consequently, 36 trials (two algorithms × two maximum robot speeds × three starting points × three goal points) were conducted for each participant.
4.4.2. Results
Examples of the observed trajectories of the participants and the robot are shown in Figs. 13 and 14.
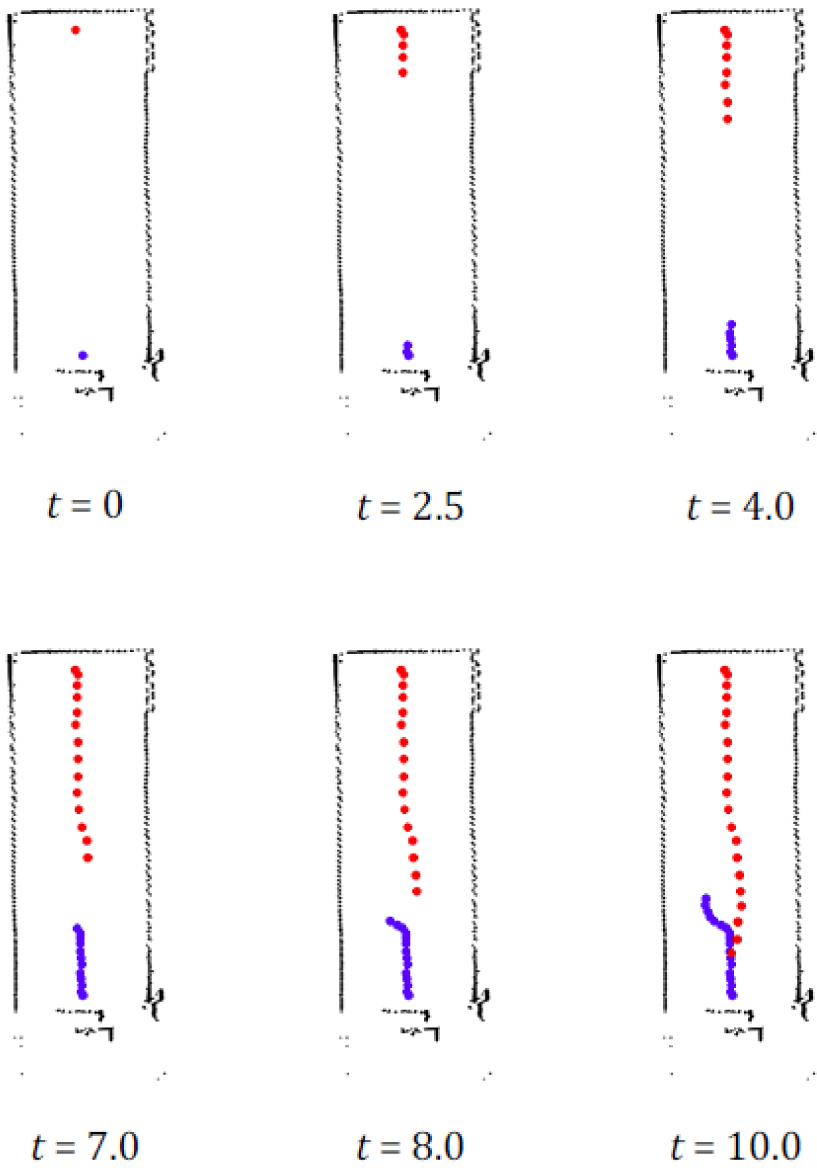
Examples of the observed trajectories of participant (red) and robot (blue). The robot moved in safe mode.

Examples of the observed trajectories of participant
As shown in Fig. 13, a participant did not avoid the robot until both were close to each other. Thus, the robot could not identify the participant behaviour pattern and selected the safe mode to avoid collision. The robot did not clash with the participant in any of the trials.
On the other hand, Fig. 14 shows a case in which the participant avoided the robot at an early stage of the trial. In this case, the robot could identify the participant behaviour pattern and selected the efficient mode. As a result, the robot moved in almost a straight line with little avoidance.
For quantitative evaluation, the lateral displacements of the robot and participants were analysed. Figure 15 and Table 2 show the average lateral displacement of the robot and participants. In the experiment, the lateral displacement was defined as the distance from the farthest point of the observed trajectory to the line segment between the starting and goal points.
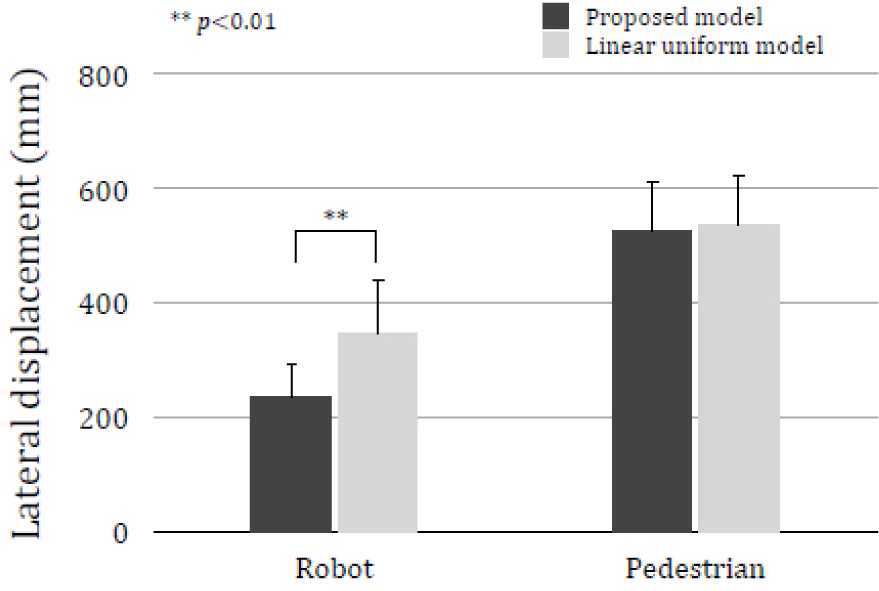
Lateral displacements of the robot and participants.
Mean and standard error of lateral displacements of the robot and participants (mm).

As shown here, the average robot displacement of the proposed model was shorter than that of the linear uniform model. The results were analysed by a paired t-test. According to the test, there was a significant difference between the two models (p < 0.01).
This means that a robot could efficiently move in a human-robot environment based on the proposed model.
However, if the participants had followed a longer path, the proposed model would not have been good. As shown in Fig. 15 and Table 2, the participant lateral displacements were virtually the same for the two methods. According to the paired t-test, the difference between the proposed model and the linear uniform model was not significant (p = 0.54). These results indicate that the robot using the proposed model did not cause the participants to follow a longer path than necessary. Moreover, in experiment 2, where we used a non-interacting robot, the average participant lateral displacement was 1215 mm (SD = 241.5 mm). This also shows that the robot using the proposed model can reduce the walking effort of the pedestrians.
These results show that the proposed model of pedestrian behaviour patterns and the trajectory generation method of the robot can be used to achieve both safety and efficiency.
5. Conclusion
In this paper, a model of pedestrian behaviour patterns was proposed. Based on the model, our robot estimates pedestrian behaviour patterns and predicts their trajectory. The robot selects either the efficient or the safe mode depending on its estimation of the pedestrian behaviour pattern, and generates its trajectory. Experimental results showed that robots could achieve a balance between safety and efficiency by applying the proposed method when passing by a pedestrian.
In this study, pedestrian behaviours were manually classified into six behaviour patterns, and the collision avoidance method only deals with the nearest person. In future work, the classification will be done automatically to deal with unknown behaviour patterns. We also plan to extend the proposed model to deal with multiple persons and other stationary and moving obstacles. In shopping malls, there are wandering and rushing pedestrians, people with handicapped movement, children, people in wheelchairs, etc.; to interact properly with all of them, the robot must take into consideration the distinct movements. A comparison of the proposed model with novel collision avoidance methods [3, 4] should also be undertaken. Finally, we will apply the method to operating the robot in the real world, for example, in shopping malls and offices.