
Abstract
A vibrotactile array is a promising human computer interface which could display graphical information to users in a tactile form. This paper presents the design and testing of an image contour display system with a vibrotactile array. The tactile image display system is attached to the back of the user. It converts visual graphics into 2D tactile images and allows subjects to feel the contours of objects through vibration stimulus. The system consists of a USB camera, 48 (6×8) vibrating motors and an embedded control system. The image is captured by the camera and the 2D contour is extracted and transformed into vibrotactile stimuli using a temporal-spatial dynamic coding method. Preliminary experiments were carried out and the optimal parameters of the vibrating time and duration were explored. To evaluate the feasibility and robustness of this vibration mode, letters were also tactilely displayed and the recognition rate about the alphabet letter display was investigated. It was shown that under the condition of no pre-training for the subjects, the recognition rate was 82%. Such a recognition rate is higher than that of the scanning mode (47.5%) and the improved handwriting mode (76.8%). The results indicated that the proposed method was efficient in conveying the contour information to the visually impaired by means of vibrations.
1. Introduction
Tactile displays constitute cutting-edge technology in human-computer interface. It provides an artificial sense of touch, as though users have contact with a real environment. Moreover, it initiates an exclusive interpersonal communication and information transferring channel. Common methods of tactile inputs can be classified into vibrotactile, electrotactile, pneumatic tactile devices according to the actuation method. A vibrating display device can be easily constructed by arranging vibration actuators into an array form and delivering information to the user by changing the vibration parameters, such as location, frequency, amplitude, waveform and duration. It is useful in areas where normal visual/auditory channels are saturated or obstructed. In particular, the vibrotactile display device can present graphic information to people with visual disabilities. The goal of this paper is to develop a small tactile display system and provide an automatic and intuitive method for 2D contour representation.
1.1 Related Work
Vibrotactile interface design is an area that attracts growing interests in the research community. Various research groups have developed laboratory prototypes to find new possibilities for utilizing vibrotactile cues. There are several devices which are composed of a 2D array of vibrotactile or low-frequency displacement actuators applied to the skin on the back, the forehead, the thigh, the abdomen or the fingers. The size of the array has varied from 3×3 to around 64 ×64 elements [1]. Early in the 1970s, Carter Compton Collins proposed a tactile television system which permitted blind subjects to determine the position, size and orientation of a visible object with 20×20 a tactile stimulator array [2]. The commercially available optical-to-tactile converter converts the lines of printed letters captured by a small camera into vibrotactile outlines on the user's finger pad. In the 1990s, an innovative prototype was created to present a large pictorial image to the somatosensory system through vibrotactile pin arrays [3]. The system consists of a small display, a mouse and an array of pin vibrotactors. The pin array is mounted on the mouse. When the display cursor crosses a line or an image segment when the user moves the mouse, the user receives feedback on the spatial structure and orientation of the image through the tactile vibrations. Tan et al. developed a haptic back display using a 3×3 tactor array. Sequenced pulsed tapping on a person's back was employed to impart the directional information [4]. Oron-Gilad et al. studied the vibrotactile cues for robust position guidance [5]. They attached tactors on the hand and vibrotactile stimulation was displayed in order to represent the spatial deviation from a desired position. Dongseok Ryu et al. proposed combining the position tracking device with vibrotactile stimulus so as to construct a bilateral haptic interface [6]. Recently, in the University of Southern California, a wearable vibrotactile system was designed for assisting the visually impaired in performing routine tasks [7]. Similarly, a 2D vibration array called ‘Tyflos’ was designed for the visually impaired to sense the distances of obstacles [8]. The 6 DOF haptic device could provide a spatial sensation on the handle using a vibrotactile display. Mee Young Sung et al. presented a haptic audio visual system (HAVS) [9]. The system could present the image and sound in the form of haptic rendering. The image signal was automatically transformed into tactile stimulus. Meanwhile, the sound stream was analysed and encoded into vibrotactile stimuli. More and more reports on vibrotactile display systems have shown their potential application in various domains, including information display, rehabilitation applications, gaming and entertainment in virtual environments [10–14].
1.2 Problems of a Tactile Graph Representation
A rudimentary question regarding information conveyance in tactile form is: how complex can a tactile composition be? Is the human haptic system capable of resolving and understanding the potentially complex, rapidly varying temporal and spatial patterns presented to the skin? If some simple spatial information (e.g., direction, distance and Braille) or alarming information is to be conveyed into vibrotactile form, it is feasible to adopt simple vibration coding modalities with location, rhythm and intensity. Such successful examples can be found in navigation guide chairs, mobile phones and safety driven alarming systems [15]. Most of these tactual communication systems are based on two major principles: pictorial or frequency-to-place transformation. Devices for the blind tend to adopt the pictorial approach – i.e., the direct translation of spatial-temporal visual information to the skin. Thus, direction and alarm can be represented by the spatial stimulation patterns of tactile stimulator arrays. As for representing the letters of the alphabet, Geldard developed a tactile language called “Vibratese” [16]. Vibratese was composed of 45 basic elements. Letters are represented by a unique combination of 5 vibration spots with variable duration, intensity and location. The experimental results indicated that it was read at a rate which was twice as fast as Morse code. Similar work referring to letter coding with tactile stimulus can also be found in [17]. However, too complex spatial or “non-spatial” information, including graph and hieroglyphics, such as Chinese characters, small scale vibrotactile arrays with spatial coding patterns perform poorly in terms of the recognition rate and cognitive load.
One of the challenges is that existing vibration stimulus arrays have relatively low space resolution. Thus, there is still great interest in developing new actuators and designing strategies for building displays that allow for a more efficient implementation in terms of cost and performance [18]. The next problem is the lower bandwidth capability of human tactile sensitivity to cutaneous signals. Sighted people can distinguish two small, closely positioned dots through their visual sense, while it is far more difficult to distinguish them through their haptic sense. The last problem that arises in tactile graph presentation is where the coding rules are too complex or the mapping between the vibration stimulation parameters and the information are not well-defined percepts, additional attention and pre-trainings will be needed. Even for Braille, the most successful tactile communication method, years of training are still required for it to be mastered.
Generally, it is reported that human touch senses are poor at determining absolute quantities but very sensitive to changes [19]. Another finding is that human tactile perception and memory are significantly affected by the tactile cues which vary spatially and temporally [20]. Based on these two considerations, we design a portable tactile image creation system and propose a dynamic tactile coding scheme. We try to create a continuous and intuitive contour scanning method which is valid for a 2D contour display.
The rest of this paper is organized as follows. Section 2 describes the hardware implementation of the system. Then, Section 3 describes the implementation of a visual-to-tactile conversion and the online dynamic coding pattern. After that, Section 4 presents the psychophysical experimental setup for vibration parameter evaluation and performance comparison. Finally, Section 5 draws some conclusions and provides a discussion of future work.
2. Hardware Implementation
The proposed system is configured and shown in Figure 1, where it consists of a USB camera, a main controller board and 6×8 vibrotactile motors. Figure 2 shows a snapshot of the main controller board. The main controller board is based on a microcontroller in which a real-time operating system is embedded, and performs image acquisition, processing and tactor driving. Multichannel pulse-width modulation (PWM) signals are generated to modulate the intensity of tactors. It amplifies the input signal and activates the vibrators with an optical couple and triode.
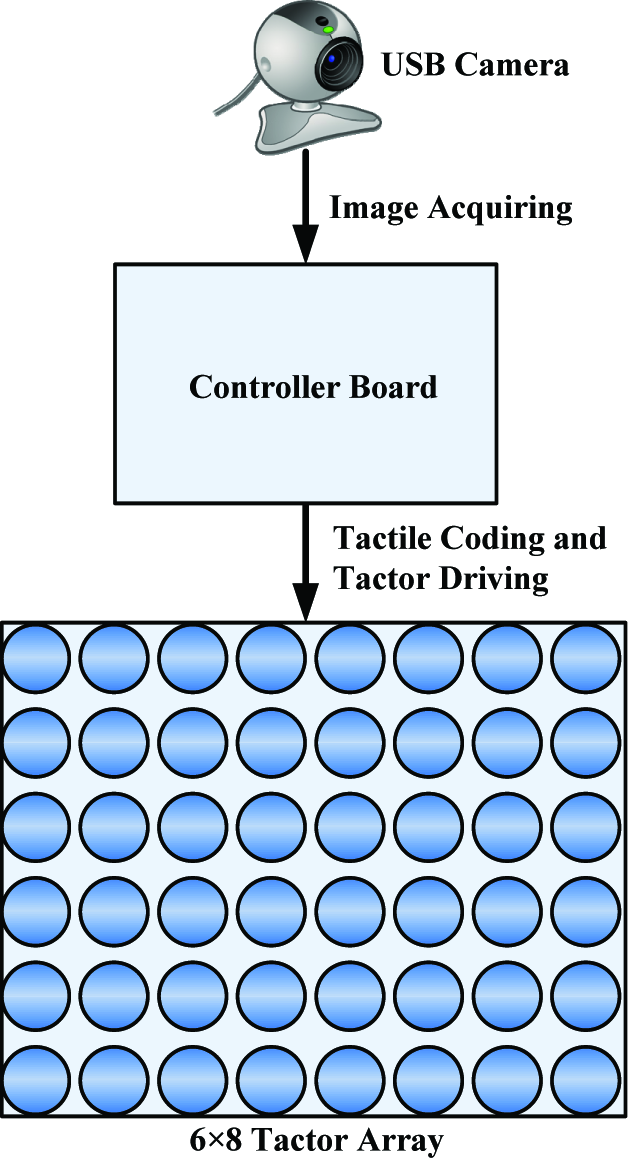
The architecture of the hardware system.

Photo of the controller board.
The tactile actuators employed in this prototype are coin-type tactors with a compact size and a diameter of 9mm×3.5mm. The weight is 17g. Compared with other common eccentric mass motors, it could oscillate perpendicular to the skin, while the surrounding skin area is shielded with a passive housing. It is burst within the range of 200–300Hz, which coincides with the peak sensitivity of the Pacinian corpuscle. The prototype of the vibrotactile vest is shown in Figure 3.

Photo of the vibrotactile vest.
3. Software Architecture
Converting an image into vibrating stimuli involves three steps. The first step is image processing. The task in this step is to extract the 2D contour of an object and reduce the resolution of image to fit the low resolution of the tactor array. Next, the tactor array is tailored into a linked list in which the tactors corresponding with the contour are lined up. In the third step, the tactors are activated in sequence and the contour of the object is tactilely displayed.
3.1 Contour Extraction
Real images are typically comprised of a broad and unpredictable mixture of shapes, colours, intensities and other real-world complexities. For a tactile graphical display to be comprehensible, it must not contain too much information. Previous studies have suggested that a tactile graphic should be tactually clear and contain only relevant information. Clutter or an overabundance of detail in a tactile image can detract from its usability and hamper the ability of the user to understand its content [21]. Accordingly, we assume that the contents of the image are objects with a clean background and that they do not cross each other. Since we are concerned with neither moving images nor geometric transformations, we do not consider frame or geometric processes. The image sampling frequency is set as 1fps, which is approximate to the refresh of the vibration stimulus.
The main operation in image processing is contour extraction. This process includes edge detection, binarization and edge connection. There are many algorithms that can fulfil such a process. Due to the limitation of the hardware, simplified algorithms are preferred so as to reduce the computational complexity. An edge detection algorithm attempts to locate and highlighted edges in an image. These edges are parts of an image where there is a rapid change in intensity. The faster such a transition is made from light to dark – or vice versa – the more likely an edge detection algorithm is to consider the centre of such a transition as an edge. Each pixel that is found to be part of an edge is set as white, while non-edge pixels can be assigned as black using some threshold functions. A common Sobel edge detector was adopted in this study. In addition, and in order to get the threshold of image processing, Otsu's method was used to automatically perform histogram shape-based image thresholding. The details of the algorithm can be found in [22]. The image was turned into a binary image by this algorithm. After these processes, the image usually receives very wide edges, which makes it difficult to determine the tactors involved in the contour. Here, the HSCP algorithm proposed by Holt was adopted to refine the edge boundary. Afterwards, the boundary was tailored into a line of 1 pixel width.
In general, if a picture is intended to be displayed without losing important information, a common solution is to design a vibrator array that has the same size as the resolution of the image. In practice, this is not reasonable due to the hardware limitations and human physical limits. The average maximum width of a man's back is around 40cm. The diameter of each vibrator in our system is almost 1cm. The reported two-point discrimination threshold on the back is 3.9 cm – therefore tactors cannot be too close to each other [23]. Considering the threshold distance and the dimension of the tactors, an array of 6×8 tactors is deployed. The tactor vest is attached on the lumbar region.
The fidelity of visual-to-tactile conversion relies upon the human's tactile perception, the physiological capabilities of the human in exploring and discerning via the sense of touch. Compared with the perception of visual stimuli – which is an optical signal varied with space – human's perception of tactile stimuli varies with space and are not so acute [24]. Therefore, the spatial mapping from vision to a tactile array is not valid. Recent evidence indicates that a mechanical stimulus applied to the skin is temporally and spatially processed by the human touch sensory channel. This processing can be considered as spatiotemporal filtering [25]. Both spatial and temporal sensory cues are essential for tactile discrimination tasks [26]. Based on these studies, we suggested an alternative visual to tactile coding scheme – which is a spatiotemporal variable vibration pattern – to compensate the insensitivity to spatial cues in the tactile perception channel. We define a linked list of tactors and trigger them in order. The goal of the algorithm is to trace the points on the contour successively without omission or repetition. Moreover, the tactors will be activated following the consecutive boundary of an object. An example which describes the mapping process from visual image to vibrating array is given in Figure 4.

Tactile coding for the image (a) The image is captured by a camera. (b) The contour of the object (c) A temporal-spatial list is automatically created for tactor activation. The larger point represents the vertex and the intensity of the corresponding tactor is set to level 2; the smaller one will be set to level 1. The arrows indicate the sequence of tactors to be activated.
The preliminary work is to map the pixel space into the vibrotactile array without distortion. Since the pixel array is 320×240; however, the tactor array M is much smaller (here M is 8×6) and a high-to-low resolution algorithm is needed. The pyramidal re-sampling algorithm in [7] is used for array mapping. Following this rule, a 6×8 resolution array can be achieved. We define the array: M={m(i,j)/∈[1,W]×[1,H]}, where i and j are the coordinates of the element in the array (assume element m(1,1) being in the top left corner). Here, W=6 and H=8. The value of each element m (i,j) is 1 or 0, if the point is on the edge of object, m(i,j)=1, otherwise m(i,j)=0.
3.2 Contour Following Algorithm
Before illustrating the contour-following algorithm, several notations used in this paper are introduced.


8 Neighborhood and the chain code.
Using this algorithm, the tactor array M will be tailored into a circular list. The nodes of the list are the positions of those tactors which participated in the vibration. The nodes are indexed along the contour of the object. Once the list is created, the tactors can be activated from the upper left hand corner. Even if the contour of the object is not closed, the elements corresponding to the contour could still be traversed clockwise. The algorithm is implemented as in flow chart in Figure 6.

The contour following algorithm for the vibration array.
To illustrate how the linked list is generated, the image sample in Figure 4 was processed through the following steps.
The image was captured by the USB camera shown in Figure 5(a). The contour of the cell phone just as in Figure 4 (b) was acquired with the image processing algorithm mentioned before.
A high-to-low resolution algorithm reduces the resolution of the binary image into a lower resolution, keeping the necessary information of the edge. The tactor array M (6×8) was marked as the binary array. The elements in array M are shown in Figure 7(a).
The tactile array M for the image in Fig. 4 is traversed based on the 8-neighbour rules. The elements of M are checked in the sequence of (a) to (d). The grey parts are the 8 neighbours of the element. “1” represents an element in the contour.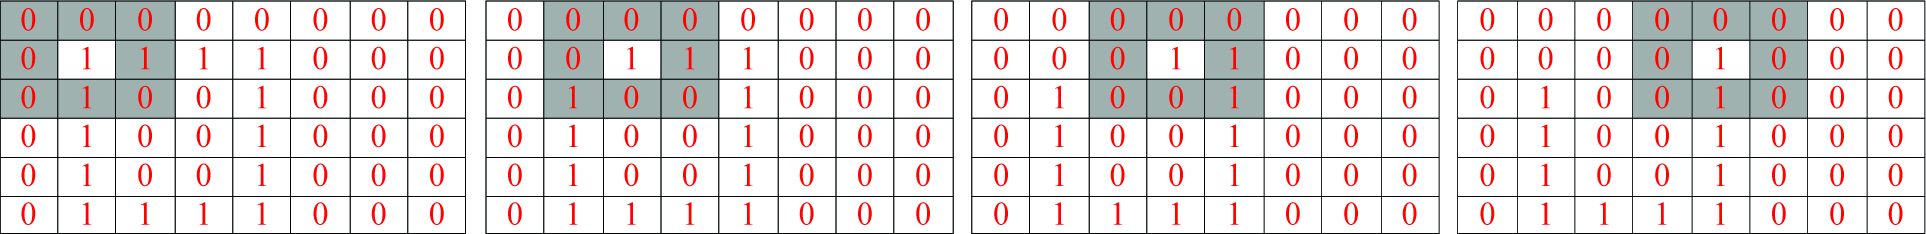
The binary array is tailored into a linked list. The first non-zero element was detected in the order of left to right, top to bottom. The head of the linked list is the element of M(2,2). It is defined as the vertex of the image. The 8-neighbourhood of M(2,2) is the grey part in Figure 7 (a). Then, the 8-neighbourhood of M(2,2) is traversed clockwise. The first non-zero element is M(2,3). The angle between M(2,2) and M(2,3) is the direction 0. M(2,3) is added to the rear of the linked list. Meanwhile, the elements which are in the list are removed from the array, and marked as 0. Therefore, M(2,2) is turned into 0. The binary array is updated as with Figure 7(b) and the neighbourhood of M(2,3) is traversed following the direction 0. M(2,4) is appended in the list and the neighbour of M(2,4) is travelled (shown in Figure 7(c)). Up to the element of M(2,5) – since the non-zero element is in direction 2 – the element M(2,5) in Figure 7 (d) was marked as the vertex of the image.
Based on this method, all the non-zero elements in the array were queued up in the list. The element corresponding to the edge of the image was lined in the linked list and the vertex was marked. Figure 8 shows part of the linked list for the image in Figure 4. The list includes two parts, the label and the attributes (v means vertex).

Part of the linked list for the image in Fig.4. It corresponds with the processes in Fig. 7 (a) to (d).
3.3 Tactors' Vibration Pattern
The spatial-temporal parameters we considered are intensity, duration, time interval and location. Under the contour tracing algorithm, the tactors in the contour are lined into the list and actuated sequentially. The next step is to establish the vibration pattern. In this paper, the time interval is the time between the onset of the first and the onset of the second stimuli. The intensity of the corresponding tactor is different from those of the other tactors. The vibration intensity is set at two levels: Level 2 means the average driven voltage is 3V, while level 1 corresponds to 1V. The intensity of the tactor at the vertex is set as level 2. We define that all the tactors involved in the vibration have the same vibration parameters. The sequence of tactors to be activated is illustrated in Figure 9.
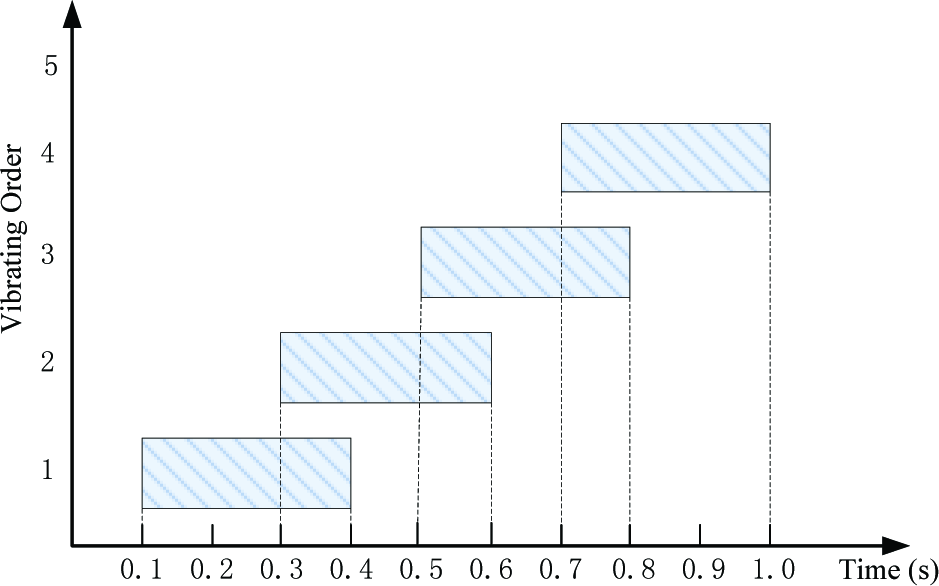
Visual representations of the vibrotactile temporal patterns. The tactors on the contour are numbered and activated in sequence.
4. Algorithm Implementation and Experiments
As the tactors are actuated in sequence, the vibration duration and the time interval should be primarily confirmed. Although previous studies have contributed to these settings, the solutions were concentrated on a specific vibration actuator and its position on the body. To generate a continuous and consistent illusion of the contour, the vibration parameters were estimated through a psychophysical experiment. Based on these set of vibration parameters, the tactile representation of the letters and experiments were also performed.
4.1 Tactile Image Display and Parameter Estimation
A psychophysical experiment was performed to estimate the parameters of vibration stimuli and evaluate the effect of the prototype system. We want to test the ability of the subjects to recognize different shapes on the prototype of the 6×8 vibration array. Furthermore, we want to get optimal parameters for vibration, duration and time interval so as to produce the “best contour,” which is defined as “the most consistent with the real shape.”
In the experiment, the stimulus duration and time interval were set to 8 levels (they were 0.2s/0.1s, 0.2s/0.2s, 0.2s/0.3s, 0.2s/0.4s, 0.3s/0.2s, 0.3s/0.3s, 0.3s/0.4s, 0.3s/0.5 respectively). Four objects with different shapes were presented in front of the camera. They are: triangle, circle, square, and rectangle. The vibration display modules for them are shown in Figure 10. The vibration stimuli were activated for the user through the vibrotactile vest.

Four different shapes are presented in the experiment. The red dots indicate the vertex with higher vibration intensity; the number implies the order of the tactors to be actuated.
10 sighted students (8 males, 2 females) participated in the test. They were all undergraduate students of Southeast University. None of them had experience of vibrotactile display devices. In the test, the subjects were instructed to wear headphones so as to eliminate any acoustical cues or distractions. The subjects were required to match what they felt tactually with one of these shapes. They had no time restriction in providing their answers and, upon request, they could have the object refreshed. The trials were delivered in a fully random order to prevent practice and fatigue effects.
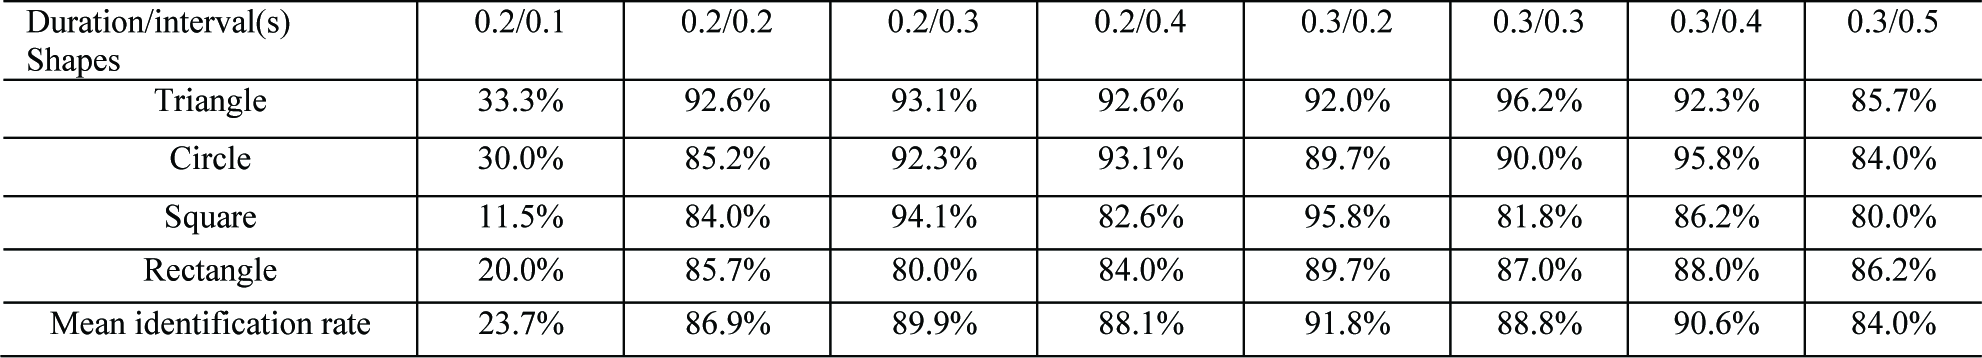
The recognition rates of the four shapes with different time parameters are shown in Table 1. The table shows that the mean identification rate is 91.8%, which is achieved when the stimulus duration and interval is 0.3s/0.2s. The worst recognition rate is 23.7%, when the duration and interval is 0.2s/0.1s. It suggested that the stimulus duration and interval should be carefully selected. Too short a vibration duration and interval will result in the subjects not having enough time to respond. In contrast, too long a time interval might cause a sense of discontinuity, which causes the worst recognition. Compared with the results of Tan in [27], the optimal time parameter was 0.5s/0.5s, the optimal stimulus duration and interval in this work is 0.3s/0.2s.
Recognition rate with different shapes and vibration time parameters.
Two-way repeated ANOVA was performed to analyse the significant effects of the results. It was observed that duration/interval is the main factor, where F(7,288)=42.62, p<0.001. It also reveals that shapes have no major effect on the judgments of the subjects: F(3,288)=1.83, p=0.142. There was no significant interaction effect between duration/interval and the shapes on the identification: F(21,288)=0.65, p=0.883.
In this algorithm, the vibration intensity of the vertex is higher than other points. We also investigated the effect of enhanced intensity on the vertex. The recognition rate with and without the vertex are shown in Figure 11. It was found that without the hint of a vertex, the identification rates were below 30%. In contract, the average recognition rates for tactile contour displays with vertex cues were above 77.1%. It is suggested that the vertex points prompted the recognition of the shapes.

Recognition rate for four shapes with and without a vertex.
In particular, this study only considered the parameters of time interval and duration regardless of such vibration parameters like vibration intensity and waveform. This was because our previous research found that humans could not differentiate intensity changes. The existing research also found that subjects are not sensitive to the waveform.
4.2 Vibrotactile Letter Display
Letters are common objects which are displayed in vibrotactile systems. In order to evaluate the effect of dynamic vibrotactile patterns proposed in this paper in detail, we compared a letters display from the methods in this paper with two other typical continuous vibration modes [28][29]. One vibration pattern is an improved handwriting pattern. Under this mode, the actuation order is just the same as with hand writing. The distinguished improvement is that there is an overlapping vibrating duration time between the joint motors. These attributes are quite similar to our mode. The duration and time interval are both 0.3s/0.2s. The other vibration pattern is the scanning mode, which triggers the motors in the lines in the order from top to bottom. These three vibration patterns for letter display are depicted in Figure 12.

Three vibration patterns for 10 different letters (a) scanning mode (b) handwriting mode (c) our tracing mode. The numbers in the circle represent the vibrating sequence. The red mark in (c) represents the vertex points whose vibration intensities are higher than the others. The circles in (b) represent that two neighbour tactors are vibrating simultaneously.
We examined the performance of these vibration patterns using three parameters. The parameters were the identification rate, the refresh time and the cognitive load. The recognition rate is the average result for 10 letters. The refresh time means the average time spent on one letter's display. The time spent in image processing is excluded. As the subjects had no time limits for letter perception, they could therefore repeat several times until they made a decision. The cognitive load is the average repeated time for the subject to conduct the letter's identification. It should be mentioned that for all the coding patterns, the hardware was the same tactor array with 8×6 actuators. The difference raised from the diversity of the hardware was excluded. The letters were displayed on the full screen and with the same size.
15 graduate students aged between 25 and 30 years joined the experiments. In the experiment, the subjects were asked to identify the characters according to the tactile stimuli presented on the tactile vest. 10 letters were tested. Before the experiments were performed, the subjects had been instructed on the procedure of the experiment and learnt to input the recognition result on the user interface. The experiments were repeated 8 times. Three vibration modes were presented randomly. The identification rates for 10 letters are shown in Figure 13. The evaluation parameters are estimated and shown in Table 2. It revealed that our vibration pattern has a better identification rate. Our method gives a similar performance to the improved handwriting in terms of those evaluation parameters. This is easy to explain because these two patterns are – coincidently – similar in spatial and temporal arrangement. The salient difference is that our mode is automatically programmed following the rule of linked list and the handwriting modes are given according to writing habit. The attributes of the vertex points makes the letter easier to be distinguished. With respect to the cognition load, the proposed pattern is positioned in the middle and is easy to be accepted by the subjects.
Evaluation results of the three vibration modes.


Recognition rate for 10 letters under three vibration modes.
The experimental results were analysed with repeated two-factor ANOVA. The vibration modes and characters were regarded as factors which might affect the experimental results. It was found that the effect of the vibration mode was significant (F(2,210)=35.72, p<0.01). The effect of the character was also significant (F(9,210)=6.42, p<0.01). The interaction of these two factors also affected the results (F(18,210)=1.69, p=0.04). These indicate that there is a distinguished difference between the vibration modes.
The experiments of the letter display show that the proposed vibration mode was effective. Compared with the pattern in [28] (Figure 12 b), it was found that even the pairs of tactors did not vibrate simultaneously. The subjects could still feel continuous vibration by turning the combination of vibrating duration and interval (duration/interval= 0.3s/0.2s). It can also produce a natural feeling, as if writing a character with the fingertip. Another finding was that although our vibration pattern was not specially designed for letter display, some letters' representation order (letter “D”) was coincidently similar with the handwriting mode in Figure 12b. This explains the reason for the higher recognition rates. Moreover, the unique definition of the vertex provides the cue for spatial location, which contributes to distinguished contour recognition. Instead of the application limits in number and the alphabet, our continuous vibration pattern has more universal application. It can be adopted for a more comprehensive 2D contour display.
In the study, we also tried placing the object in different positions (such as the upper left, the lower left or the upper right corner). Objects with different shapes were also placed upside down. In all these cases, the identification rate had no distinguished difference. The subjects also reflected the fact that sometimes they had difficulty in distinguishing rectangles from squares. A possible explanation for this misidentification is the similar length of each side. The tactile acuity of the variety of length is not as obvious as that in vision. Although the cues like the vertex and the number of vertexes can be utilized in identification, miscounts may occasionally occur. These pose a further issue: factors like length, relative spatial position, the continuity and direction of the side all contribute to a shape's identification with touch. Before transforming the visual image into a tactile graph and conveying the spatial information to the user with the vibrotactile display, it is necessary to investigate the effect of variable vibration stimuli on spatial cognition. Such research will benefit the vibration patterns with less complexity and a higher identification rate.
5. Conclusions
This paper presents the implementation of a novel vibrotactile system with image acquisition and a tactile display function. The system includes a USB camera, a main controller board and an array of vibrotactile actuators. It could gather visual inputs, extract the contour and subsequently generate a space-time vibration stimulus automatically. The tactors could be activated in sequence according to the contour of an object. The experiments were conducted to investigate the effectiveness of the proposed tactile image display. The experimental results preliminarily prove that the portable vibrotactile system is feasible for non-visual image display.
Due to the limits of vibration motors, the proposed vibrotactile device implements only a few shapes. To further improve the performance of the vibrotactile system, we intend to improve the tactor array with increased size and vibration intensity. We will focus on rendering complicated scenery with irregular shapes. Future work can be carried out in two respects. One is to use image enhancement and segmentation methods in the stage of image processing, so as to split the overlapped objects in advance and simplify the contour to be rendered. The other is to optimize the temporal-spatial tactile coding in light of the human tactile perception mechanism. Specifically, tactile illusions, the disparity between perception and physical reality – like sensory saltation and the funnel effect – can be exploited to compensate for the limited spatial resolution of the vibration array.
Footnotes
6. Acknowledgments
The research reported in this paper was carried out at the Robotic Sensor and Control Lab, School of Instrument Science and Engineering, Southeast University, Nanjing, Jiangsu, China.
This research was supported in part by the Natural Science Foundation of China under Grants 60905045 and 61105075, the Natural Science Foundation of Jiangsu Province under Grant BK2009103, and the Programme for New Century Excellent Talents in University under Grant NCET-10–0330.