
Abstract
There are many different sets of project success criteria, but none of them will be suitable for all of the different stakeholders involved in the construction industry. In this sense, the developer who finances any construction work has been considered as the main person in any construction project. Different people perceive things differently and therefore, from the developers' perspective, this paper seeks to achieve the followings: (1) review of the current literature on building success criteria and (2) develop an empirical framework for measuring the success of a building project in Malaysia. A total of 120 quantitative responses were distributed to different sizes and types of building project developers. 59 complete responses were retrieved. By employing Principal Component Analysis (PCA) through the Statistical Package for the Social Science (SPSS) software, the building project success criteria were reduced to five dimensions: Company Success; Profitability Success; Primary Product Success; Secondary Product Success and Branding Success. The implication of this framework is twofold: first it captures the developer's view on success criteria and second, it forms the foundation to measure success, thereby enhancing successful delivery of a project by prioritizing limited resources on the criteria related factors.
1. Introduction
A criterion can be defined as a principle or standard by which something may be judged or decided [1]. Moreover success criteria should be observable and measureable. It is worth noting that success criteria differ from success factors in the sense that success criteria are the variables used to measure success, whilst success factors are efforts to reach pre-determined objectives. The success factors were beyond the scope of this paper.
Time, cost and quality have long been perceived as the main criteria to evaluate the performance and success of construction projects [2]. These criteria have been named “The Iron Triangle” [3]. Despite the fact that the Iron Triangle has been frequently employed to measure success, these criteria of project success turned out to be far more abstruse and there are more competing criteria that can be identified [3]. There were different criteria from different stakeholders' perspectives and perceptions within the industry. A project that may seem successful to the client may be a completely unsuccessful venture for contractors or end users [4]. In this sense, it is not surprising that different stakeholders perceived success criteria differently in analysing the performance of their respective project [5]. The one-of-a-kind character of construction projects further exacerbated the analysing process.
The topic of project success has been discussed for many years, but no single set of criteria will ever be totally comprehensive when it comes to defining the success of a project [6]. Consequently a number of researchers have proposed different sets of success criteria such as those found in Table 1. Moreover, research was done to explore the differences between the client and contractor perspectives on a project's success criteria [7]. In the meantime, project success should be viewed from the different perspectives of the individual owner, the developer, the contractor and user, the general public and so on [8].
Project success criteria retrieved from current literature

Early work suggested that time, budget and quality were the main criteria in evaluating project success and this can be traced back to as early as 1971 [9]. These project success criteria may not have change much, but have required updating from time to time. The rationale of this paper was inevitably built on the basis that developers serve as the main person because of their work in financing and initiating the implementation of a construction project. As such, the emphasis of this paper was placed upon bridging the research gap by providing an answer to the following question: (1) how do developers evaluate project success? This was reinforced by Waterbridge [10] who stated that it was impossible to implement a universal framework of project success suitable for all projects - the success criteria will be different between every project depending on the specifications of the projects. In addition, the criteria were not appropriate for continuous improvement because they are ineffective at identifying the causes of productivity and quality losses [11]. To the knowledge of the authors, although the idea of this paper might not totally new, this paper serves as the first attempt to examine the perceived project success criteria from the developers' perspective within the Malaysian construction industry. The limitations were presented in order to further enhance the originality of this paper. Lastly, future research directions were also suggested.
2. Literature Review
Success criteria are the measures by which the success or failure of a project will be judged [12]. Within the context of project management, project success is traditionally measured based on time, cost and quality [13]. Cookie-Davies [11] offered a distinction between project success, which is measured against the overall objectives of the project, and project management success, which is measured against the widespread and traditional measures of performance against cost, time and quality.
Apparently, finishing a project on time, within cost and of good quality, as shown in Figure 1, has been dominating the project success criteria domain.

Iron Triangle
Similar to project success, project success criteria are also hardly agreed upon in current literature. The measure of project success can no longer be restricted to the traditional indicators which include time, cost and quality [14]. This further justified the necessity to review current literature for new project success criteria. One study suggested that time and budget are the only important criteria by which to measure project success [15]. A construction project was subjected to project resource constraints, while meeting these constraints, time and cost were the primary consideration for the project, not quality [16].
Once the argument begins to rot, it seems to have no end. In fact, there are as yet no universally accepted frameworks for assessing project success [17]. As different people assess project success in different ways, at different times, in different situations, from the perspective of different stakeholders, project teams or individuals, different success criteria for projects are inevitable [18]. Because many studies were conducted on project success criteria ([3, 6], [7, 8], [15, 19] and [20]) this section presented a summary of the comprehensive literature review. A thorough and critical review of existing literature on project success criteria identified 20 criteria as shown in Table 1. The criteria form the backbone of the quantitative instrument, which will be discussed in detail in the next section.
3. Research Methodology
The paper adopts a quantitative approach. The questionnaire was pre-tested for comprehensibility by consulting an experienced project manager and an academic. A number of changes were suggested and implemented prior to distribution. The targeted respondents were those professionals who are currently working in developer firms. The respondents were invited to rate each project success factors and success criteria on a five-point Likert scale of 1 (very unimportant) to 5 (very important). The reliability of the questionnaire was assessed using Cronbach's alpha coefficient. Then Principal Component Analysis (PCA) was conducted to reduce the dimension of the project success criteria.
As this paper an exploratory analysis was undertaken, PCA was employed to reduce the dimensionality of criteria by explaining the variance-covariance structure between variables. From the current literature, PCA was employed in the research area like project management competencies [20] and future building success criteria [19]. This paper adapted the same research flows as found in [20] and [19]. In fact, the idea of this paper was inspired by a study conducted to explore the success criteria of building projects in Malaysia [19].
4. Results
A total of 59 completed questionnaires were received representing a response rate of 49%, which is acceptable as Akintoye [21] suggested that most questionnaire survey's response rates fall within the 20–30% range in the construction industry. The professions of the 59 respondents are shown in Figure 2. The respondents consisted of people in managerial positions and professionals in this field.

Current position of respondents
Most of the respondents (12) worked as engineers, while 11 of them were managerial personnel. Meanwhile, the respondents included quantity surveyors, contractors, project managers, consultants and executive directors which are 8, 7, 4, 3 and 3 respondents respectively. There were only 2 architects out of the 59 respondents. Lastly, 9 of them were from other working positions such as contract executives and site supervisors.
Apart from distribution of the professions, the percentage of public listed developers was investigated. The findings show that 32 developers (54.24%) were from public listed companies suggesting the reliable nature of the respondents.
As there were many types of building projects, the respondents were invited to provide more information about that and the results are shown in Figure 3.

Project type involved by respondents
From Figure 3, the respondents may be involved in more than one type of building project. Apparently, most developers had or have been involved in housing projects, followed by shop lots and condominium projects.
The targeted respondents were also invited to provide information about the years of establishment of their company and the results are shown in Figure 4.

Years since company established
As can be seen from Figure 4, the minimum length of time being established was 16 years. In this sense, most developers were established, suggesting that the information provided was appropriate and comprehensive.
Lastly, projects were investigated in terms of value in Ringgit Malaysia (RM) and the results are shown in Figure 5.
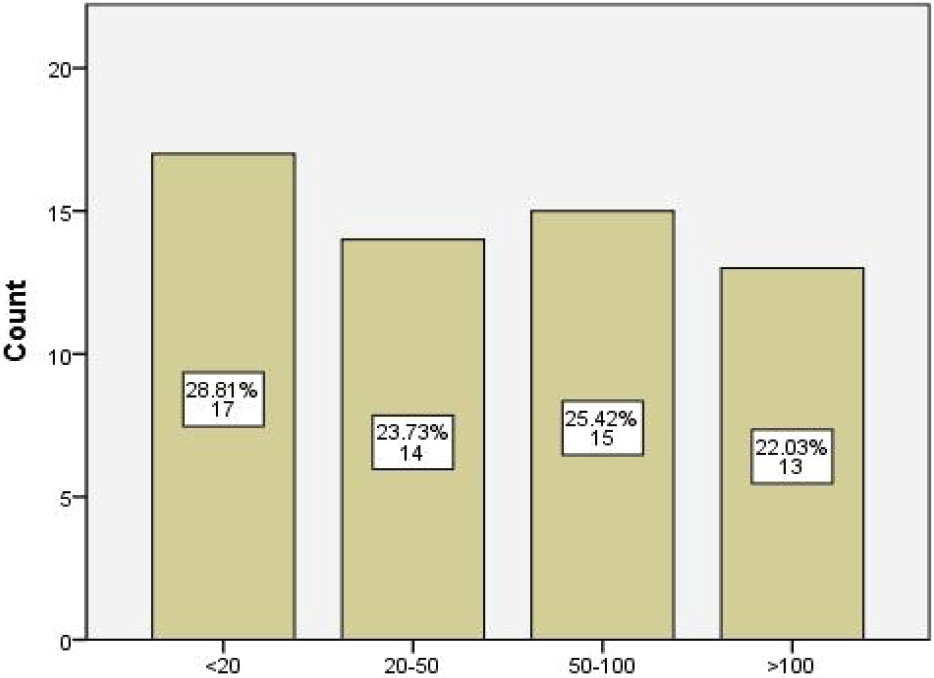
Project size (Million, RM)
The findings represented the average project sizes that the developers had or have been involved in. The distribution of developers in terms of project size was quite even.
By employing PCA, the first condition must be satisfied before proceeding to further analysis. The first condition relates to the adequacy of sample size to establish the reliability of factor analysis [22]. Cronbach's Alpha is commonly used as a measure of the internal consistency and this indicates how well the items in the set were correlated to one another. A reliability coefficient of above 0.7 is considered acceptable [23], the higher the Cronbach's Alpha the better the reliability of the set of variables.
Reliability Statistic
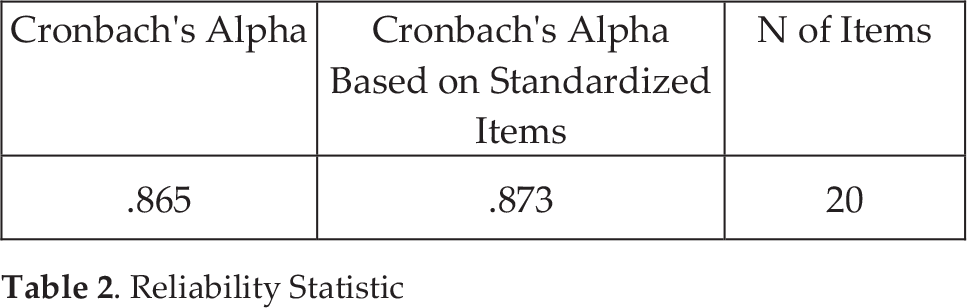
The Cronbach's Alpha of this paper was computed at 0.865, which indicates a high level of internal consistency for our scale with this specific sample.
KMO and Barlett's Test

As for the second condition, Kaiser-Meyer-Olkin (KMO) was used to measure sampling adequacy in the use of factor analysis [24]. The literature recommends that the KMO value should be greater than 0.50 if the sample size is adequate [25].
From the above result, the Kaiser-Meyer-Olkin Measure of Sampling Adequacy has a value of more than 0.50 which is 0.575. This means that the sample size is adequate for factor analysis. Meanwhile, the Bartlett's test of sphericity is also significant suggesting that the population was not an identity matrix [26].
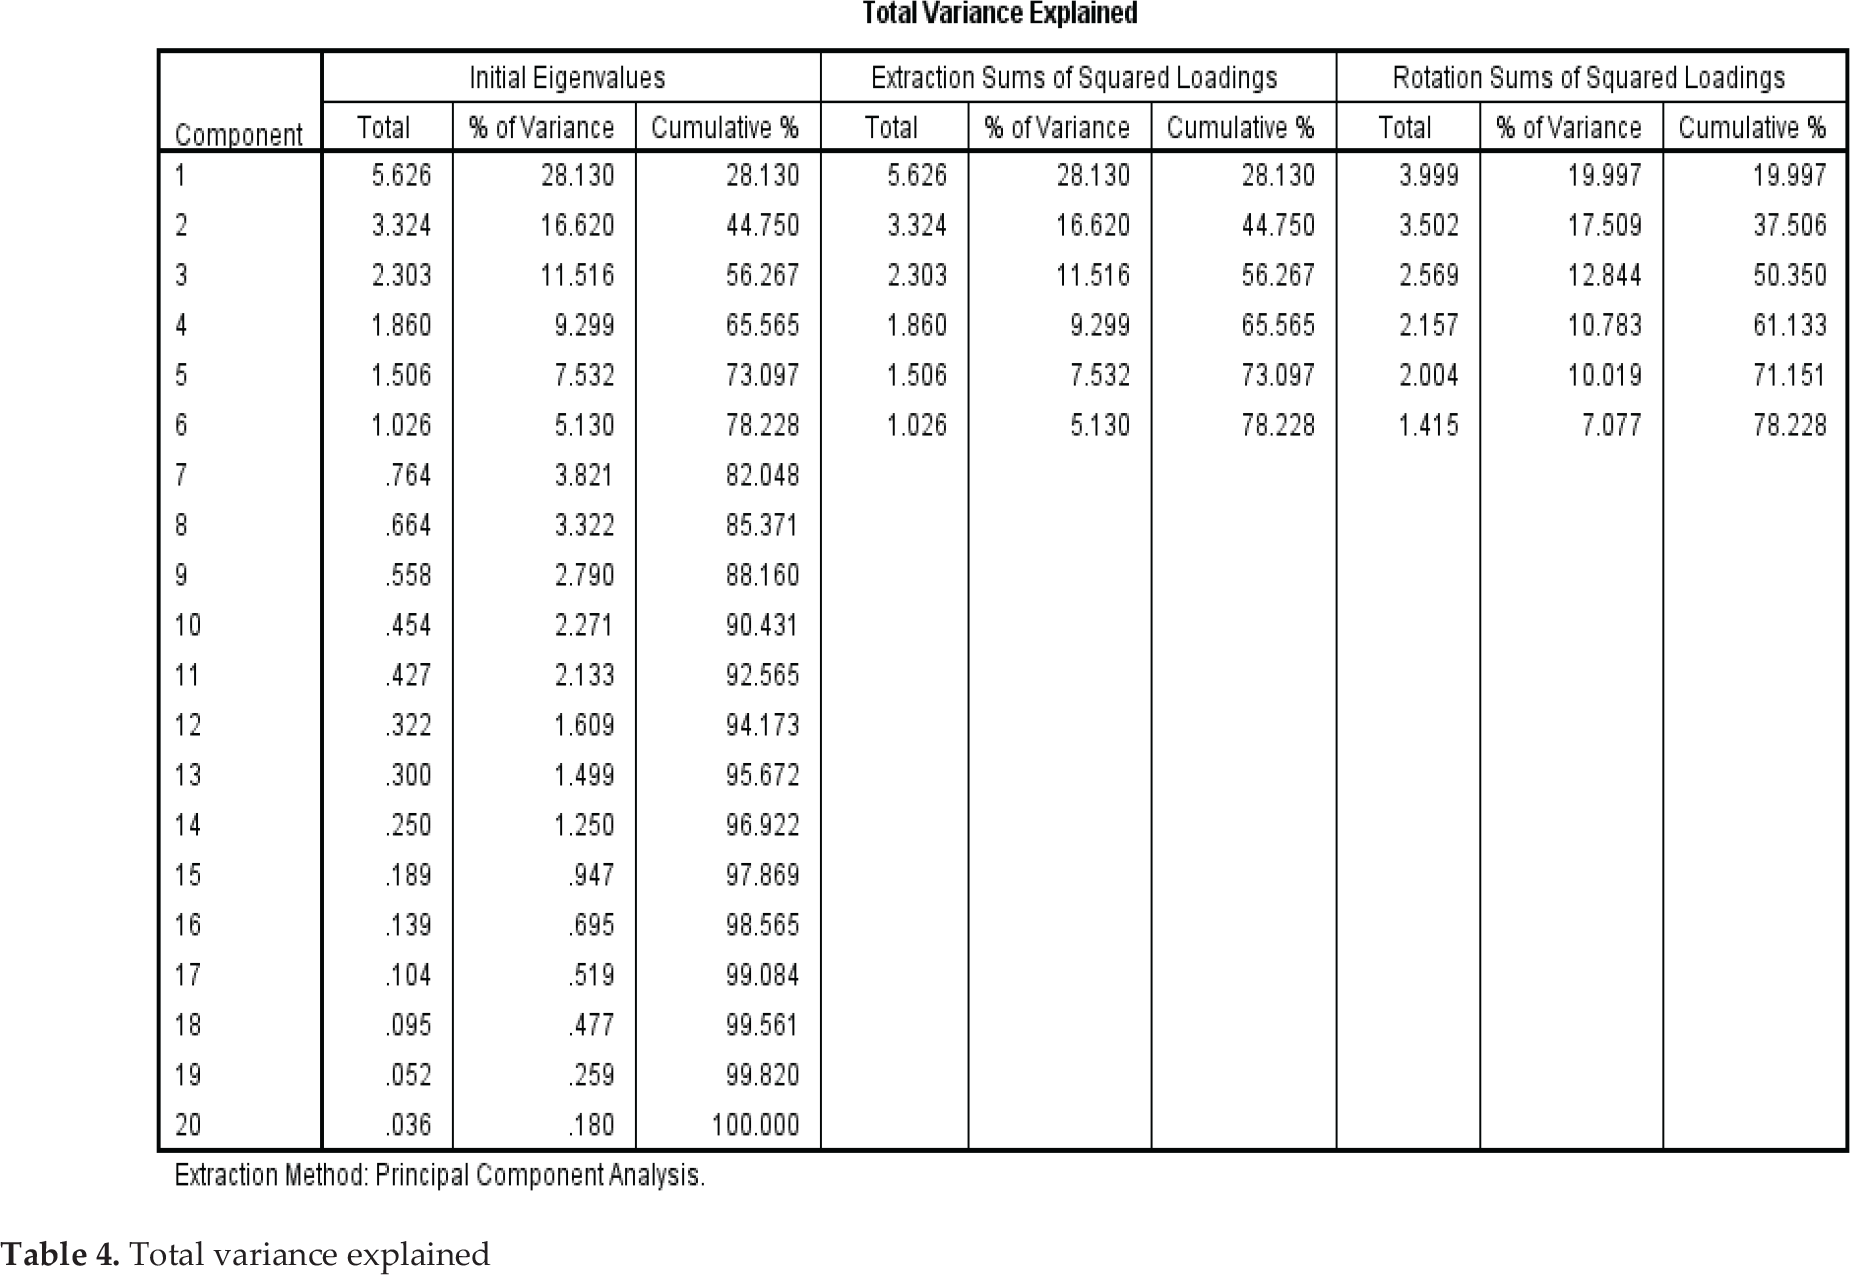
The eigenvalue was set at 1 - components that had an eigenvalue lower than 1 were not considered. This rule of eigenvalue greater than 1 extracted 6 components as shown in Table 4. The total variance explained by Component 1 to Component 6 was 28.130%, 16.620%, 11.516%, 9.299%, 7.531% and 5.130% respectively. The cumulative of total variance explained accounted for 78.228%, which was acceptable because the value explained more than 50% of the total count variance [27].
Total variance explained
Components were then rotated to improve the ability to interpret [28] and the results are shown in Table 5. As for the rotation approach, Varimax's approach was used, which was recommended as a good approach to improve and simplify the interpretability of components by maximizing the loading of each variable on one of the extracted components, whilst minimizing its loading on all the other components [29]. Conventionally, the factor loading value was set at 0.5, only when the variable had a value higher than 0.5 was it loaded into the specific component.
Rotated component matrix
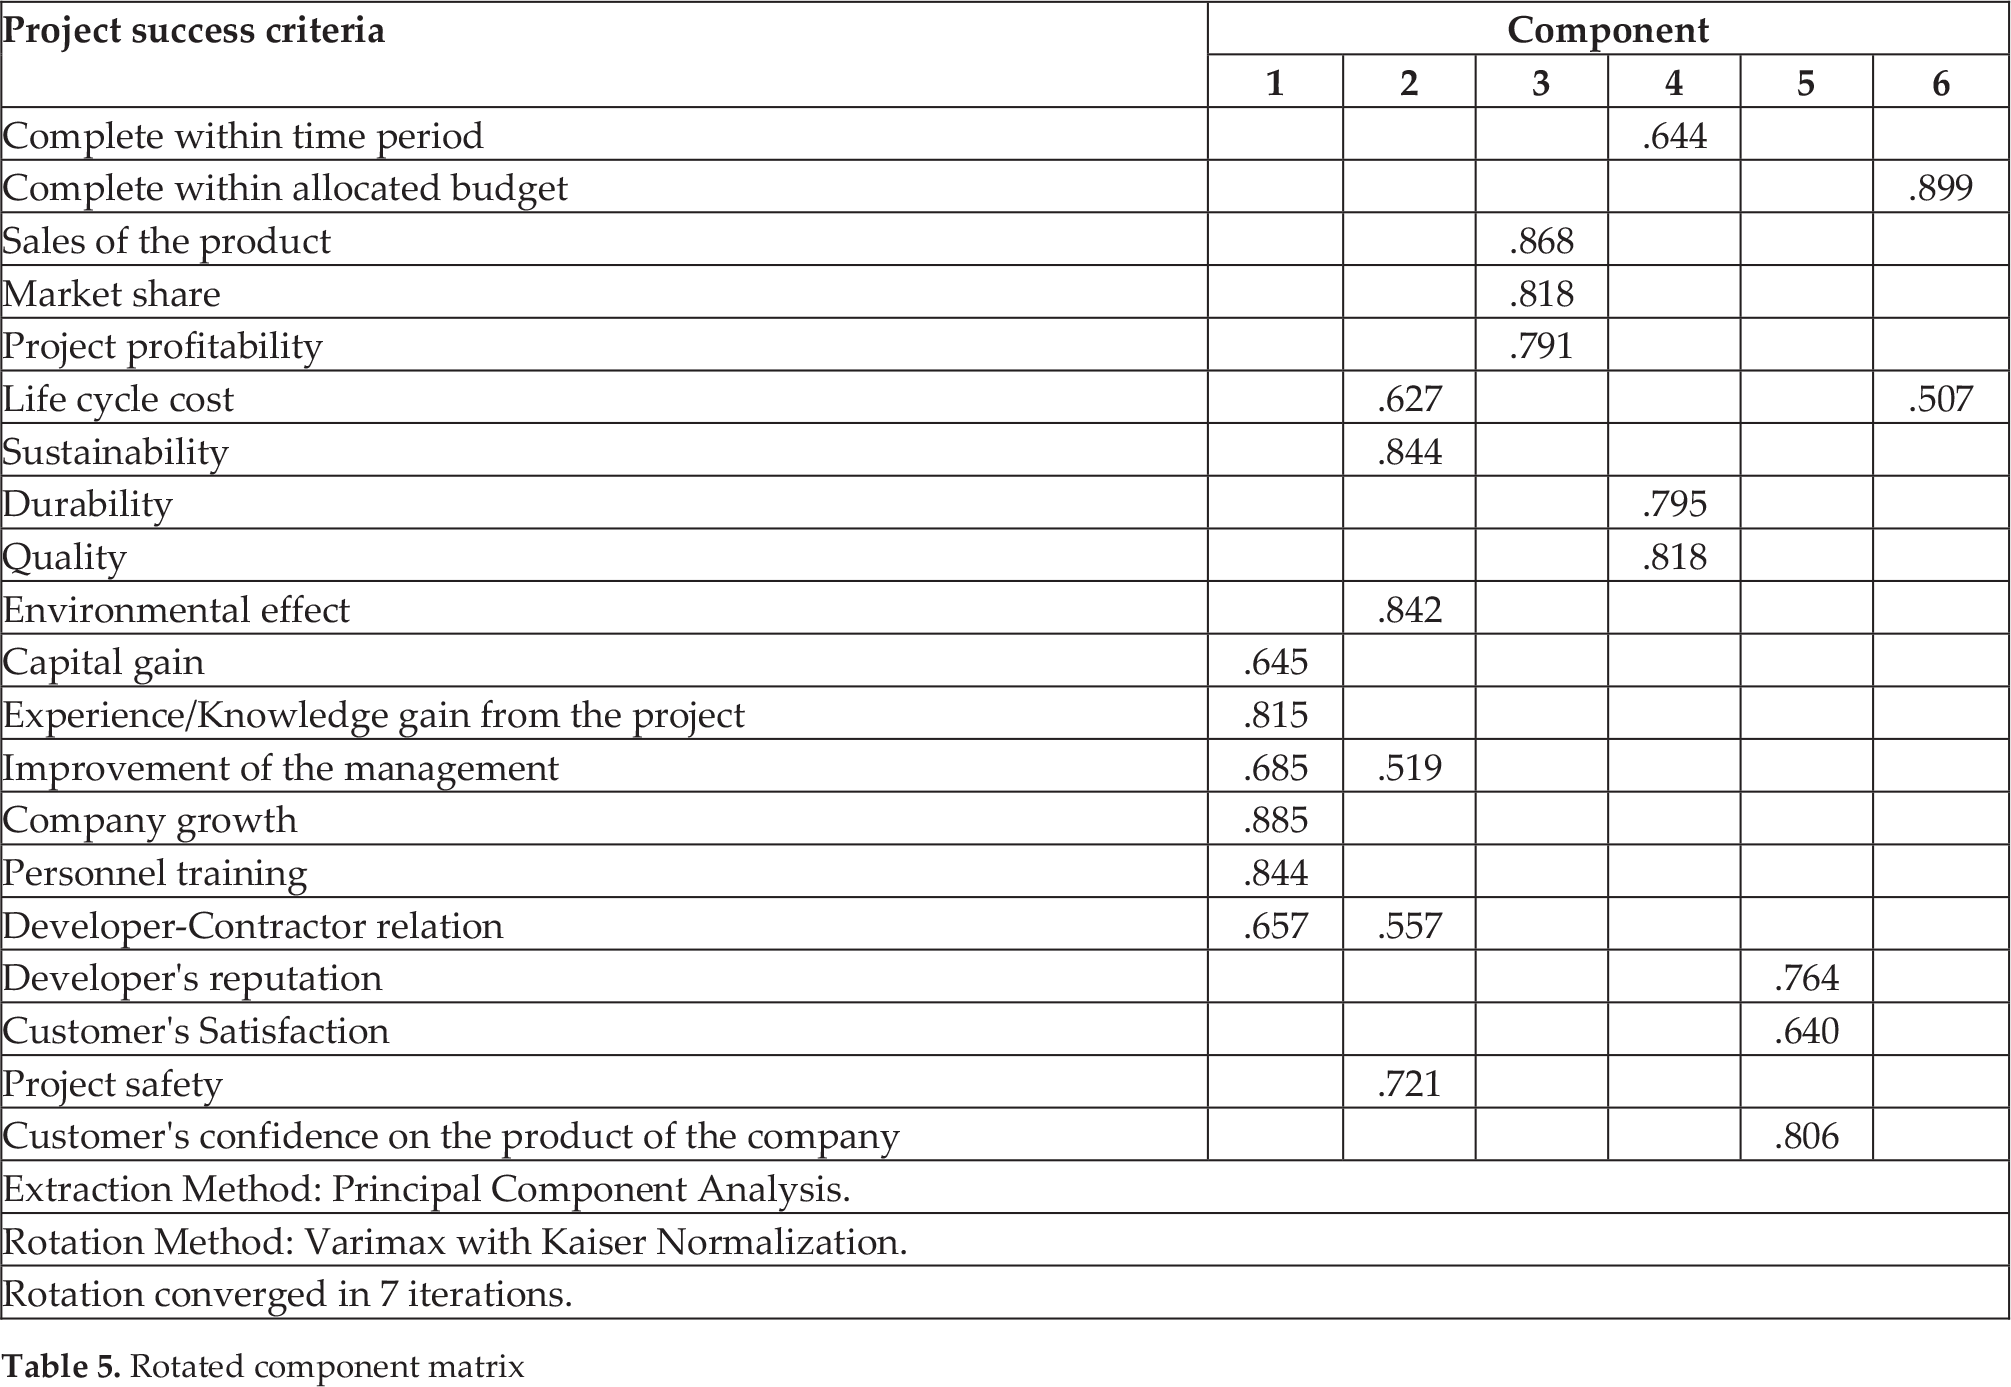
The results showed that the variables capital gain (C11), experience/knowledge gain from the project (C12), improvement of the management (C13), company growth (C14), personnel training (C15) and developer-contractor relation (C16) have factor loadings greater than 0.5 for the first component which were 0.645, 0.815, 0.685, 0.885, 0.844 and 0.657 respectively. Therefore, these variables fit into the first component. The variables C13 and C16 have factor loadings greater than 0.5 in both the first and second component, which represent complex structures among variables [20]. The variables possess a higher factor loading value in the first component which means they fitted better in component 1 than component 2. Therefore, this paper considers that C13 and C16 fitted in component 1.
As for component 2, there were 6 variables with factor loadings higher than 0.5. Since 2 of the variables - C13 and C16 – were already loaded in a component with a higher value, these variables were eliminated from component 2. The rest of the variables life cycle cost (C6), sustainability (C7), environmental effect (C10) and project safety (C19) had factor loadings values greater than 0.5 which were 0.627, 0.844, 0.842 and 0.721 respectively. Meanwhile, component 3 was loaded with the variables sales of the product (C3), market share (C4) and project profitability (C5) which possessed factor loadings of 0.868, 0.818 and 0.791 respectively.
Components 4 and 5 had 3 variables loaded into each. For component 4, there were variables complete within time period (C1), durability (C8) and quality (C9) with factor loadings of 0.644, 0.795 and 0.818 respectively; while component 5 consisted of variables developer's reputation (C17), customer's satisfaction (C18) and customer's confidence on the product of the company (C20) with factor loadings of 0.764, 0.640 and 0.806 respectively.
Lastly, component 6 consisted of 2 variables. Since variable C6 was already considered in component 2, there would be only one variable in this component which was complete within allocated budget (C2), factor loading 0.899.
5. Discussion
This section discusses the major findings of the undertaken research. Component 1 was labelled as company success, component 2 was labelled as secondary product success, component 3 was labelled as profitability success, component 5 and 6 were labelled as primary product success and component 5 was labelled as branding success. It was worth noting that the interpretation of factors requires a certain degree of inventiveness and imagination [30]. Each of the components discussed in are detailed in the following subsection respectively.
5.1 Component 1: Company success
The six extracted success criteria in component 1 were C14 (88.5%), C15 (84.4%), C12 (81.5%), C13 (68.5%), C16 (65.7%) and C11 (64.5%). This component explained 28.13% of the total variance.
The success of the company is always a major objective for every business including property developers. It is very important for developers that their building projects contribute to the success of their company. These criteria company growth, personnel training, experience/knowledge gain from the project, improvement of the management, developer-contractor relation and capital gain contribute to the internal improvement of the company; we can see that if a company was doing well in these criteria, it would bring the company directly to a higher level of success.
This dimension measures how good the building projects are in terms of contributing to the success of the firm.
5.2 Component 2: Secondary product success
This component consisted of 4 criteria C7 (84.4%), C10 (84.2%), C19 (72.1%) and C6 (62.7%). The 4 criteria explained 16.620% of total variance. The variables were labelled as secondary product success because it was the contention that time, cost and quality could reign supreme when measuring success, particularly with respect to the construction industry, which has long been perceived as inherently complex.
Although the criteria were not the primary success criteria, their impact should not be overlooked because the criteria were interrelated in nature. As a case in point, a low level of safety implementation in a construction project could lead to bad environmental effects, which in turn could easily affect the reputation of a developer. Moreover, low sustainability and high life cycle costs of a building project could have greater impact on the environment, thereby requiring higher maintenance costs.
5.3 Component 3: Profitability success
Three criteria were loaded in this component: C3 (86.8%), C4 (81.8%) and C5 (79.1%). This cluster accounted for 11.516% of the total variance. The correlations between these criteria referred to the success in terms of profitability.
Evaluating a building project's success from the commercial viewpoint is very common place and important for the developers as the sale of the building project is the core business for developers; this is where the developer makes his/her profit. For any organization, making profit is still the ultimate objective. Therefore, any building project that brings sizeable profit would be considered a good project.
5.4 Component 4 and 6: Primary product success
Component 4 consisted of C9 (81.8%), C8 (79.5%) and C1 (64.4%) and explained 9.299% of the total variance; while component 6 consisted of C2 (89.9%) and explained 5.130% of the total variance. The 2 clusters (component 4 and component 6) accounted for 14.429% of the total variance.
The criteria complete within time period and complete within allocated budget are referring to 2 of the criteria in the Iron Triangle which are time and cost. Since the Iron Triangle has already been widely accepted for a long time, it was reasonable to merge the components.
The criteria time, cost and quality have already been generally accepted for project success criteria. This paper is no exception and supported that the criteria could not be eliminated from any discussion about success criteria. On the other hand, durability could be impliedly important for building projects because of the nature of construction projects that involve great effort in changing natural landscape. Undoubtedly, buildings able to stand for decades would be one of those ultimate aims from the viewpoint of decision makers (developers).
5.5 Component 5: Branding success
Component 5 accounted 7.532% of the total variance. This cluster was loaded with criteria C20 (80.6%), C17 (76.4%) and C18 (64.0%). The correlations between these criteria referred to the use and confidence of the products of the developers. Thus, it was labelled Branding Success.
Branding could be very important for a developer. Proper branding can result in higher sales of not only one product, but other products associated with that brand. For example, if a house buyer has confidence in the developer and trusts the developer, the buyer is more likely to buy from another building product by that developer. Good branding for developer is very important it could lead the developer to achieve better sales of their building products. Whenever building projects can contribute to branding success for the developers, this raises the success level of the building projects.
6. Conclusion
This paper has made a contribution to the body of knowledge in the sense that it examined the building success criteria from the developers' perspective within the Malaysian construction industry. From the developers' perspective, a building project can only be considered a success when it is capable of integrating 5 success dimensions: company success; profitability success; primary product success; secondary product success and branding success. The dimensions and its associated success criteria were incorporated into a framework as shown in Figure 6. The implications of the empirical framework were twofold. First, it contributes to literature from the stakeholder's perspective. Second, it helps developers to focus critical success elements in measuring the success level of their building projects.

Project success criteria from the developers' perspective
The limitation of the study lay with its low sample size. A total of 59 samples may not be sufficient to represent the whole spectrum of developers in Malaysia. However, the contribution of this paper should not be nullified as it is able to provide a general outlook for the industry on this subject. In addition, as the interpretation of results in PCA requires a certain degree of inventiveness and imagination [30], the findings may not be applicable to other geographical locations.
For future studies, a larger sample size should be used. In addition, researchers could also look deeper into the building project success criteria according to different sizes or types of projects. Difference in size or type may lead to different measurements of success. Moreover, research into the building project success criteria for different sized developers would be interesting - the success criteria of building projects by developers different in capital size may alter.